Available online on 18.07.2019 at http://jddtonline.info
Journal of Drug Delivery and Therapeutics
Open Access to Pharmaceutical and Medical Research
© 2011-18, publisher and licensee JDDT, This is an Open Access article which permits unrestricted non-commercial use, provided the original work is properly cited
Open Access
Research Article
Formulation and Evaluation of Ginger Extract Loaded Nanoemulgel for the
Treatment of Rheumatoid Arthritis
Chandra Amit *, Arya Rajeshwar Kamal Kant, Pal Govind Raj, Tewari Bhawna
Department of Pharmaceutical Sciences Bhimtal campus, Kumaun University, Nainital, India-Pin 263136
ABSTRACT
Ginger is a potent anti-inflammatory; in the present study the nanoemulgel of ginger extract was formulated for treating rheumatoid arthritis through topical application. The main objective of nanoemulgel formulation was to enhance the bioavailability of ginger extract through topical route and also to reduce the dose of ginger extract. First the nanoemulsion was prepared with the help of ternary phase diagram, using water titration method. The Smix (surfactant and co-surfactant) and extract were mixed together then titrated with water. The Smix was used at the ratio of 1:1, 1:2, and 2:1. The isopropyl myristate is used as oil, tween 80 as surfactant, ethanol as co-surfactant and water was used as aqueous phase and, 32 formulations were prepared. The particle size was found in the range of 60.32 to 230.8nm for formulations F1 to F4. The zeta potential was found between -16.6 to -24.4 and the polydispersibility index was found to be 0.687 to 0.892. Nanoemulsion was converted into nanoemulgel by using carbopol 934 as gelling agent in various concentrations. The rheological properties, spreadability, pH, thermodynamic stability and drug release were also determined. On the basis of thermodynamic stability, spreadability and drug release, the nanoemulgel F4* was considered as best formulation.
Keywords: nanoemulgel, nanoemulsion, ternary phase diagram, rheumatoid arthritis, ginger extract, co-surfactant
Article Info:Received 14 May 2019; Review Completed 26 June 2019; Accepted 11 July 2019; Available online 18 July 2019 Cite this article as:
Chandra A, Arya RKK, Pal GR, Tewari B, Formulation and Evaluation of Ginger Extract Loaded Nanoemulgel for the Treatment of Rheumatoid Arthritis, Journal of Drug Delivery and Therapeutics. 2019; 9(4):559-570
http://dx.doi.org/10.22270/jddt.v9i4.3143
*Address for Correspondence:
Chandra Amit, Department of Pharmaceutical Sciences Bhimtal campus, Kumaun University, Nainital, India-Pin 263136
INTRODUCTION
Rheumatoid Arthritis is an autoimmune inflammatory disorder, affecting synovial joints, it damage articular cartilage also causes bone erosion and deformity.1 NSAIDs
are the first line drugs and afford symptomatic relief in pain, swelling, morning stiffness, immobility, but they do not arrest the disease process.2 Drug therapy is targeted to
ameliorate pain, joint stiffness, articular cartilage damage, bone erosions, and also to preserve joint function.3
Treatment usually begins with medications to reduce pain and inflammation in mild to moderate cases of arthritis. Drugs such as analgesics, non-steroidal anti-inflammatory drugs with some immunosuppressant are drug of choice in relieving pain, inflammation and stiffness of joints. 3 These
treatments have various side effects like g.i. disturbance, poor immunity, hepatic and nephrotoxicity, Herbal based treatment have good tolerability, safety and effectiveness than above conventional treatment,Herbal drugs are gaining popularity in the treatment of chronic disease like jaundice, vitiligo, rheumatoid arthritis, asthma etc. [4, 5] Ginger
(extract of Gingiber officinale) act as a potent anti-inflammatory. 5, 6, 7 6-Gingerols, gingerdiol, gingerdione,
shogaol and paradol are the active principles of ginger extract. Studies revealed that 6-gingerolshows in-vivo anti-inflammatory properties after intra peritoneal or topical administration 8, 9, 10
Nanoemulgel has appeared as a novel drug delivery system which allows sustained or controlled drug release,11 it is a
dual release control system i.e. nanoemulsion in hydrogel. Nanoemulgel is nanosize (10-100nm); it rapidly penetrates and deliver drug deeper and quicker. Gelling agent make nanoemulsion stable of by reducing the surface and interfacial tension and also enhance the viscosity of the aqueous phase for drug administration,12 this would
influence the transport properties of the drug.[13, 14, 15]
Nanoemulsion can encapsulate a diverse range of lipophillic compounds, including bioactive lipids, flavours, antimicrobials, antioxidants, and drugs leading to the increase of their bioactivity, desirability, and palatability.[11, 15] The Nanoemulsions are colloidal dispersions composed of
leads to spontaneous formation of a thermodynamically stable nanoemulsion.16
The main object of this study is to formulate effective topical formulation which can enhance the penetration of active constituents of ginger extract through skin for a better local as well as systemic effect.
MATERIAL AND METHOD
Ginger extract was purchased from Herb Sky Bio-tech Co. Ltd. China; Isopropyl Myristate was purchased from Moychem Pvt. Ltd., Methanol, Ethanol, Chloroform, Acetone, Carbopol 934, Potassium dihydrogen phosphate (KH2PO4),
Sodium chloride and Tween80 were obtained from from Loba Chem Pvt. Ltd. Mumbai. All material were use were of analytical grade. Double distilled water was used as aqueous solvent.
Physical Characterization and Identification 12
Physical examination 12
In the preformulation study the physical inspection of ginger extract is done firstly for its appearance, colour and taste for identification.
FTIR Analysis12
FTIR analysis was done on FTIR spectrometer (Ver. 7.03 Shimadzu, Japan) with KBr disc. In the FTIR infrared spectroscopy the spectrum was recorded in the wavelength region of 4000-400 cm-1. 10 mg of drug was mixed with KBr
and triturated then it was placed in holder and pressed to form a pellet. Then it was placed under IR beam and a spectrum was obtained on computer.
Determination of λmax by UV-Spectrophotometer
A 10 mg of drug extract was dissolved in 10 ml of methanol. Then 1 ml of stock solution (1000 µg/ml) produced was pipette into a 10 ml volumetric flask and volume made up to the mark with methanol. Now 1 ml of stock solution (100µg/ml) produced was again pipette into 10 ml volumetric flask and volume made up to the mark with methanol. Aliquots of different concentration were separately scanned in UV range between 200-400 nm using methanol as a blank to determine the wavelength of maximum absorption (λmax) for the drug extract by using
UV/Visible spectrophotometer. It was found to be 281 nm.
Partition coefficient 12
The partition coefficient of the drug was determined in n-octanol/distilled water. 10 mg of drug extract was accurately weighted and added to a mixture containing 25 ml of each of n-octanol and distilled water in separating funnel. The flask is then shaken for 30 minutes and set aside for 24 hrs. In between it was shaken for equilibration. The mixture is then set aside to get equilibrate for 10 hrs. Two phases were separated and the amount of the drug in aqueous and organic solvent was determined by UV spectroscopy after appropriate dilution at 281 nm.
Total phenolic content [17]
The amount of total phenolics in extracts was determined with the Folin- Ciocalteu reagent. Gallic acid was used as a standard and the total phenolics were expressed as mg/g gallic acid equivalents (GAE). For this the calibration curve of gallic acid was drawn, the standard solutions of concentration 5-350µg/ml of gallic acid were prepared in methanol. Concentrations of 100µg/ml of plant extract were
also prepared in methanol. 0.5ml of each sample were introduced into test tubes and mixed with 2.5ml of a 10 fold dilute Folin-Ciocalteu reagent and 2ml of 7.5% sodium carbonate. The tubes were closed and allowed to stand for 30 min at room temperature and later the absorbance was read at 760 nm by spectrophotometer. The conc. is determined by extrapolating the absorbance of ginger extract.
Antioxidant activity: DPPH radical scavenging activity
[18]
This test was measured as described by Blois. One ml of the fraction solutions (10, 20, 40, 80, 160, 320 and 640 μg/ml in ethanol) was added to 1ml of a DPPH solution (0.2mM in ethanol). After the 30 min of reaction at room temperature, the absorbance of the solution was measured at 517 nm. The free radical scavenging activity of each fraction was determined by comparing its absorbance with that of a blank solution. The ability to scavenge the DPPH radical was calculated using the following equation:
Where, A0 is the absorbance of the control and A1 is the
absorbance of the sample.
Anti-inflammatory activity (Anti-denaturation activity)
19
The reaction mixture was consisting of test extracts and 1% aqueous solution of bovine albumin fraction were prepared, the pH of the reaction mixture was adjusted using small amount of HCl. The sample extracts were incubated at 37⁰C for 20min and then heated to 51⁰C for 20min, after cooling the samples the turbidity was measured spectrophotometrically at 660nm. The experiment was performed in triplicate. Percent inhibition of protein denaturation (precipitation) was determined on a percentage basis relative to control using the formula:
( )
Where, A0 is the absorbance of the control and A1 is the
absorbance of the sample.
Screening of Oil, Surfactant and Co-surfactant
On the basis of solubility of ginger extract, oils, surfactants and co-surfactants were screened out. The solubility of ginger extract was determined in various oils (oleic acid, isopropyl myristate, olive oil) Surfactants (tween80, span20, tween 20) and co-surfactant (polyethylene glycol (PEG 600, ethanol, propylene glycol). The ginger extract was taken in excess in centrifuge tubes and 5ml of each of oil, surfactant and co-surfactant was added. The mixtures were shaken in vortex mixer for 15min. After 24 hrs samples were centrifuged for 15min at 3000rpm. The supernatant was then filtered through Whatman filter and diluted with methanol and analyzed in UV-visible spectrophotometer at 281 nm, all samples repeated thrice.
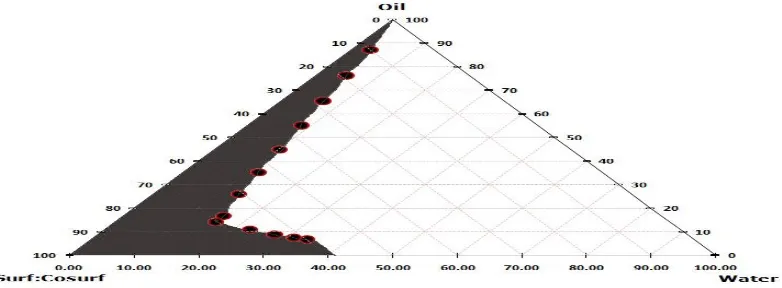
Construction of pseudo-ternary phase diagrams
On the basis of solubility isopropyl myristate is selected as oil, tween 80 as surfactant and ethanol as co-surfactant respectively and water was used as aqueous phase. The
water titration method was employed for the construction of
pseudo-ternary phase diagram to determine the appropriate
amount of components in nanoemulsion (NE) formulation.20
The surfactant and co-surfactant (Smix) were mixed in
pseudo ternary diagrams were constructed, each Smix ratio
was mixed with oil phase to give the 12 different weight ratios of Smix and oil are 9:1, 8:2 , 7:3, 6:4, 5:5, 4:6, 3:7, 2:8,
1:9, 8:1, 7:1 and 6:1. (Total 36 formulations were prepared). Then these mixtures were titrated with water with and continuously stirred in magnetic stirrer at room temperature. In titration water was added drop wise to oil and Smix mixture with gentle stirring until mixture remain
clear. Based on the results of pseudo-ternary diagram, appropriate range of the components was selected. The
blank o/w NE was prepared by water titration method and visual observations were made for transparent and easily flowable oil-in-water (o/w) nanoemulsion. The physical state of the true nanoemulsion was marked on a pseudo ternary phase diagrams with one axis representing the aqueous phase, and the other representing a mixture of surfactant and co-surfactant at fixed weight ratios (Smix
ratios). Pseudo-ternary phase diagram was plotted using XLSTATE 2018.
Fig. 1 Pseudo-ternary phase diagram at 1:1 weight ratio of surf: cosurf
Fig. 2 Pseudo-ternary phase diagram at 2:1 weight ratio of surf: cosurf
Fig. 3 Pseudo-ternary phase diagram at 3:1 weight ratio of surf: cosurf Preparation of ginger extract loaded nanoemulsion
On the basis of their visual observation like transparency and viscosity, four formulations were selected out of 36 formulation (12 each from 1:1, 2:1, and 3:1 ratio) for preparing ginger extract loaded nanoemulsion. The required amount of ginger extract was dissolved in the calculated
quantity of oil phase for the said volume of nanoemulsion. The calculated quantity of Smix (surfactant and co-surfactant)
Table: 1. four best formulations Surf:
Cosurf Formulation % ginger of
extract
Surf : Cosurf (ml)
Oil
(ml) Water (ml) % surf: of Cosurf
% of
Oil % of water Transparency Viscosity (η)
1:1 F1 0.33 6 1 2 66.66 11.11 22.22 Very Good Less
2:1 F2 0.33 7 1 1.5 76.08 10.52 13.04 Very Good Less
3:1 F3F4 0.33 0.33 8 7 2 1 1.6 3 61.53 74.46 15.38 10.41 14.89 23.07 Very Good Very Good Less Less
Characterization of Nanoemulsion Physical characterization
The prepared nanoemulsion formulations were visually inspected for their colour, transparency, homogeneity and consistency.
Droplet Size and Size Distribution 12, 21, 2 2
Droplet size was determined by photon correlation spectroscopy (PCS) that analyses the fluctuations in light scattering due to Brownian motion of the droplets using a Zeta sizer (1000 HS, Malvern Instruments, Italy). 0.1ml nanoemulsion was dispersed in 50ml of water in a volumetric flask, mixed thoroughly with vigorous shaking and light scattering was monitored at 25°C a 90° angle.
Zeta potential analysis 12, 21, 2 2
Zeta potential of a droplet is the overall charge that the particle acquires in a particular medium. Knowledge of the zeta potential of nanoemulsion helps to assess the stability of the formulation during storage.
Measurement of pH 12
The pH values of the nanoemulsion were measured at 250C
using digital pH meter. 10% w/w dispersion (1gm of nanoemulsion was dispersed in 10 ml of distilled water. At first the reading of pH- meter was adjust with a known pH solution (pH 4 and pH 7). Then the prepared formulations were subjected for pH analysis.
Measurement of Viscosity 12
The viscosities of nanoemulsion formulation were measured at 250C using Brookfield viscometer (Brookfield DV-E
Viscometer) using spindle no 6 at 10, 20.30 and 60 rpm.
Thermodynamic stability studies 12
Nanoemulsion is kinetically stable systems and is formed from a particular concentration of oil phase, surfactant and water, with no phase separation, creaming or coalescence at room temperature. All the selected formulations underwent the following tests:
Centrifugation 12
This method helps to determine the separation rate; this is quite simple and inexpensive for full- proof identification of the system as nanoemulsion. Nanoemulsion were subjected to centrifugation at 3000 rpm for 30 minutes and then examined for any phase separation.
Heating-Cooling Cycle12
The formulation that did not show any phase separations were taken for the heating-cooling cycle. The formulations were stored between refrigerator temperature 40C and 450C
for not less than 48hrs at each temperature, such six cycles
were conducted. The formulations that were stable at these temperatures were subjected to the freeze-thaw cycle test.
Freeze-Thaw Cycle12
These freeze-thaw cycle were done for the formulations between 00C and 250C
Selection and Optimization of Gelling Agent
For the preparation of nanoemulgel Carbomer 934, HPMC and Tragacanth were used as gelling agents in various ratios i.e., 0.5%, 0.75%, 1.0% and 1.25 % (gels made with specified concentration range in the water). The mixed mass was stirred for the time, gels were added slowly into nanoemulsion, mixed and kept aside to settle the air entrapment and assessed next day for visual property.The gelling agent was selected for further preparation of nanoemulgel. The gel made with selected polymer concentration of at various concentrations (0.5%, 0.75%, 1.0% and 1.25).
Characterization of Nanoemulsion Gel 12, 22, 23, 24
Finally selected formulations were characterized for various attributes like physical examination, FTIR, pH, Spreadability, viscosity, zeta potential, drug content, in-vitro diffusion studies and stability studies
Drug Content Determination12, 21, 22
Thedrug content of ginger extract in nanoemulsion gel was determined by UV-Spectrophotometer. 1.0 g of formulation was accurately weighed, dissolved in 100 ml of methanol: phosphate buffer (2:8). It was filtered and diluted if required. Absorbance was determined using UV spectrophotometer at 281nm
Spreadability 12, 23,24
1g emulgel preparation was placed above ground slide and second glass slide having same dimension as that of the fixed ground slide. The second glass slide is provided with the hook. A weight of 100 g was placed on the top of the two slides for 5 min to expel air and to provide a uniform film of the emulgel between the two slides. Measured quantity of weight (35g) was placed in the pan attached to the pulley with the help of hook. Time in seconds taken by two slides to slip off from emulgel and placed in between the slides under the direction of certain load. Lesser the time taken for separation of two slides, better the spreadability. It is calculated by using the formula.
Where 𝑆 is spreadability, 𝑚 is weight placed on upper slide, 𝑙 is length of upper slide, and 𝑡 is the time taken
The thermodynamic stability studies such as centrifugation; heating-cooling cycle and freeze-thaw cycle were performed on all selected formulations. The formulations, which showed, no phase separation, creaming, cracking, coalescence, and phase inversion during stress stability tests were selected.
In-vitro Release Study of Ginger Extract Loaded
Nanoemulgel Formulations 12, 20, 21
The in-vitro permeation studies were carried out using Franz diffusion cell, which is a reliable method for prediction of drug transport across the skin. These studies were conducted employing dialysis membrane. The receptor compartment of the diffusion cell was filled with 25 ml of phosphate buffer pH 7.4. The whole assembly was fixed on a magnetic stirrer and the solution in the receptor compartment was constantly and continuously stirred using magnetic beads at 100 rpm and the temperature was maintained at 37 ± 0.50°C throughout the experiments.
In-Vitro Drug Release Kinetics 20, 21, 25
For study the release kinetics, data obtained from in-vitro
permeation studies were fitted in various kinetic models and the exponent n was calculated from the slope of the straight line.
Zero-order describes the system where the release rate of
drug is independent of its concentration. The equation is
First- order release rate equation describes the system where the drug release rate from a system is concentration dependent.
The integrated form of the equation is:
Higuchi was the first to derive an equation to describe the
release of a drug from an insoluble matrix as the square root of a time-dependent process based on Fickian diffusion.
Korsmeyer et al derived a simple relationship which
described drug release from a polymeric system. To find out the mechanism of drug release, first 60% drug release data was fitted in Korsmeyer–Peppas model:
The n value is used to characterize different release mechanisms as given in table below:
‘n’ value to characterise release mechanism Diffusion
exponent (n) Overall diffusion mechanism
0.45 Fickian diffusion
0.45 < n < 0.89 Anomalous (non-fickian) diffusion
0.89 Case- II transport or typical zero order release
n > 0.89 Super class-II transport
RESULTS
Preformulation Studies
The preformulation studies of ginger extract were performed, the ginger extract was found as yellow brown resinous amorphous powder with pungent characteristic taste of ginger, the total Ash value was found to be 2.49%, and the loss on drying was2.18%. The λmax of ginger extract
was found to be 281 nm.
Partition Coefficient
The partition coefficient (log p) was determined by shake flask method. The log p value of ginger extract was found as 3.24.
Solubility studies
The solubility of extract was determined in various solvent, the extract is more soluble in non-polar solvents than polar ones, the solubility was found 0.6 mg/ml (in distilled water), 13.60 mg/ml (in phosphate buffer pH7.4), 30.08 mg/ml (in methanol), 32.13 mg/ml (in ethanol) 26.10 mg/ml (in acetone, 39.90 mg/ml (in chloroform) and 34.62 mg/ml (in benzene).
Total Phenolic Content
The total phenolic content of ginger extract was calculated with Folin-Ciocalteu reagent and acid was taken as standard. The total phenolic content of the sample was found to be 310.2mg/gm.
Antioxidant Activity
The DPPH radical scavenging method was used to investigate the radical scavenging activity of ginger extract. DPPH is a stable free radical that accepts an electron or hydrogen radical and forms a stable diamagnetic molecule. The antioxidants reduce the stable DPPH radical to a yellow colour diphenyl-picrylhydrazine with λmax at 517 nm.26 The
Fig. 4: The effect of ginger extract and known antioxidant (ascorbic acid) on DPPH radical scavenging activity. The results represent mean ± SD of 3 separate experiments.
Anti-inflammatory
The protein denaturation is main cause of inflammation. Percent inhibition of protein denaturation (precipitation) was determined on a percentage basis relative to control without sample (ibuprofen). The anti-inflammatory activity
was found to be up to 73.82 % at concentration of 500µg /ml represented relative to ibuprofen which was observed as 75.68% at concentration of 500µg /ml. The ginger extract shows the anti inflammatory activity almost equal to the standard ibuprofen.
Fig. 5: Inhibition of albumin denaturation by ginger extract and standard ibuprofen (anti-inflammatory activity)
0
10
20
30
40
50
60
70
80
90
0
100
200
300
400
500
600
700
A
b
sor
b
a
n
ce
Concentartion (µg/ml)
Antioxidant activity
Ginger extract
Ascorbic acid
0
10
20
30
40
50
60
70
80
0
100
200
300
400
500
600
%
i
n
h
ib
it
io
n
Concentartion (µg/ml)
Anti-inflammatory activity
ginger extract
Drug –Excipients Compatibility Study By FTIR Spectroscopy FTIR of Ginger extract
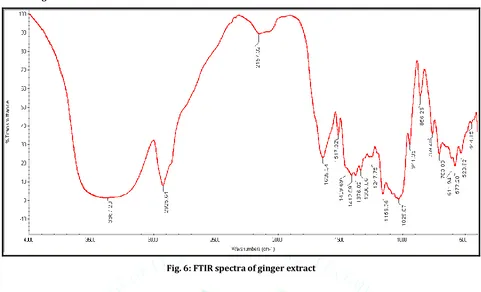
Fig. 6: FTIR spectra of ginger extract
In Fig.6 the FTIR spectra of ginger extract is given, which show the characteristic band at 3367.20 cm-1 (O-H
stretching), 2925.64 cm-1 (CH2 methylene stretch), 1639.34
cm-1 (C=O stretch) 1459.69 cm-1 (C=C aromatic ring stretch),
1376.02 cm-1 (CH3 methyl bond sym), 1029.87 cm-1 (C-OH
stretch CH2OH) and 611.94 cm-1 (Phenolic O-H bond).
In Fig. 7 the FTIR spectra of ginger extract and physical mixture of all excipients (isopropyl myristate, tween-80 and ethanol) is given. The FTIR spectra showed the
characteristic absorption band of ginger extract at 3579.13 cm-1 (O-H stretching),2855.15 cm-1 (CH2 methylene stretch),
1639.34 cm-1 (C=O stretch), peak 1461.09 cm-1 (C=C
aromatic ring stretch ), 1377.27 cm-1 (CH3 methyl bond
sym),1047.24cm-1 (C-OH stretch (-CH2OH) and the peak
615.94 cm-1 (Phenolic O-H bond). All the peaks were found
intact and there no significant changes were observed in characteristics peaks of pure extract when compared with pure extract. This indicates the extract is compatible with other excipients.
Fig. 7: IR Spectra of composite (ginger extract + isopropyl myristate + tween 80 + ethanol)
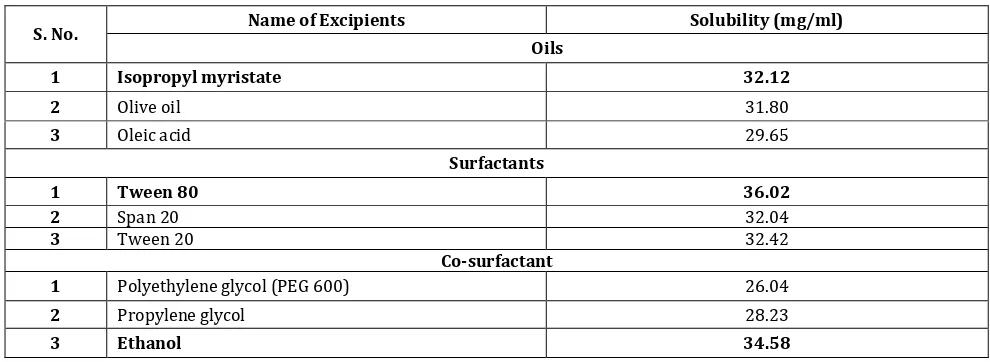
Screening and Selection of Oils, Surfactants and Co-surfactants
Screening of oils, surfactants and co-surfactants are based on their solubility profile for ginger extract. The Isopropyl
Table: 2 Solubility profile of extract in oils, surfactants and co-surfactants
S. No. Name of Excipients Solubility (mg/ml)
Oils
1 Isopropyl myristate 32.12
2 Olive oil 31.80
3 Oleic acid 29.65
Surfactants
1 Tween 80 36.02
2 Span 20 32.04
3 Tween 20 32.42
Co-surfactant
1 Polyethylene glycol (PEG 600) 26.04
2 Propylene glycol 28.23
3 Ethanol 34.58
Formulation and Selection of Nanoemulsion and Nanoemulsion Gel
Nanoemulsion was prepared with the help of pseudo-ternary phase by water titration method. On the basis of pseudo-ternary diagram, appropriate range of the component was selected. The formulations are given in the table no 1.
Characterizations Particle Size Analysis
The particle size was found in the range of 60.32-230.8nm for formulation F1 to F4. The zeta potential was found between -16.6 to -24.4. The high value of zeta potential confirms the stability of nanoemulsion, and the polydispersibility index was found to be 0.687 to 0.892. All the results are given table 4.
Table: 4
Formulation Particle Size (nm) PDI Zeta Potential Drug content (%)
F1 230.8±2.01 0.687±0.0221 -18.1 89.16±0.91 F2 202.2±0.89 0.722±0.137 -16.6 82.77±2.81 F3 176±0.91 0.706±0.121 -24.4 96.91±2.90 F4 60.14±1.03 0.664±0.213 -22.2 93.53±2.09
Fig. 9: Zeta potential A) formulation F3 and B) formulation F4
Selection of gelling agent
In the preliminary trials, Carbomer 934, HPMC K4 and tragacanth gels were prepared by using various concentrations in water. The gelling agents (Carbopol 934, HPMC K4 and tragacanth) were added in certain amount to the each selected nanoemulsion formulation and stirred for some time and then kept overnight to form nanogel. Next day the gels were inspected visually for their colour, clarity, transparency, homogeneity, clogs, grittiness and consistency.
Only Carbopol gel was found to be more transparent, clear, homogeneous without grittiness, while gel with HPMC K4 and tragacanth were turbid and cloudy. Carbopol was then selected for further optimization. Total 16 formulations were prepared by dispersing each selected nanoemulsion formulations F1, F2, F3 and F4 into various concentration range of Carbopol 934 (0.5, 0.75%, 1%, and 1.25%). All the 16 formulation were kept for overnight to form nanoemulgel. Next day the formulations were examined visually for its colour, clarity, transparency, homogeneity and applicability.
Table: 5 Formulations of NEgels
Gelling agent % w/v Appearance of NEgels (NE + gelling agent dispersed)
F1* F2* F3* F4*
Carbomer 934 0.5% √ √ √ √
0.75 √ √ × ×
1% × × ×× ××
1.25% ×× ×× ××× ×××
√ = are clear, transparent, homogenous and no grittiness and no clogs were found and suitable consistency, have spreadability and adhesiveness as well
+ = clear, transparent, homogeneous, no grittiness but less and pourable consistency
× = clear, transparent but slightly grittiness
×× = clear, transparent, but more grittiness
××× = dense mass was formed with no spreading
From the study it was revealed that the formulations prepared with 0.5% have passed all visual test and it was
conformed, the most effective gel was made with Carbopol 934 of 0.5% conc. w/v.
Stability analysis
All formulations were found physically stable after being subjected to centrifugation test, heating-cooling cycle and freeze-thaw for one month. All formulations passes centrifugation test, heating-cooling cycle and freeze-thaw test only formulation F2* fails on heating-cooling cycle and freeze-thaw test.
Table 6.21 Stability analysis of selected nanoemulsion formulations
Formulations Centrifugation test Heating-cooling cycle Freeze-thaw
F1* Pass Pass Pass
F2* Pass Fail Fail
F3* Pass Pass Pass
pH determination
The pH value for the selected NE (F1, F2, F3 and F4) formulation was found to be 6.21 to 6.89. The pH of the NE was found to be within the range of pH of skin (5-7) and
would not cause any irritation to the skin. Thus, prepared NE formulations are suitable for skin application and the formulated nanoemulgel are also suitable for skin application.
S. No. Formulation code pH value of NE pH value of NEgel % spread by Area
1 F1* 6.29 5.30 92.0
2 F2* 6.45 5.69 88,0
3 F3* 6.21 5.36 95.0
4 F4* 6.89 5.67 87.2
Viscosity Measurement
Brookfield viscometer was used to measure the viscosity of nanoemulsion and nanoemulsion gel (NEgel) at different spindle speeds. Viscosity reveals the rheological properties
of all nanoemulsion formulation. All formulation shows shear thinning effect as the shear stress increased the viscosity was decreased. Formulation F4 was found more viscous than other formulations.
Fig: 10: Viscosity of F1.F2. F3 and F3 at various rpm
Fig. 11: Viscosity of nanoemulgel at various rpm Spreadability
Spreadability determined as % increase in area of gel upon pressing with certain weight. All formulations have shown good spreadability.
Drug Content of Nanoemulsion Gel
Drug content in the nanoemulgel (which is made by adding gelling agent in NE) is supposed to be decreased in some extent because of gelling agent which occupies some volume as it swells in formulations so it was determined by UV spectrometer at 281 nm for the same. The range of percentage drug content of nanoemulsion Gel was 82.77% to
96.91%. The percentage drug content of formulations was within a permissible range. The percentdrug content was found as 89.16%, 82.77%, 96.91% and 93.53% for Nanoemulgel (NEgel) formulations F1, F2, F3 and F4 respectively.
In-Vitro % Drug Release of Nanoemulgel
The in- vitro drug release study of nanoemulsion gel (NEG) was performed by using Franz diffusion cell the drug release was found to be 67.55±2.32 % to 87.56 ±3.5% in 5hrs. The F4 shows the highest drug release 87.56 % in 5hr and the F2 shows the lowest drug release 67.55 % in 5hr.
0 200 400 600 800 1000 1200 1400
0
10
20
30
40
50
60
70
V
isc
osi
ty
o(
ce
n
ti
p
oi
se
s)
RPM of Spindle
Viscosity of Nanoemulsion
F1
F2
F3
F4
0
1000
2000
3000
4000
5000
6000
7000
8000
9000
10000
0
10
20
30
40
50
60
70
V
is
co
si
ty
(c
e
n
ti
p
o
is
e
)
Spindle Speed (rpm)
Fig. 12: In-vitro drug release of nanoemulgel
In-vitro drug release kinetic modelling of nanoemulsion gel
The drug release of all nanoemulsion gel, were fitted into zero order, first order, Koresymer Peppas and Higuchi models. The results of statistical analysis of curve estimation were used in order to develop regression models that have the best R2 values, formulation F1 followed the zero order
drug release pattern, the R2 value and n value was found to
be 0.983 and 0.051 respectively, this may be due to their
surfactant- cosurfactant ratio. This may be because of less surfactant in formulation so why release is independent of concentration. The drug release from formulationF2 was best fitted to zero order model release pattern, the R2 value
and n value was found to be 0.977 and 0.002 respectively. This is also because of less conc. of surfactant. The drug release from formulation F3 and F4 best fitted to Koresymer Peppas’ model, formulation F3 followed the Super class-II transport whereas the formulation F4 followed the non-fickian transport.
Table 6.29 Drug release kinetics equations and R2 values of formulation F1, F2, F3 and F4
Release Model Formulation code F1 F2 F3 F4
Zero order R2 value N 0.983 0.003 0.977 0.002 0.982 0.003 0.986 0.003
First order R2 value N -0.002 0.960 0.973 0.000 -0.002 0.978 -0.002 0.974
Higuchi model R2 value N 0.942 0.058 0.966 0.036 0.920 0.058 0.940 0.057
Korsmeyer-Peppas R2 value N 0.976 0.767 0.960 0.459 0.987 0.933 0.992 0.837
CONCLUSION
The main focus of formulating ginger extract loaded nanoemulsion was to minimize the adverse effects of orally administered NSAIDs and DMRADs for the treatment of arthritis, as well as reducing the oral dose of ginger extract, ginger extract has less accessibility to the affected parts of joints. The ginger extract being hydrophobic in nature, can be used through topical route in the form of nanoemulgel. Various formulations have been prepared using various ratio of Smix as 1:1, 2:1 and 3:1 (tween-80: ethanol). The all
formulations were found thermodynamically stable. The formulation F4 (3:1) has the minimum zeta size and the nanoemulgel F4* has shown good release behaviour than other formulations. It could be because of Smix ratio (Tween
80: ethanol) 3:1 in both F3 and F4. The stability of F1, F2, F3 and F4 nanoemulsions was good perhaps because of higher concentration of surfactants and co-surfactants leading to steric stability due to polyoxyethylene chain in tween 80 by adsorbing onto them and higher zeta potential as well, which together prevents coalescence of oil droplet. Thus even at higher range of PDI they all exhibit good stability. From the
study it is concluded that the nanoemulgel can be a best dosages form for improving transdermal absorption of ginger extract.
REFERENCES
1. Guo Q, Wang Y, Xu D, Nossent J, Pavlos NJ, Xu J,Rheumatoid arthritis: pathological mechanisms and modern pharmacologic therapies, Bone Res. 2018; 6: 15.
2. Crofford leslie J, Use Of NSAIDs In Treating Patients With Artiritis, Arthiritis Res Ther. 2013; 15(3) 1-10.
3. Tripathi K.D (2006) Essentials of Medical Pharmacology, 6th edition, Jaypee Brothers Publishers (P), P. 202-205
4. Ahmed S, Anuntiyo J, Haqqi, TM, A Review: Biological basis for the use of botanicals in osteoarthritis and rheumatoid arthritis', 2005; 2(3): 301-308.
5. Chawla AS, Handa SS, Sharma AK, Kaitb BS, Plant anti-inflammatory agents, Journal of Scientific and Industrial Research, 1987; 46: 214-223
6. Ghosh, AK, Zingiber officinale: A natural Gold', International Journal of Pharma and Bio Sciences, 2011; 2(1) 283-294. 7. Penna SC, Medeiros MV, Aimbire FSC, Faria-Neto HCC,
Sertié JAA, Lopes-Martins RAB, Anti-inflammatory effect of the hydroalcoholic extract of Zingiber officinale rhizomes on rat paw and skin oedema. Phytomedicine. 2003; 10 381-5.
0
10
20
30
40
50
60
70
80
90
100
0
50
100
150
200
250
300
350
P
erc
en
t
cu
m
u
la
ti
ve
a
d
ru
g
rel
ea
se
Time in Min
F1*
F2*
F3*
8. Park KK, Chun KS, Lee JM, Lee SS, Surh YJ. Inhibitory effects of [6]-gingerol, a major pungent principle of ginger, on phorbol ester-induced inflammation, epidermal ornithine decarboxylase and skin tumor promotion in ICR mice. Cancer Lett. 1998; 129 139-44.
9. Jolad, SD, Lantz RC, Solyom AM, Chen GJ, Bates RB,Timmermann BN, Fresh Ginger (Zingiber Officinale): Composition and Effects on Lps-Induced PGE2 Production, 2004; 65 (13): 1937-1954.
10. Tchombe LN, Louajri A, Benajiba MH, Therapeutic effects of Zinger (Zingiber officinale) ISESCO Journal of Science and Technology, 2012: 64-69.
11. Solans C, Izquierdo P, Nolla J, Azemar N, Garcia-Celma MJ, Nanoemulsions, CurrOpin Coll Int Sci, 2005; 10: 102-110. 12. Paliwal S, Kaur G, Arya RK K, Formulation and
characterization of topical nanoemulgel of terbinafine. Universal Journal of Pharmaceutical Research. 2018; 3(6): 28-37.
13. Lawrence MJ, Rees GD, Microemulsion-based media as novel drug delivery systems, advance drug delivery review, 2000; 45(1):89-121.
14. Mason, TG, Wilking JN, Meleson K, Chang CB, Graves SM, Nanoemulsions: formation, structure, and physical properties, J Phys Cond Matt, 2006,18: 635-666.
15. Ravi TP, Padma T, Nanoemulsions for drug delivery through different routes,research in biotechnology, 2011; 2( 3):1-6. 16. Ali M, Ali J, Vikas B, Study of surfactant combinations and
development of a novel nanoemulsion for minimising variations inbioavailability of ezetimibe', colloids surf B biointerface, 2010; 76:412.
17. Maurya S, Singh D, Quantitative Analysis of Total Phenolic Content in Adhatoda vasica Nees', International Journal of PharmTech Research, 2010, 2(4): 2403-2406.
18. Blois MS, Antioxidant determinations by the use of a stable free radical', Nature, 1958; 181:1199–1200.
19. Mizushima Y, Kobayashi M, Interaction of anti-inflammatory drugs with serum proteins, especially with some biologically active proteins, Journal of Pharma Pharmacology, 1968 20:169-173.
20. Maurya S D, Arya RKK, Pal GR, Dhakar RC, Self microemulsifying drug delivery systems (SMEDDS): A review on physio-chemical and biopharmaceutical aspects. Journal of Drug Delivery And Therapeutics 2017, 7 (3): 55-65
21. Arya RKK, Juyal V, Kunwar N, Preparation of carbamazepine chitosan nanoparticles for Improving nasal absorption, Journal of Drug Delivery And Therapeutics, 2015; 5(3):101-108.
22. Arya RKK, Juyal V, Polymer lipid hybrid nanoparticles for brain targeting through intranasal delivery, Journal Of Drug Delivery And Therapeutics, 2017; 7(4):129-36.
23. Khullar, R., Saini, S., Seth, N. and Rana, A. (2011) 'Emulgel: A surrogate Approach for topically used Hydrophobic Drugs, Int. J.of pharm. and Bio Sci, 1(3): 117-128.
24. Gondaliya, D. and Pundarikakshuda, K. () 'Studies in formulation and Pharmaceutical Evaluation of Controlled release Delivery system of Bupropion', AAPS Pharm. Sci. tech, 2003; 4(1): 1-9.
25. Dash, S., Murthy, P.N., Nath, L. and Chowdhury, P. (n.d) 'Kinetic modeling on drug release from controlled drug delivery systems', Acta Poloniae Pharmaceutica -Drug Research, 67(3): 217-223, Available: ISSN 0001-6837.