Published online November 30, 2013 (http://www.sciencepublishinggroup.com/j/ajbls) doi: 10.11648/j.ajbls.20130103.15
Estimating false rates-based relative risk as measure of
association in diagnostic screening test
Oyeka Ikewelugo Cyprian Anaene
1, Okeh Uchechukwu Marius
2, Igwebuike Victor Onyiaorah
3,
Adaora Amaoge Onyiaorah
4, Chilota Chibuife Efobi
51
Department of Applied Statistics, Nnamdi Azikiwe University, Awka Nigeria 2
Department of Industrial Mathematics and Applied Statistics, Ebonyi State University Abakaliki, Nigeria 3
Department of Histopathology,Nnamdi Azikiwe University Teaching Hospital Nnewi Anambra State, Nigeria 4
Department of Opthalmology, Enugu State University Teaching Hospital Park lane Enugu State,Nigeria 5
Department of Haematology, University of Port Harcourt Teaching Hospital, Port Harcourt, Rivers State Nigeria
Email address:
uzomaokey@ymail.com (O. U. Marius)
To cite this article:
Oyeka Ikewelugo Cyprian Anaene, Okeh Uchechukwu Marius, Igwebuike Victor Onyiaorah, Adaora Amaoge Onyiaorah, Chilota Chibuife Efobi. Estimating False Rates-Based Relative Risk as Measure of Association in Diagnostic Screening Test. American Journal of Biomedical and Life Sciences. Vol. 1, No. 3, 2013, pp. 64-69. doi: 10.11648/j.ajbls.20130103.15
Abstract:
This paper proposes false-rates-based relative risk-type measure of the strength of association between state of nature or condition in a population and test results in diagnostic screening tests. The adopted method provides an estimate for the proposed relative risk that depends only on the estimated sensitivity and specificity of the test in the event that the prevalence rate is not known. The proposed method unlike the traditional odds ratio provides estimates of not only the proposed false rates based relative risk-type measure of association, but also alternative sample estimates of its associated standard deviation and test statistic for significance that intrinsically and structurally partials out, that is, does not include in its formulation the number of subjects in the sample known or believed to actually have the condition in nature but test negative or actually do not have the condition in nature but test positive to the condition in the screening test. The proposed method given that the prevalence rate of the condition in the population is known, provides sample estimates of the false positive rate, false negative rate and their odds as well as the proportion of the population expected to test positive to the condition in the screening test which are additional useful information to guide policy formulation and implementation over and above the traditional odds ratio method. Modified estimates of the standard deviation and test statistic for the proposed measure that adjust for the fact that some sample observations in a screening test are not known and cannot therefore validly be used in traditional relative risk estimation method are provided. The proposed method which is shown to provide more information and to be at least as efficient as the traditional relative risk method is illustrated with some sample data.Keywords:
Chi-Square Test of Independence, False Negative Rate, False Positive Rate, Relative Risk, Specificity, Sensitivity1. Introduction
A research scientist or clinician who has collected sample data from a cross-sectional or longitudinal either prospective or retrospective study design may validly but preferably use the odds ratio or relative risk rather than the phi-coefficient which unlike the former two measures is not invariant under the three study methods, to assess the degree of association between a predisposing or antecedent factor and condition of interest in a population (Fleiss,1973;Kestenbaum,2009). However, the use of the traditional odds ratio and relative risk in their direct usual formulations as measures of level of
incorporate these rates or adjusted for their effects. Ideally such tests should correctly and absolutely identify all subjects with the condition and similarly correctly identify all subjects which are free of the condition. However, most clinical tests fall short of these ideals (Lalkhen and McCluskey, 2008). When evaluating a clinical test, the terms sensitivity and specificity are used (Lalkhen and McCluskey, 2008). Sensitivity (clinical sensitivity) is positivity test for a condition, while true positive rate is the ability of a test to correctly identify a condition at a particular decision threshold. Specificity (clinical specificity) is negativity test in health and true-negative rate is the ability of a test to correctly identify the absence of a condition at a particular decision threshold (Akobeng, 2007). Sensitivity and specificity are proportions, so confidence intervals can be calculated for them using standard methods for proportions (Gardner and Altman, 1989). A test can have considerable ability to discriminate, yet not be of practical value for patient care. This could happen for several reasons. For instance, the cost or undesirability of false results can be so huge that there are no decision thresholds for the test where the trade-off between sensitivity and specificity is acceptable (Zweig et al, 1995). Sensitivity and specificity are independent of the population of interest being tested. However, the terms positive predictive value (PPV) and negative predictive value (NPV) are used when considering the value of a test to a clinician and are dependent on the prevalence of the disease in the population of interest(Lalkhen and McCluskey, 2008). Public health workers may often need clearer and more definitive measures of association between screening test results and state of nature or health condition, disease or biological entity being measured that use all available information from the screening test. In this paper we propose to develop an odds ratio-type measure of association based on false rates. Now in diagnostic screening tests the data or observations immediately available to the medical researcher for use are the total number of subjects screened which consist of the number of subjects known or believed to actually have and not to actually have the condition in the population and the number who actually have the condition and test positive as well as the number of subjects who do not actually have the condition and test negative in the screening test. The number of subjects who do not have the condition but test positive and the number of subjects who have the condition but test negative in the screening test are usually not known, so that the total number of subjects who either test positive or negative in the screening test are usually not completely known. Hence the traditional odds ratio and other similarly calculated measures of association cannot be validly and properly used without modifications as measures of the strength of association between state of nature or condition and test results in diagnostic screening tests. For the same reasons the usual estimates of the precision and chi-square test statistics for these measures (Fleiss,1973; Akobeng, 2007) cannot be validly used directly. Although the proposed measure of association is dependent on the prevalence rate of
the condition of interest if known, an alternative measure of association that is independent of the prevalence rate but depends only on the sensitivity and specificity of the test is also developed. Estimates of the precision of the proposed measure and an appropriate test statistic that depend only on the sensitivity and specificity of the test are also developed. Given that the prevalence rate of the condition in the population is known or a reliable estimate can be obtained from previous studies, an estimate of the proportion of the population expected to test positive in the screening test is also here provided.
2. Decision Matrix Table
If a research scientist or clinician collects from a certain population a random sample of n.1 subjects known or
believed to actually have a certain condition in a population and similarly collects a random sample of n.2 subjects from
the same population known or believed not to actually have the condition in the population giving a total sample size of n =n..= n.1 + n.2 subjects to be screened. Research interest is in
conducting a diagnostic screening test to determine whether or not each of the randomly selected subjects actually responds positive or negative to the test for the condition, disease, biological entity, make-up etc.
Let B be the event that a randomly selected subject from this population has the condition of interest andB be the event that the subject does not have the condition in nature. Let A be the event that the randomly selected subject tests positive to the screening test and
A
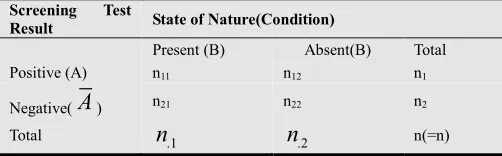
be the event that the subject tests negative to the test. The results from such a screening test may then be presented in a 2 x 2 table as in Table 1.Table 1. Format for Presentation of Results of a Diagnostic Screening Test
Screening Test
Result State of Nature(Condition)
Present (B) Absent(B) Total Positive (A) n11 n12 n1
Negative(
A
) n21 n22 n2 Totaln
.1n
.2 n(=n)In Table 1, out of n1. subjects testing positive to the test,
n11 actually have the condition while n12 do not have the
condition and out of n2. subjects testing negative, n21 actually
have the condition, while n22 actually do not have the
condition. Of the n = n.. subjects studied n.1 subjects actually
have the condition while n.2 subjects do not have the
condition in nature. The sensitivity, Se of a test is defined as the proportion of those actually having the condition that test positive. The specificity, Sp of a test is the proportion out of those not actually having the condition, which test negative (Akobeng, 2007). The false positive rate, F+ve of a test is the
proportion out of those testing positive who are actually free from the disease and the false negative rate, F-ve, is the
notationally as:
( / ) ; ( / )
S e = P A B S p = P A B (1)
The larger the P A( /B), the more sensitive is the test and the larger the P(A / B) , the more specific is the
test(Altman and Bland 1994). Sample estimates of these rates using the notations of Table 1 are respectively given as
11 22
.1 .2
ˆ
n
;
ˆ
n
Se
Sp
n
n
=
=
(2)Of greater public health importance however is the false positive, F+ve and false negative, F-ve rates of a test. F+ve is
defined as the probability that a randomly selected subject who tests positive to the test does not actually have the condition, while F-ve is the probability that a randomly selected subject who tests negative to the test in fact has the condition in nature. Notationally we have that:
(
/
);
(
/
)
ve ve
F
+=
P B
A F
−=
P B A
(3)Using the conditional and multiplication rules of probability (Altman and Bland 1994), we have that:
(
1 ( / ) 1)
(
( ))
( / ) ( )
( ) ( )
ve
P A B P B P A B P B
F
P A P A
+
− −
= = (4)
Where
P B
( ) 1
= −
P B and P A B
( )
( / ) 1
= −
P A B
( /
)
And
Where ( ) 1P B = −P B and P A B( ) ( / )= −1 P A B( / )
And
(
1 ( / ))
( ) ( / ) ( )( ) 1 ( )
ve
P A B P B P A B P B
F
P A P A
−
−
= =
− (5)
Where
( ) 1
( )
( / ) 1
( / )
P A
= −
P A and P A B
= −
P A B
Now unless the available data are a result of a representative random sample obtained in a well-designed controlled clinical trial, it is often not possible to obtain P (A) and P (B) directly from these data. P (B) is usually obtained from a reliable census or health survey while P(A) which is a function of P(B) is obtained as follows using Baye’s rule (Miller 1986; Uche 2004).
Thus,
(
)
( ) ( / ). ( ) ( / ) ( )
( / ). ( ) ( / ) 1 ( )
P A P A B P B P A B P B P A B P B P A B P B
= +
= + − (6)
Or in terms of sensitivity and specificity
(
)
( )(
)
( ) ( / ). ( ) 1 ( / ) 1 ( )
1 ( / ) 1 ( / ) ( / ) ( / ) . ( )
P A P A B P B P A B P B
P A B P A B P A B P A B P B
= + − −
= − − − − − (7)
Now putting equation (6) in equation (4) we have that
(
)
(
)
(
)
1 ( / ) 1 ( ) ( / )
( / ) ( ) ( / ) 1 ( )
ve
P A B P B
F P B A
P A B P B P A B P B
+
− −
= = + − (8)
Or when expressed in terms of the often more familiar sensitivity and specificity becomes
(
)
(
)
(
)
(
)
(
)
(
)
(
)
1 ( / ) 1 ( )
( / ) ( ) ( / ) 1 ( )
1 ( / ) 1 ( )
1 ( / ) 1 ( / ) ( / ) 1 ( )
ve
P A B P B
F
P A B P B P A B P B
P A B P B
P A B P A B P A B P B
+ − − = + − − − = − − − − − (9)
Similarly using Equation 6 in Equation 5, we have that
(
)
(
)
1 ( / ) ( ) ( / )
1 ( / ) ( ) ( / ) 1 ( )
ve
P A B P B
F P B A
P A B P B P A B P B
−
−
= =
− + − (10)
Similarly which when expressed in terms of sensitivity and specificity becomes
( )
(
)
( )( )
(
)
1 ( / ) ( )
1 ( / ) ( ) 1 ( / ) 1 ( )
1 ( / ) ( )
( / ) 1 ( / ) ( / ) ( )
v e
P A B P B
F
P A B P B P A B P B
P A B P B
P A B P A B P A B P B
− − = − + − − − = + − − (11)
3. Proposed Method
False rate-based relative risk-type measure of association can similarly be developed, where relative risk R is defined as the ratio of the proportion of subjects known or believed to have a condition in nature among the subjects testing positive to the proportion of subjects known or believed to have the condition in nature among the subjects testing negative in the screening test. Notationally,
( / ) ( / )
P B A
R
P B A
= (12)
Or when expressed in terms of sensitivity, Se false rates,
v e
F− and the proportion P(A) of the population expected to
test positive in the screening test we have
( )
( )
( ) ( / ) ( ) ( / ) ( ) ( / ) ( ). ( / ) ( ). ( ). 1 ( /
( ) ( ). 1
v e
P A P A B P A P A B P A P A B
R
P A P A B P A F P A P A B
O r
P A S e R
P A S e
− = = = − = − (13)
Hence a sample estimate of R is obtained using Equation 12 in Equation 13 as
(
)
(
)
ˆ ˆ (1 ˆ ˆ ). ( ) ˆ
ˆ ˆ ˆ ˆ
(1 ) (1 (1 ) ( ))
Se Sp Se Sp P B
R r
Se Sp Se Sp P B
+ − −
= =
− − − − − (14)
( )(
)
( )
(
(
(
)
)
)
ˆ 1 ˆ ˆ .( ( )) ˆ ˆ.
ˆ ˆ ˆ ˆ ˆ ˆ ˆ ˆ
1 (1 ) (1 ). ( )) 1 (1 ) 1 ( ))
Se Se Sp P B Se Sp
r
Se Sp Se Sp P B Se Sp Se Sp P B
− −
= +
− − − − − − − − − − (15)
Where P(B) is the prevalence rate of the condition in the population which is either known or estimated from a previous study. Note that in Equation 15,
(
1−Seˆ −Sp P Bˆ)
( )=0ifthe prevalence rate P(B)=0,and
(
1−Seˆ −Sp P Bˆ)
( ) 1< −Seˆ −Sp for all P Bˆ ( )>0 . Hence the relativerisk R and its estimate is less than, equal to, or greater than
( )(
1 ˆˆ ˆ.1 ˆ)
Se SpO
Se Sp =
− −
⌢
the sample odds ratio, if for all values of the
prevalence rate P(B), 1−Seˆ −Spˆ is less than, equal to or greater
than
O
⌢
,respectively. In other words, if the sum of the sensitivity and the specificity of the test is greater than, equal to or less than unity.In certain cases however especially when the condition such as disease is not very virulent in the population, so that the prevalence rate P(B) is relatively small, then
ˆ ˆ
(1−Se−Sp P B). ( ),which is a product of two proportions or rates is small and may be neglected. In these cases the false rates-based odds ratio-type measure of association (Onyiorah et al, 2013) would provide a good approximation of relative risk given as
(
1 ˆˆ)(
.ˆ1 ˆ)
S e Sp r
Se Sp
=
− − (16)
Otherwise, that is, in all other cases, equations 14 and 15 would be the appropriate estimate of false rate based relative risk type measure of association in diagnostic screening tests.
4. Illustrative Example
A research scientist or clinician screened a random sample of n.1=28 subjects from a certain community known or
believed to have breast cancer and n.2=49 subjects from the
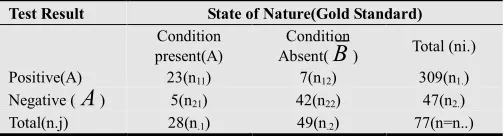
same community known or believed not to have breast cancer obtaining the results shown in Table 2.Interest is in determining whether the test results truly reflect actual prevalence of breast cancer in the community.
Table 2. Results of screening test for breast cancer in a certain community
Test Result State of Nature(Gold Standard)
Condition present(A)
Condition
Absent(
B
) Total (ni.) Positive(A) 23(n11) 7(n12) 309(n1.) Negative (A
) 5(n21) 42(n22) 47(n2.) Total(n.j) 28(n.1) 49(n.2) 77(n=n..)The sample data of Table 2 are analyzed using the method presented above.
The prevalence rate of breast cancer in the study population (Nigeria) is reported to be P(B)=127 per 100,000 population or about 1 per 1000 population and is used in the following calculations.
The sample estimates of the sensitivity and specificity of the test are from Table 2 respectively
11 .1
23 42
ˆ 0.821 ˆ 0.857
28 49
n
Se and Sp
n
= = = = =
values that indicate that the test is sufficiently sensitive and specific.
If
( )
(
)
11 22
.1 .2
ˆ ˆ ˆ ˆ
( ) ( ) n . ( ) 1 n 1 ( ) 1 1 . ( )
P A P A P B P B Sp Se Sp p B
n n
= = + − − = − − − −
Then with P(B)=0.001,we estimate the proportion of the sampled population expected to test positive to breast cancer as
(
)( )
( ) 1 0.857 1 0.821 0.857 0.001 0.143 (0.678)(0.001) 0.143678 0.144,
P A= − − − − = + = or
that is 144 per 1000 population. Also false positive rate is given as
(
1 0.857 1 0.001)(
) (
0.143 0.999)(
)
0.142857ˆ 0.992
0.144 0.144 0.144
ve
F+ = − − = = =
Similarly, false negative rate is given as
(1 0 .8 2 1)(0 .0 0 1) (0 .1 7 9)(0 .0 0 1) 0 .0 0 0 1 7 9
0 .0 0 0 2 1 0 .1 4 4 0 .8 5 6 0 .8 5 6
v e
F−
−
= = = =
−
Thus if the prevalence rate of breast cancer of 1 in 1000 population in the sampled population (Nigeria) is admissible, then we would expect that for every 1000 subjects screened and found to test positive to breast cancer 0.992 would actually be free of the disease and for every 10,000 subjects screened and found not to have breast cancer only about 2 would be expected to actually have the disease. These results seem to be inconsistent with the observed rather high values of sensitivity and specificity of the test suggesting that the reported prevalence rate of breast cancer of only 1 per 1000 population is probably on the low side. The odds of positive and negative responses are similarly estimated. The false-rate-based odds ratio-type measure of association between screening test results and condition, that is presence of breast cancer in the population is estimated (Onyiorah et al, 2013) from
(
)(
)
( )(
)
ˆ ˆ
1 1 ˆ ˆ
ˆ .
ˆ
ˆ ˆ .ˆ 1 ˆ 1 ˆ
ve ve
A
ve ve A
F F Se Sp
o
F F Se Sp
ω + −
+ −
− −
Ω
= = = =
Ω − −
As
( )( )
( 0.821)(0.857 ) 0.704
ˆ 27.08
1 0.821 1 0.857 0.026
o
ω= = = =
− −
It can be seen from the high value of ωˆ = 2 7 . 0 8 that
If we had instead used false rates based relative risk-type measure of association to analyse the same data, we would have that
(
)(
) (
)(
)
(
)(
)
0.821 1 0.144 0.821 0.856 0.703
ˆ 27.04
(1 0.821)(0.144) 0.179 0.144 0.026
R= =r − = = =
−
Which also indicates strong association between screening test results and condition and is only slightly less than the corresponding estimated odds ratio of ωˆ = 2 7 . 0 8 due to the
finding that here the sum pf the sample estimates of sensitivity and specificity is 1.678 which is greater than unity as noted above.
5. Discussion
The results obtained using the proposed method show that the estimated relative risk-type measure of association is consistent with the rather high sample estimates of sensitivity and specificity of the test which are independent of the prevalence rate of a condition of interest in the population, but are however probably inconsistent with the low value of the prevalence rate of breast cancer of about 1 in 1000 reported for Nigeria. As expected, because of the independence of sensitivity and specificity and the prevalence rate of a condition in a population, the sample estimate of the relative risk-type measure of association based on false rates and the one obtained using only sample estimates of sensitivity and specificity are essentially the same. For the same reason, as may be noticed from Table 2, the estimates of the proposed false rates based odds ratio-type measure are essentially invariant with prevalence rates. The proportion of subjects in the population expected to test positive to the condition (breast cancer) is seen to increase as prevalence rate decreases. This is because this rate is structurally always an inverse function of prevalence rates. Similarly as can be seen from Table 2, the estimated measures of association based on the usual odds ratio when the prevalence rate is not known as well as when it is known are virtually equal because of the dependence of these rates on only sensitivity and specificity. However, as already pointed out above, the traditional relative risk method cannot, strictly speaking, be used in estimating any measure of association between screening test results and state of nature in a population because some of the required sample data normally used in the estimation of this measure are not usually available to the researcher. The proposed method, unlike the traditional method enables the researcher as shown in Table 2 obtain sample estimates of false rates, their odds of positive response and negative response as well as the proportion of subjects in the population expected to test positive to the condition ( breast cancer) if the prevalence rate of the condition in the population is known. These are useful and additional information that cannot possibly be obtained using the traditional odds ratio method.
6. Conclusion
We have in this paper proposed and developed relative risk-type measure of association in screening tests based on false positive rate, false negative rate, sensitivity and specificity of a test procedure. Unlike the traditional odds ratio, the proposed method takes into account in its formulation any existing prevalence rate of a condition of interest and incorporates an indirect estimate of the proportion of subjects in the population expected to test positive. Also unlike the traditional or conventional odds ratio method, the proposed method provides estimates of false rates for a condition and uses them to provide an estimate of the proposed odds ratio-type measure of association if the prevalence rate of the condition in the population expected to test positive. Also unlike the traditional or conventional odds ratio method, the proposed method provides estimates of false rates for a condition and uses them to provide an estimate of the proposed odds ratio-type measure of association if the prevalence rate of the condition in the population is known. Even when the prevalence rate is not known, the proposed method is still able to provide estimate of the odds ratio-measure of association in terms of estimated sensitivity and specificity of the screening test. The proposed method unlike the traditional odds ratio approach provides sample estimates of the proposed odds ratio type measure, its standard deviation and test statistic for its significance that explicitly and structurally exclude in their formulation the usually unknown numbers of subjects in the sample obtained in a diagnostic screening test that are known or believed to actually have a condition but test negative or known or believed not to have a condition but test positive in the screening test. The fact that estimates of true and false rates, their odds and the proportion of the population expected to test positive to the condition in the screening test can be made when the prevalence rate of the condition in the population is known as well as estimates of the sensitivity and specificity of the test is an added advantage of the proposed method that provide additional useful information over and above the ones that are possible with the traditional odds ratio method. The proposed method is illustrated with sample data and is shown to compare favorably with existing methods.
References
[1] Akobeng AK (2007).Understanding diagnostic tests 2: likelihood ratios, pre- and post-test probabilities and their use in clinical practice. Acta Paediatr 96(4):487-91.
[2] Agresti, A (2007). Introduction to Categorical Data Analysis. John Wiley and Sons. Inc., Publications. New York.
[3] Altman DG (1996). Statistics with Confidence. BMJ Publishing Group. 28-33.
[5] Fleiss JL (1973). Statistical Method for Rates and Proportions. John Wiley, New York.
[6] Gardner MJ, Altman DG (1989). Calculating confidence intervals for proportions and their differences. In: Gardner MJ, [7] Kestenbaum B (2009). Epidemiology and Biostatistics: an
introduction to clinical research. Springer Science LLC. [8] Lalkhen AG, McCluskey A (2008). Clinical tests: sensitivity
and specificity.Continuing Education in Anaesthesia.Critical [9] Care & Pain J. 8(6): 221-223
[10] Miller J. Statistics for Advanced Level (1996). (2nd Edition) Cambridge University Press
[11] Uche PI (2004). Probability: Theory and Practice. Longman Nig PLC