Published online October 14, 2014 (http://www.sciencepublishinggroup.com/j/ajls) doi: 10.11648/j.ajls.s.2015030102.12
ISSN: 2328-5702 (Print); ISSN: 2328-5737 (Online)
The complex of tests for the quantitative evaluation of the
effects of radiation on laboratory animals
Irina Alchinova
1, Elena Arkhipova
1, Yulia Medvedeva
1, Anton Cherepov
2, 3, Alexander Antipov
4,
Nikolai Lysenko
5, Leonid Noskin
6, Mikhail Karganov
11
Lab of Physicochemical and Ecological Pathophysiology, Institute of General Pathology and Pathophysiology, Moscow, Russia
2
Dept. of Experimental Biology and Cell Physiology, Research Institute for Space Medicine, Federal Biomedical Agency of Russia, Moscow, Russia
3
Lab of Neurobiology of Memory, P. K. Anokhin Institute of Normal Physiology, Moscow, Russia
4
Veterinary Dept., K. I. Skryabin Moscow state Academy of veterinary medicine and biotechnology, Moscow, Russia
5
Biology Dept., K. I. Skryabin Moscow state Academy of veterinary medicine and biotechnology, Moscow, Russia
6
Rectorate, Moscow state pedagogical University, Moscow, Russia
Email address:
[email protected] (I. Alchinova)
To cite this article:
Irina Alchinova, Elena Arkhipova, Yulia Medvedeva, Anton Cherepov, Alexander Antipov, Nikolai Lysenko, Leonid Noskin, Mikhail Karganov. The Complex of Tests for the Quantitative Evaluation of the Effects of Radiation on Laboratory Animals. American Journal of Life Sciences. Special Issue: Space Flight Factors: From Cell to Body. Vol. 3, No. 1-2, 2015, pp. 5-12. doi: 10.11648/j.ajls.s.2015030102.12
Abstract:
Exposure to ionizing radiation leads to exhaustion of the pool of stem cells, increases differentiated cell stress, and activated reparation and apoptosis processes. Apart from well-documented acute effects, radiotherapy leads to delayed effects manifesting in few years after successful treatment. The aim of our study was the development of a test battery for evaluation of irradiation aftereffects in organisms characterized by different radiosensitivity. We chose C57BL mice as the ideal strain, because according to published data, they are characterized by medium radiosensitivity. At the preliminary stage, we have to assess informative value of some methods for the sublethal irradiation dose of 750 R. For evaluation of the damaging effects of radiation (lymphocyte count and maturity), we used, along with classical criteria, some complex parameters (body weight, serum homeostasis, behavior) characterizing general status of the organism. We also performed histological analysis of the liver, spleen, and pancreas and ranged the injuries by their severity.Keywords:
Histological Examination, Complex of Tests, Laser Correlation Spectroscopy, RadiationThe main trend in international astronautics is the transition from near-Earth orbital flights to long-distance spaceflights to the Moon and Mars. The conditions of manned space flights to these extraterrestrial bodies and during astronaut work on their surface will drastically differ from those during near-Earth orbital flights. Flight factors will combine in unknown ways and may show unexpected intensity. Long-distance spaceflight planning is impossible without protection from irradiation and minimization of microgravity-related risks. Many different technologies and methods are used for the evaluation of the influence of spaceflight factors on the body. For instance, the effects of microgravity are studied in vitro on a clinostat (for cells) and in vivo using the tail suspension test (for mice). The effects of radiation can be easily modeled under in ground conditions. Irradiation doses and regiments can be varied, the whole body or individual cells can be exposed to radiation.
The aim of our study was the development of a test battery for evaluation of irradiation aftereffects in the organisms demonstrating different radiosensitivity.
Effects of ionizing radiation on certain parameters of the body are studied at length. The dose-effect curve in the range of high doses allows reliable prognosis, but hardly can predict serious disability or death of individual organism.
physiological parameter differ by the rate and magnitude. Thus, radiosensitivity of a strain can be discussed relative either to mean parameter for a particular strain or to "ideal" strain. We chose C57BL mice as the ideal strain, because according to published data, they are characterized by medium radiosensitivity. At the preliminary stage, we have to assess informative value of some methods for the sublethal irradiation dose of 750 R. Then, based on the basal dynamics of reactions, comparison of physiological parameters in mice of different strains should be performed. For evaluation of the damaging effects of radiation (lymphocyte count and maturity), we used, along with classical criteria, some complex parameters (body weight, serum homeostasis, behavior) characterizing general status of the organism. We also performed histological analysis of the liver, spleen, and pancreas and ranged the injuries by their severity.
Experiments were carried out on 20 male C57Bl mice. The mice were exposed to γ-radiation in a sublethal dose of 750 R at 5.4 R/min radiation intensity. Control group (20 male C57Bl mice) did not receive irradiation. All procedures and animal experiments were carried out in accordance with the “Rules of Laboratory Practice in the Russian Federation”, approved by the Ministry of Health of the Russian Federation (Order No. 267 of June 19, 2003).
1. Body Weight
High radiation doses cause bowel and liver damages during the first weeks after irradiation, which impairs digestion and leads to changes in body weight. Body weight loss was most common, but in some cases, an increase in body weight was detected associated with the development of metabolic syndrome.
The animals were weighed on a Mettler Toledo scales after 1-h food deprivation.
Figure 1. Mean weight in groups. Interval between weightings - 3 days. The first point - weight before irradiation.
During the experiment, body weight decreased in all mice, which can indirectly indicate the development of radiation sickness. Significant differences from the control animals were noted only in 3 weeks after irradiation.
2. Changes in the Blood Count
Figure 2. Comparison of blood cell content after the irradiation, в %. *- compared with the corresponding time control, p < 0.05 Mann-Whitney U Test.
Changes in the quantitative parameters of blood cells were evaluated from differential leukocyte count (immersion microscopy of Pappenheim stained smears). Microscopy of the smears was performed by the Shilling technique.
According to published data, normal mouse blood count is the follows: lymphocytes 63.0-75.0, monocytes 0.7-2.6, neutrophils 6.7-37.2, and eosinophils 0.9-3.8.
As expected, the experimental animals in one week after irradiation developed lymphopenia that persisted for 6 weeks; moreover, we observed elevated relative count of segmented neutrophils typical of purulent processes.
Subpopulation composition of blood lymphocytes (ratio of T and B cells) in mice of different strains was studied by flow cytometry using triple-labeled monoclonal antibodies.
Flow laser cytometry is based on interaction of fluorescently labeled monoclonal antibodies with surface lymphocyte antigens followed by sample analysis on a cytometer. CD45 is a common leukocyte antigen present on the membrane of all leukocytes. The level of CD45 expression increases during differentiation of hemopoietic cells from immature precursors to differentiated forms. CD45 molecule is weakly expressed in all hemopoietic stem cells, maximum expression is observed in mature lymphocytes, and myeloid cells demonstrate intermediate levels of CD45 expression. CD3 is the most specific T-cell marker; it is a part of a large complex including T-cell receptor (TCR); this marker is present in mature T cells and thymocytes. CD19 is a common marker of B cells. This type II integral membrane glycoprotein, a member of immunoglobulin superfamily, is present in all B cells, including precursors, but is lost in plasma cells.
Figure 3. Lymphocyte subpopulations after the irradiation, vertical axis - percent.
3. Subfraction Composition of Blood
Serum - Laser Correlation
Spectroscopy
Blood serum was used for studying of shifts in serum homeostasis. The blood was taken from the small saphenous vein 3 days and 3 and 6 weeks after irradiation [1].
The method of laser correlation spectroscopy (LCS) is based on the analysis of the spectrum of quasielastic light scatter during coherent monochromatic laser irradiation of microparticles in biological fluids.
Evaluation of subfraction composition of samples provides information on percentage of biosubstrate constituents and
yields integral characteristics reflecting the function of systems and their readiness to adequate protection of the body. This initially biophysical method, named laser correlation spectroscopy (LCS) is used for screening of large groups of conventionally healthy individuals for diagnosis of body functional strain and detection of risk groups [2, 3]. Optimized software takes into account individual peculiarities in internal sanogenetic systems of the organism when determining consequences for health in persons exposed to low doses of potentially harmful factors [4]. LCS allows measuring particle size in native biological fluids. It is successfully used in clinical practice for evaluation of the disease severity and treatment efficiency in patients with asthma, diabetes mellitus, myasthenia, some haematological diseases, and other pathologies [5, 6, 7-10].
Laser correlation spectroscopy (LCS) (analogs: spectroscopy of quasi-elastic light scatter, optical mixing spectroscopy, photon-correlation spectroscopy, dynamic light scattering) consists in measurement of spectral characteristics of light scattered in quasi-elastic mode from the spectrum of intensity fluctuations of the recorded light [11-15].
The distribution histograms in the serum provide qualitative information on the mean particle sizes and their relative content.
Changes in the serum homeostasis in animals exposed to radiation were characterized by insignificant redistribution of particle spectra towards 37 – 67 nm particles after 3 weeks of the experiment and increased contribution of 37–50- and 122–165-nm particles in 6 weeks.
Figure 4. Comparison LC - histograms of blood serum of C57BL mice. The abscissa - the particle size in nanometers, vertical axis - percent contribution to light scattering.
4. Histological Examination of the Spleen,
Liver, Pancreas and Severity Rating
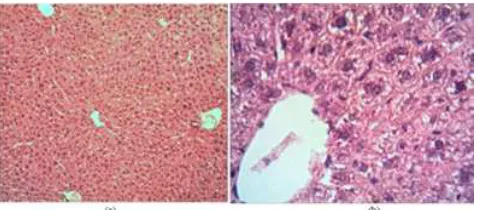
After the end of the experiment, the animals were sacrificed by anesthetic overdose and the organs (liver and intestine) taken for histological examination for evaluation of the damaging effects of irradiation. The organs were fixed in 4% neutral formalin. The slides were prepared routinely. For simplification of data processing, we specified injury severity degrees depending on the severity of morphological changes. Histological slides were stained with hematoxylin -
eosin. magnification lenses 10, 40.
4.1. Pancreas
connective tissue layer containing blood vessels moderately filled with blood. The endocrine parenchyma is presented by round cell clusters (Langerhans islets) (Fig.6) of different size (large, medium, small) consisting of primarily large weakly stained cells.
Figure 5. Acini of the pancreas (1st degree of severity).
Figure 6. Medium-sized (left) and large (right) Langerhans islets (1st degree of severity).
2nd degree. Parenchyma of the exocrine portion of the pancreas is presented by pancreatic acini of round, oval, or irregular shape and different size (primarily small) consisting of a single layer of medium-sized and small conical epithelial cells (acinocytes) (Fig.7, 8). Lipomatosis, i.e. replacement of some acini with the adipose tissue, is sometimes seen. Round nodules consisting of lymphocyte-like cells are found in the interlobular interstitial tissue (Fig.9). The nodules have well developed capsule. Round acinocyte nucleus is located close to the basal part of the cell. The apical part contains oxyphilic granular cytoplasm. The basal part of the cytoplasm is homogeneous and evenly basophilic. The acini are grouped in lobules separated with a thin connective tissue layer containing blood vessels moderately filled with blood.
The endocrine parenchyma is presented by small round atrophic cell clusters (Langerhans islets) consisting of primarily large weakly stained cells.
The main differences from the previous group is smaller size of the acini, epithelium, and Langerhans islets (Tab.1) and the development of lipomatosis attesting atrophy of the parenchyma.
Figure 7. Acini of the pancreas (2nd degree of severity).
Figure 8. Atrophic Langerhans islet (2nd degree of severity).
Figure 9. Lipomatosis of the pancreatic parenchyma (left) and large nodule consisting of lymphocyte-like cells (2nd degree of severity)
Table 1. Mean area of one Langerhans islet depending of degree of severity
Degree of severity Mean area of one islet, 10-6 m2
1 37560.93±10349.22
4.2. Spleen
1st degree. Splenic capsule and trabeculae originating from it are thinned. The major structural elements of the spleen, the red pulp and white pulp, are clearly discernible (Fig.10). Follicles are of medium size and have round or oval shape and clear-cut borders (Tab.2). Germinative centers of the follicles are small. The walls of the central artery are unchanged. The red pulp is well developed and moderately filled with blood. Moderate diffuse accumulation of leukocytes and macrophages is seen in the red pulp.
2nd degree. Splenic capsule and trabeculae originating from it are thinned. The major structural elements, the red pulp and white pulp, are clearly discernible (Fig.10). The white pulp predominates; it is presented by follicles with abnormal architectonics. They are characterized by large, sometimes giant size, irregular shape, and blurred borders and often fuse with each other. Follicles have large light germinative centers (Tab.2). The red pulp is well developed and moderately filled with blood. Moderate accumulation of leukocytes and macrophages is seen in the red pulp; they are spread diffusely or form clusters. The walls of the central artery are unchanged.
The main difference from the previous group consists in disturbed structure of the white pulp: enlarged follicles with blurred borders.
Table 2. Mean area of one spleen follicle depending of degree of severity
Degree of severity Mean area of one follicle, 10-6 m2
1 44726.02±20380.025
2 187049.15±77346.23
Figure 10. Spleen with 1st (a) and 2nd (b) degree of severity
3rd degree. Splenic capsule is thinned, trabeculae are poorly developed. The red and white pulps are not clearly demarcated. The bulk of the organ is presented by polymorphous cells, which can be defined by their cytomorphological characteristics as blood cells of different degree of maturity, primarily lymphoblasts, relatively monomorphous closely packed small and medium-sized cells with round or oval hyperchromatic nucleus and scant cytoplasm (Fig. 11). Of typical structural elements, only traces of the white pulp are seen; they are presented by round or oval germinative centers of lymphoid follicles consisting of clusters of small polymorphous cells with round or oval hypochromatic nucleus and light cytoplasm. No marginal zones and borders of the follicles are seen. The red pulp is
poorly developed and presented by groups of erythrocytes and lymphocyte-like cells forming small clusters of irregular shape among abundant lymphoid cells. Perivascular edema is sometimes seen.
The main difference from the previous group is the absence of clear-cut red pulp and complete absence of borders between follicles.
4th degree. Splenic capsule is thinned, trabeculae are poorly developed. Typical structural elements are absent (Fig. 11). Follicles are reduced. The parenchyma is presented by polymorphous cells that can be defined by their cytomorphological characteristics as blood cells of different degree of maturity, primarily lymphoblasts, relatively monomorphous closely packed small and medium-sized cells with round or oval hyperchromatic nucleus and scant cytoplasm. Large macrophages containing detritus of phagocytosed lymphoblast nuclei are seen, which indirectly attests to high rates of tumor cell proliferation and death. Giant cells of irregular shape morphologically resembling megakaryocytes are often seen. Splenic vessels are compressed and their lumens look narrowed.
The main difference from the previous group consists in the absence of typical structures of the organ. The parenchyma is presented by leukemic cells.
Figure 11. Spleen with 3rd (a) and 4th (b) degree of severity
Figure 12. Congo red staining for amyloid, 5th degree of severity.
Numerous focal depositions of a dense amorphous eosinophilic substance positively stained with congo red for amyloid are seen among the cells (Fig.12). Since amyloid depositions form circles, it can be hypothesized that it is located along the boundary between the red and white pulps. Sometimes amyloid was located diffusely.
The main difference from the previous group consists in the presence of amyloid depositions.
Conclusions: changes in the organs corresponding to the 2nd, 3rd, 4th, and 5th degrees are typical of lymphoid or myeloid leukemia of different severity; 1st degree corresponds to normal.
4.3. Liver
1st degree. The cord structure of the liver is preserved; hepatic cords lie relatively close to each other. Hepatic lobules are poorly developed, the stroma of the liver is presented by thin interlobular connective tissue layers with well-developed interlobular veins and arteries (Fig.13). Hepatocytes have round shape, opaque and slightly granular cytoplasm, and clear-cut boundaries. Hepatocyte nuclei are clearly seen; they are unevenly stained; chromatin lumps are seen along the nucleus periphery. Diameter of central veins is not increased. Sinus capillaries are not widened.
Conclusion: despite minor changes in hepatocytes, the liver looks quite healthy.
2nd degree. The cord structure of the liver is preserved; hepatic cords lie relatively close and contact to each other. Hepatic lobules are poorly developed, the stroma is presented by thin interlobular connective tissue layers with well-developed interlobular veins and arteries (Fig.13). Hepatocytes are in a state of severe granular and hydropic degeneration, often with necrosis foci. Hepatocytes have irregular polygonal shape, markedly swelled, the boundaries between the cells are blurred, coarse granular and foamy cytoplasm contains vacuoles. Hepatocyte nuclei are poorly discernible and unevenly stained; chromatin lumps are chaotically spread in the nucleus. Necrotic cells are often seen in central regions and along the periphery of the lobule; their cytoplasm looks ragged and weakly eosinophilic; the nuclei are in the state of karyolysis. Mitotic hepatocytes are often found. Number of Kupffer cells is increased. The central veins are somewhat dilated. The lumen of sinus capillaries is narrowed and hardly visible.
Conclusion: severe toxic degeneration of the liver.
Figure 13. Liver with 1st (a) and 2nd (b) degree of severity
3rd degree. The cord structure of the liver is preserved; hepatic cords lie relatively close to each other. Hepatic lobules are poorly developed, the stroma is presented by thin interlobular connective tissue layers with well-developed interlobular veins and arteries. Hepatocytes have round shape and opaque and granular cytoplasm with foci of clarification in the form of round vacuoles; the boundaries between the cells are clearly seen (Fig.11). Hepatocyte nuclei are clearly seen; they are unevenly stained; chromatin lumps are primarily seen along the nucleus periphery. Mitotic hepatocytes are often found. Karyolysis is a relatively rare phenomenon. Central veins are dilated, numerous densely packed erythrocytes are seen in the lumen. Sinus capillaries are somewhat dilated; aggregation of blood cells with clot formation, fibrinoid swelling of the vascular walls, and pronounced edema of the space of Disse are often observed. Focal accumulations of polymorphous leukocyte-like cells forming cuffs around interlobular veins and central veins of the hepatic lobules are noted. Small accumulation of similar polymorphous cells are scattered in the liver parenchyma.
Conclusion
1 Medium-severe toxic degeneration of the liver.
2 Infiltration of liver parenchyma with polymorphous leukocyte-like cells.
4th degree. The cord structure of the liver is preserved; hepatic cords lie relatively close to each other. Hepatic lobules are poorly developed, the stroma is presented by thin interlobular connective tissue layers with well-developed interlobular veins and arteries. Hepatocytes have round shape and granular cytoplasm, the boundaries between the cells are clearly seen. Hepatocyte nuclei are clearly seen; they are unevenly stained; chromatin lumps are primarily seen along the nucleus periphery. Mitotic hepatocytes are often found. Central veins are dilated and often filled with densely packed erythrocytes. Sinus capillaries are somewhat dilated. Focal accumulations of polymorphous leukocyte-like cells form cuffs around interlobular veins and central veins of the hepatic lobules. Small foci consisting of similar polymorphous cells are scattered in the liver parenchyma.
Conclusion
1 Minor changes in hepatocytes corresponding to granular degeneration.
2 Weak infiltration of liver parenchyma with polymorphous leukocyte-like cells.
of the hepatic lobules. Small foci consisting of similar cells are scattered in the liver parenchyma. Moreover, focal accumulations of amorphous translucent colorless substance are seen in central veins of hepatic lobules.
Conclusion:
1 Minor changes in hepatocytes corresponding to granular degeneration.
2 Weak infiltration with polymorphous lymphocyte-like cells.
3 The presence of amorphous translucent substance in central veins.
Figure 14. Liver with 3rd (a) and 5th (b) degree of severity
7th degree. The cord structure of the liver is preserved; hepatic cords lie relatively close and contact to each other. Hepatic lobules are poorly developed, the stroma is presented by thin interlobular connective tissue layers with well-developed interlobular veins and arteries. Hepatocytes are in a state of severe granular and hydropic degeneration, often with necrosis foci. Hepatocytes are sharply swelled of irregular polygonal shape with coarse granular and foamy cytoplasm, the boundaries between the cells are blurred. The nuclei in many hepatocytes are poorly discernible and unevenly stained; chromatin lumps are chaotically spread in the nucleus. Necrotic cells are sometimes seen in central regions and along the periphery of the lobule; their cytoplasm looks ragged and weakly eosinophilic; the nuclei are in the state of karyolysis. Mitotic hepatocytes are often found. Central veins are dilated and often filled with densely packed erythrocytes. Sinus capillaries are somewhat dilated. Focal accumulations of polymorphous leukocyte-like cells form weakly pronounced small cuffs around interlobular veins and central veins of the hepatic lobules. Moreover, focal accumulations of amorphous translucent colorless substance are seen in central veins of the hepatic lobules.
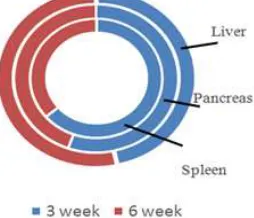
Figure 15. The frequency of the most severe tissue damage, %
Conclusion:
1 Medium-severe toxic degeneration of the liver.
2 Infiltration with polymorphous lymphocyte-like cells is weak or absent.
3 The presence of amorphous translucent substance in central veins.
After rating, the percent of the most severe damages to tissues can be determined.
As is seen from diagram, the frequency of severe injuries in the spleen and pancreas decreased by week 6, while in the liver tissue this parameter remained high.
5. Discussion
Thus, the dose of 750 R is not sublethal for C57BL mice
(LD 50/30). Changes in the blood count were noted during the
first week after irradiation, negative body weight dynamics only during week 3, and changes in serum homeostasis only during the 6th week. Despite predominance of the pathological processes, a positive dynamics was revealed: recovery of mature T cell count and decrease in extreme damage to the tissues.
Different criteria are used to evaluate the radiosensitivity (survival, rate and quality of repair, formation of micronuclei, apoptotic protein synthesis, etc.). As a result, the data on radioresistance of different animal strains greatly vary. Intensive micronuclei formation does not allow assessment of the adaptive and compensatory response of the organism, because the fate of these cells and their effect on animal viability are unknown. Even the undeniable test of survival under the influence of half-lethal doses allows predicting the loss in extreme situation, but does not explain why one or another animal survived. Due to individual variability of functioning of sanogenetic processes, the same anthropogenic factor in equal doses and concentrations will cause certain effects in some organisms (sensitive), will not cause in others, and will induce resistance in the third. From our point of view, the proposed battery of tests may be useful for predicting long-term effects of radiation.
References
[1] O.I. Stepanova, “Alternative method of blood sampling from mouse’s saphenous vein,” Biomedicine, No.2, 2006, pp. 137-139 (in Russian).
[2] M. Karganov, I. Alchinova, E. Arkhipova and R. Dubovoi, “Non-invasive polysystemic analysis of ecological and anthropogenic factors influence on children,” J.Trends of Biomedicine, Vol.24, No.1, 2009, pp.26-27.
[3] I. Alchinova, E. Arkhipova, A. Cherepov and M. Karganov, “Polysystemic monitoring of nuclear plant stuff and risk group revealing,” In: Risk assessment and management. Zhang Zhiyong ed., 2012, Academy Publish, USA. ISBN:
978-0-9835850-2-2. P. 193-199.
[4] G.N. Kryzhanovsky, “Some categories of general pathology and biology: health, disease, homeostasis, sanogenesis, adaptation, immunity. New approaches and notions,” Pathophysiology, Vol.11, No.2, 2004, pp.135-138.
[5] I.E. Kovalev, M.Y. Karganov, E.I. Rumyantseva and O.I. Kovaleva, “Laser correlation spectroscopy as an effective method of detection of DNA-containing and other macromolecular complexes in blood serum of patients with diabetes mellitus,” Doklady Biochemistry and Biophysics, Vol. 386, No 1-6, 2002, pp. 281-283.
[6] Piruzyan L.A., Kovalev I.E., Rumyantseva E.I., Kovaleva V.L., Tyumentseva E.S., Balabolkin I.I., Karganov M.Yu., and O.I. Kovaleva, “Laser correlation spectroscopy of macromolecular complexes in blood serum as an effective method of monitoring the progress of bronchial asthma in children,” Doklady Biochemistry and Biophysics, Vol. 395, No 1-6, 2004, pp. 114-117.
[7] Karganov M.Y., Kozhevnikova M.I., Aleschenko A.V., Khlebnikova N.N., Dmitrieva O.S., Alchinova I.B., Dmitrieva G.P., Pelevina I.I., and L.A. Noskin, “Correlation between cytogenic abnormalities in cells and metabolic shifts during spinal deformities in children,” Studies in Health Technology and Informatics, Vol.123, 2006, pp.9-13.
[8] M. Karganov, A. Skalny, I. Alchinova, N. Khlebnikova, A. Grabeklis, E. Lakarova, S. Eisazadeh, “Combined use of laser correlation spectroscopy and ICP-AES, ICP-MS determination of macro- and trace elements in human biosubstrates for intoxication risk assessment,” Trace elements and electrolytes, Vol.28, No.2, 2011, pp.124-127
[9] I. Alchinova, E. Arkhipova, D. Sidnev, A. Sanadze, S. Dedaev, and M. Karganov, “Comparative Analysis of the Informative Value of Radioimmunoassay and Laser Correlation Spectroscopy in Myasthenia Gravis,” ISRN Immunology,
2014, Article ID 718393, 5 pages, 2014.
doi:10.1155/2014/718393,
http://www.hindawi.com/journals/isrn.immunology/2014/718 393/
[10] Karganov M., Alchinova I., Arkhipova E., and A.V. Skalny, “Laser Correlation Spectroscopy: Nutritional, Ecological and Toxic Aspects,” In: “Biophysics”. A.N. Misra ed.- InTech, 2012, -ISBN 978-953-51-0376-9. pp.1-16. DOI : 10.5772/35254
http://www.intechopen.com/articles/show/title/laser- correlation-spectroscopy-nutritional-ecological-and-toxic-aspects
[11] E. Gulari, Y. Tsunashima and B. Chu, “Photon correlation spectroscopy of particle distributions,” J. Chem. Phys, Vol. 70, No 8, 1979, pp. 3965-3972
[12] E. Hautz, A. Cao, E. Taillandier, “Conformational change of core particles studied by quasi-elastic light scattering,” Biochem, Vol. 63, No 11-12, 1981, pp. 891-894.
[13] Horn D.S., and D.G. Dalgleish, “A photon correlation spectroscopy study of size distributions of casein micelle suspensions,” Eur. Biophys, Vol. 11, No 4, 1985, pp. 249-258.
[14] Hwand I.S., and H.Z. Cummins “Dynamic light scattering of collagen,” J. Chem. Phys, Vol. 77, No 2, 1982, pp. 616-627.