Measurement Of Student Learner’s Attribute In
Online Collaborative Problem Solving Using Social
Network Analysis
Jesus S. Paguigan, Melvin A. Ballera
Eulogio “Amang” Rodriguez Institute of Science and Technology, College of Arts and Sciences, Nagtahan, Manila, Philippines
Technological Institute of the Philippines, Graduate Studies Quiapo, Manila, Philippines
Abstract: Social network analysis offers a unique way for teacher to visualize collaboration and communication within a course and see relationships between individuals, groups or teams. The researcher used social network analysis to the growth of collaboration in class which focuses on the structure properties of network such as degree of centrality, betweenness centrality, closeness centrality, sociogram and how it related to performance of the students. In general, the SNA enable the researcher to understand how the individual students are connected within a network. In the class, teamwork plays an important role in education, aiming for developing a set of skills only achievable through social interaction. Data showed that there is a significant difference between the student collaborative problem solving in pre-test score and post-test using social network analysis. The students performed better in the post test after a week of collaboration which were administered. This means that the proposed study is beneficial to elevate the scores of students in the teamwork and exchanging of information and ideas in chatroom. The research measured the acceptability of the proposed study to help the student to elevate their proficiency level in communication and interesting in contribution of knowledge in the group, and to see their relationship to other students. Therefore, the ability of problem solving in this research study using measurement of student learner’s attribute in online collaborative problem solving using social network analysis depicts the ability of students to use teamwork or collaboration and to use connection of ideas or knowledge across networks. The Increasing ability of problem solving of students as a whole was seen from the average score of pretest and posttest results.
Keywords: Betweenness, Closeness, Centrality, Degree
1.
Introduction
Social networks measure omnipresent and arise from interactions between people or organizations in many alternative settings. Social network analysis (SNA) provides a collection of theories, techniques, and tools helpful for understanding a broad vary of human behavior changes as folks move with sure others [1]. In recent years’ social network analysis has been used for analysis and action in community contexts. Specifically, the social network analysis has been employed in program analysis, democratic governance, the choice of health democratic sociograms and involvement of key players within the intervention. Network analysis is additionally a part of methods for authorization, community mediation, community coalitions and dissemination of preventive messages, among others [2]. Social interactions between students are a serious and underexplored part of college education. Understanding how learning relationships apply in the college classroom, primarily as to how these relationships impact learning outcomes, will aid educators in distinctive ways to develop academic reforms. Social network analysis (SNA) provides the mandatory tool kit for investigation queries involving relative knowledge. The researcher introduced the basic ideas in SNA, besides methods for data collection, data processing, and data analysis, employing an antecedently collected example study on an associate degree collegian biology classroom as a tutorial. The researcher conducted a descriptive analysis of the structure of the network of co-studying relationships, exploring generative processes that create observed study networks between students and also test for an association
between network position and success on exams. The study also covered practical issues, such as the unique aspects of human subjects review for network studies. The researcher proved that using SNA in classroom environments permit wealthy and informative analyses to produce an initial tool for doing so, within the method, inspiring future academic studies incorporating relational data [3]. To achieve the study, the researcher used social network analysis which measure connection and information flow among students in the class. In this study the researcher applied three standard centrality measures: degree centrality, closeness centrality and betweenness centrality in collaborative activities. The student operating environment plays a vital role in student learning in terms of learning method in social context and student research perspective. The study is a student activity that helps elevate the problem-solving skills of the user, making them work together on the problems that are crucial if solve alone. To understand social media and their participants, educators assess the students within the network. These measures offer us insights into the different roles and groupings within the network [4].
1.1 Statement of the Problem
Specifically, the researcher seeks to answer the following questions:
1. What are the factors to be included in student learner’s attributes in online collaborative problem solving using social network analysis?
3. How to illustrate the benefit of student learner’s attributes in online collaborative problem solving using social network analysis in a learning environment?
4. Is there significant difference level of student’s performance based on the collaboration activities from pre-test to posttest?
1.2 Objectives of the Study
The general objective of the study is to develop an unmasking learner’s attributes in online collaborative problem solving using social network analysis that will enhance student learning activities from their course. Specifically, the researcher aims to:
1. To identify the factor to be included in student learner’s attributes in online collaborative problem solving using social network analysis;
2. To design the student learner’s attributes in online collaborative problem solving using social network analysis.
3. To illustrate the benefits of student learner’s attributes in online collaborative problem solving using social network analysis in a learning environment.
4. To determine if there is a significant level of student performance according to or based the problem solving of the student collaboration activities from pretest to post-test.
1.3 Conceptual Framework of the Study
Based on the studies and insights taken from the foregoing concept, theories and findings of related literature, the conceptual framework of the study was developed to represent the elements of the study, the interrelationships and its boundaries. The Figure 1.1 present the conceptual framework of the proposed study, three frames which is composed of input which went through the process and emerged as the output. The conceptual framework of the proposed study shows the different elements which define the overall scope of the objectives of the study. Each component corresponds to a distinct stage, which in turn, defines a set of requirements that the researcher needs to design and develop.
Figure 1 Paradigm of the proposed study
The input frame contains the following variables: student, problem, online collaborative chat which text-based problem situation, Student can log in at any time, and from anywhere with an Internet connection, collaboration discussion forums or chat messaging was used to response the solution or
answer over the period of time given by the teacher. The process contains the method and procedures used to analyze those variables: (social network analysis, learners’ graph, student effort, numerical effort) presenting problem situation, identifying question and gathering problem related information, finding out solutions and report of the students will include computation of the time complexity and its algorithmic program implementation by chat communication. The output frame contains the proposed software of the study which refers to the academic performance. The arrows include the workflow of information in the research process. Finally, the impact of the proposed study on the EARIST Institution as a whole which projected effect on the improvement of quality education through consistent utilization of unmasking learners attribute in online collaborative problem solving using social network analysis through the students chat collaborative learning activities.
1.4 Rationale
The web has quick gotten to be a predominant medium for collaboration between individuals and social networks, in specific, have picked up tremendous ubiquity and significance over the past few a long time. The research played a vital part in the social network of educating homes. It focused on the standards of directing the plan of the study in collaboration exercises and problem-solving aptitudes which utilize social network analysis and relate the concrete encounters that appear to contribute to the improvement of instructions and learning inside the Eulogio “Amang” Rodriguez Institute of Science and Technology Institution. The collaborative work increments inspiration; it produces higher levels of scholarly execution, as person and gather learning forms feed-back into each other; it moves forward maintenance of the substance learned; it cultivates basic considering; and it enormously increments the differences of the information and encounters being obtained [5].
1.5 Significance of the Study
The study is significant in that it helps the students and teachers in problem solving and building learner skills while allowing students to determine and reflect on their learning path, incorporating activities for self-reflection, self- and information-discovery, and collaborative information creation. It helps assess the learner achievement by negotiating the assessment process and shifting from teacher-centered to learner-centeredness. The proposed study is designed for School and Colleges. This proposed study would help the teachers and students who wish to improve the quality and equity of education learning. The researcher utilizes a network map which provides direct visualization of the structure of the student collaboration during the course of learning. The students develop more insight on decision making as the course progressed.
2.
Methodology
with existing Windows 8 default local host browser. The following subsection describe the concept and design of the web system and how the experiment was conducted.
2.1 Research Design and Methods
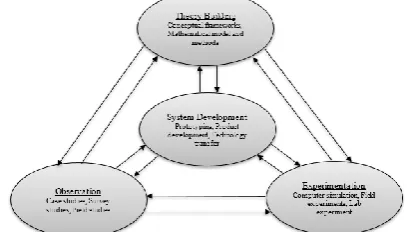
The aim of this research is to design and implement a web system. The word “design” means to create, construct according to the plan. For this study, [6] Multi-Methodological approach for information system research will adapted to proposed and develop various artefact. The adapted multi-methodological approach is practical way of designing and implementing a system. It consists of four research strategies or phase, observation, theory building, system development and experimentation that shown in figure 2.
Figure 2: A multi-methodological approach to IS Research
(adapted from Nunamaker, Chen and Purdin 1990-91, p.94).
A.Theory of Building
In this phase the researcher’s various literature and studies related to the study was reviewed. The research study was done in order to fully understand on how the student do the teamwork collaboration in the class. The researcher was reviewed the different consideration to generate the idea through online collaborative and to identify the appropriate used of SNA upon implementation which can be run on the web. The researcher used the conceptual method and SNA as a mathematical method in designing the study.
B.System Development
The researcher where the design a model which built and tested in the chosen engine. This steered through a prototype that was built by the researcher. The prototype was used to demonstrate the feasibility of the system over the given set of parameters for testing.
C.Observation
In this phase the research study observed the used of system by experiments and field study. The researcher develops new theories or design models based on the observation and experimentation of the system’s usage which used to consolidate experiences learned. The researcher observed the used of the system in trial of collaboration which the student and their teams were interested on the first place to use the proposed study.
D.Experimentation
During this phase, the researcher used strategies on research such as platform identification, modelling and simulation were conducted. Regularly, a inquire about modified would to begin with utilize test research to
explore the issue space and decide any issues to feed back to theory building and frameworks advancement, sometime recently utilizing the framework in live circumstances, which would contain a component of chance that the framework could be improper or cause down to earth issues. Usually supportive since it serves as a bridge between hypothesis building and framework improvement.
2.2 Social Network Analysis Algorithm
Social network analysis (SNA) is the methodical analysis of social networks. Social network analysis views social relationships in terms of network theory, consisting of nodes (representing individual actors within the network) and ties (which represent relationships between the individuals, such as friendship, kinship, organizational position, sexual relationships, etc.) [7]. The researcher present details about the design approach for analyzing small -medium and dynamic social network. The proposed study approach is to designed on a standard architecture and it can be applied on a broad range of social network metrics and social network analysis techniques. Based on common knowledge of system design, intuitively the researcher believe that the approach will provide important advantages for small-medium social network analysis, such as accelerating the analyses process, imparting a number of stages of analysis results, efficiently dealing with modal graphs. In order to consider and validate the approach, the researcher figure out to find out about the methodology’s performance, both theoretically and experimentally, on a set of SNA issues which cover a vast range of difficulties. According to application importance, the researcher decides to select the following four SNA metrics: Degree centrality centers on the sum of communication movement, decide the centrality of a node by means of its degree [8]. Usually the plain to degree the centrality because it simply signifies the figure of a network member’s direct contacts and has the advantage of being moderately simple to translate and communicate [9]. Degree centrality. Degree centrality equals to the figure of ties that a vertex has with other vertices. The equation where ) is the degree of as shown in the equation (1):
(1)
Closeness centrality is usually understood either as a measure of access efficiency or of independence from potential control by intermediaries [10]. Closeness centrality considers the sum of the geodesic distances between a given node and all others and thus measures the possibility to communicate depending on a minimum number of intermediaries [11]. This approach is based on the aim that nodes which have a short length to other nodes and are consequently able to propagate information effectively continue a central position in the network [12]. Closeness centrality focuses on the extensively of influence over the entire network. In the following equation, is the closeness centrality, an is the length between two vertices in the network as shown on equation 2.
∑ (2)
betweenness play the role of connecting completely different teams. Within the following formula, is all geodesics
linking node j and node k that through node I; is the geodesic distance between the vertices of j and k as shown on the equation 3. ∑
(3)
A sociogram is a net in which individuals are nodes and the relations of interest are directed line segments connecting pairs of individuals. In the simplest case such a relation is characterized only by its presence or absence [13].” An example of Social Network diagram figure 3.
2.3 Social Network Analysis Context
The Eulogio “Amang” Rodriguez Institute of Science and Technology, College of Arts and Science uses online collaborative problems solving using SNA as means to enhance the vital thinking skills in an on-line collaborative environment. The Teacher use online vital thinking case scenarios. The problem-solving skills questions will be posted and moderated by the teacher through online, and students are encouraged to engage in collaborative, and teamwork discussions regarding the problem-solving skills. The idea is to stimulate the student through the given case scenario and students discuss an idea, opinion and reasoning. The interactions were mostly instructor-centric, student-student interactions were scarce, most posts were repetitions of answers, and there were few discussions or reflections among participants. The researcher was used the study design followed an experimental, observational repeated measurement design approach. The course was monitored using real-time social network analysis; the data were collected by the end of the class and subsequently analyzed. An intervention plan was then formulated based on the analysis of the data or numerical effort point and modal graph.
2.4 Statistical Treatment
Z-Test
The researcher used z-test as the statistical test procedure which uses a sample statistic having a normal distribution. The used of z test is a statistical test procedure that uses a sample statistic having a normal distribution. The researcher used the statistical testing which way of making statistical inferences about unknown population parameters. The z test was used by the researcher for his studies in which someone is testing the problem solving to see whether posttest better than a pretest, without having to worry about other factors about the course that may influence the results. This z test is used to test hypotheses about (1) the mean of a population based on a single sample, (2) the proportion of successes in a population based on a single sample, (3) the difference
between the means of two populations based on samples from each population, or (4) the difference between the proportions of successes in two populations based on samples from each population. The formula to find the value of z-test shown in the equation 4:
where:
(4)
x mean of sample μ0 mean of population
σ standard deviation of population n = no. of observations
Hypothesis
The data were analyzed by the researcher from the proposed study were obtained through test (problem solving). To see the effect with an increased presence of data structure and algorithm problem solving ability of students using social network analysis, the researcher used experimental in the class through collaborative problem solving using social network analysis were each given a pretest and post-test. Analysis of test data was data structure and algorithm problem-solving ability of students in the form of descriptive analysis of data based on the result in social network analysis and hypothesis test. Based on the Hypothesis the researcher describes the data to accept or reject the null hypothesis and it was specifying the following:
H0: There is no significance different between the pre-test
and post-test in student collaborative problem solving in data structure and algorithm using social network analysis.
Ha: There is significance different between the pre-test and
post-test in student collaborative problem solving in data structure and algorithm using social network analysis.
3.
Result and Discussion
The chapter presents the analysis of the data as well as the discussion of the findings of the experiment conducted. The proposed study was conducted through an experiment and it was tested to fifty (50) students who were currently enrolled in course for data structure and algorithm which were observed. The results of the student collaboration in the class were recorded and were used as basis input for the social network analysis.
3.1 Factors of Social Network Analysis
formal communication, casual communication, as nicely as satisfying the tasks and necessities together in order to finally obtain a common goal.
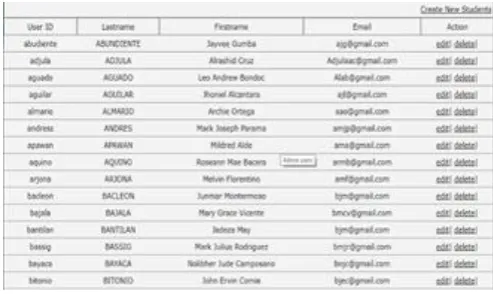
A. Student Information
A student profile is a commonly used phrase to describe the login page where students can provide a user name and password to gain access to a system organization's programs and other learning related materials that shown in figure 4.
Figure 4: Student Information
B. Problem-Solving
This is the study of collaborative gaining knowledge of environment is a way for a teacher to examine students’ participation in the learning/creating process. The researcher directs the teacher to identify participants’ roles in problem solving groups and furnish a dynamic visualization of the interactions amongst the student shown in the figure 5.
Figure 5: Teacher Post Problem Solving and Student start to collaborative chat communication
C. Collaborative Chat
Chat communication logs collected all through a collaborative problem-solving to decide the affective structure of students’ interactions. Social networks analysis naturally emerges from working in this peer-to-peer environment. One of the key capabilities is the capacity to have interaction in collaborative gaining knowledge of with team/student individuals shown in 5.
3.2 Social Network Analysis Algorithm
For the purpose of epitomizing the outcomes and discussion, some teams have been chosen for interpretation. The researcher is additionally assuming that the gaining knowledge of technique are surely represented by using the expression were coding drawn from the schema. The
hindrance of the coding system is that linguistic expression varies consequently primarily based upon the intentions and motivation of the learner. Nevertheless, the coding suggests some clear pattern in the study. The defining characteristic of social network analysis is its focal point on the structure of relationships, ranging from informal acquaintance to shut bonds. Social network analysis assumes that relationships are important. It maps and measures formal and informal relationships to understand what allows or impedes the expertise flows that bind interacting units, viz., who is aware of whom, and who shares what facts and information with whom by means of what conversation media. There are essentially three applied types of centrality particularly degree of centrality, betweenness centrality and closeness centrality.
Figure 6: Shows the student effort computational matrix
complexity is required on who is influencing whom both directly and indirectly. Outcome mapping is another method that attempts to shifts the focus from changes in state, viz., reduced poverty, to changes in behaviors, relationships, actions, and activities. Since a social network perspective is, inherently, a multi-actor perspective, social network analysis can also offset the limitations of logic models or results frameworks.
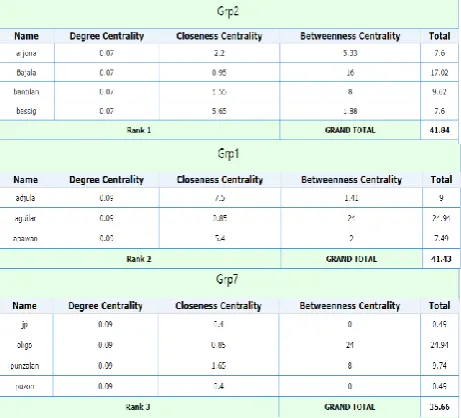
3.3 Illustration and Benefits of Social Network Analysis For the purpose of the study 3 groups has been extracted to illustrate the whole of ratio of the study or to provide a glimpse of system. In a social network, relations can be any of the gained or defined ties that can be discovered among individuals. Often, individuals are also called nodes, while the relations between nodes are called edges [17]. Below are the three (3) groups extracted were involved in the problem-solving analysis in student’s collaboration. Each figure 7 details the name of each student’s participant, degree, closeness and betweenness centrality in each group. The study design followed an experimental and an intervention plan was then formulated based on the analysis in problem solving classroom collaboration data, the data from each group where analyzed. The figure 7 converted a graph of the communication threading where student’s participant in the group directly communicated with different learners in the group such as arjona’s group, ajula’s group, oligo’s group and other student participant. Other connections are reflected in the graph.
Figure 7: shows the group of the student collaboration numerical attribute
In the figure 7 show also the benefits of social network analysis are the ranking network of the group and the dynamic score of individual participant and group. To know how many individuals come to other individual or member for information and how many individuals does this individual or member go to for information. It also measured how many times the individual between two other individual or member network, how fast can the individual get information to others in network and How well is the individual connected to other well-connected individual or members in a network
Figure 8: the sample contribution and participation of individual in the group.
The figure 8 shows the communication results produced through social network analysis which can be shared with sites through a formative feedback process of individual. A fruitful area of discussion involved how work group or individual were integrated. The important ethical considerations in presenting results or answer, depending on how the data were collected and the questions asked to individual or member.
3.4 Network Graph
Figure 8: Unmasking Learner’s attribute Threading
Snapshots of Different Member and Groups in Solving Collaborative Problem-Solving in the course using
SNA.
units to be analyzed. The questionnaire was designed where questions short and straight to the point. Map was reviewed and the problems and opportunities were highlighted using team problem solving analysis workshops. Individuals, teams, and units in the network were monitored to identify the relationships and knowledge flows between them. Sociograms, or visual representations of social networks, were all considered important to understand network data and convey the result of the analysis.
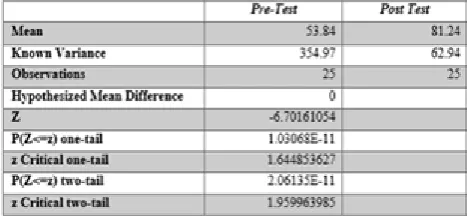
3.5 Significance Level Using Z Test
The table 1 data showed that there is a significant difference between the student collaborative problem solving in pre-test score and post-test using social network analysis. The students performed better in the post test after a week of collaboration which were administered. This means that the proposed study is beneficial to elevate the scores of students in the teamwork and exchanging of information and ideas in chatroom. The research measured the acceptability of the proposed study to help the student to elevate their proficiency level in communication and interesting in contribution of knowledge in the group, and to see their relationship to other students. As shown on the table 1 there were higher percent changes in the individual performance of the students from the pre-test to posttest. Therefore, the ability of problem solving in this research study means the ability of students to use teamwork collaborative and to use connection of idea or knowledge across networks. The Increasing ability of problem solving of students as a whole were seen from the average score of pretest and posttest results shown in the table 1.
Table 1: Pre-test and post-test score of the student collaborative problem solving in data structure and
algorithm using social network analysis.
4.
Conclusion and Recommendation
4.1 Conclusion
In this study the researcher concludes that the use of social network analysis throughout the real collaboration is feasible by extracting numerical value from the bristle messages of the students in a real time. The extracted numerical value was the individual effort points earned that contributed by the students in problem-solving collaboration activities, wherein justifying how a marking web system using social network analysis could be attributed to student’s performance. It is academically concluded that by demonstration to the students there is real numerical effort points which will be given by the web system, the students in the group were active to communicate and contribute to the knowledge procedure and increase the students in the groups for the motivation to participate on the classroom collaboration. The researcher found an increasing motivation in significance to the students to increase their problem-solving skill, basic thinking and development of knowledge. The researcher’s results were available in more in-depth analysis and expect to catch on more connection in the midst of individuals, groups, social network media preferences and comparative performance among the group. The researcher well identifies the active student with most connect, minimal connect and controlling connect on the network. Therefore, the ability of problem solving in this research study means the ability of students increased due to the use of teamwork collaborative and the use of connection of idea or knowledge across the network.
4.2 Recommendation
For the recommendation of the study, applying social network analysis to learning environments and learning problems has attracted a large amount of interest. There are different research approaches have been introduced such as learning analytics, networked learning communities, social learning analytics, and many more. The study has no right to answer for answering problem-solving in an ongoing collaboration. The research was purposely used to visualize which students has most connected, minimal connect and controlling the group or network. The proposed study is implemented as an initial phase of the study and is still on-going, subject to deeper analysis and discussion.
References
[1] Valente, T. W., Palinkas, L. A., Czaja, S., Chu, K., & Brown, C. H. (2015). Social Network Analysis for Program Implementation. PLOS ONE, 10(6), e0131712. doi:10.1371/journal.pone.0131712
Psychosocial Intervention, 24(3), 121-124. doi:10.1016/j.psi.2015.10.001
[3] Grunspan, Daniel Z., Wiggins Benjamin L., Goodreau, Steven M.,2014, Understanding Classrooms through Social Network Analysis: A Primer for Social Network Analysis in Education Research, CBE Life Sci Educ. 2014 Summer; 13(2): 167–178. doi: 10.1187/cbe.13-08-0162
[4] Ramsden, P. Learning to Teach in Higher Education. RoutledgeFalmer, 2005.
[5] De Laat, M.; Lally, V.; Lipponen, L.; Simons, R.J. Online teaching in networked learning communities: A multi-method approach to studying the role of the teacher. Instr. Sci. 2007, 35, 257–286.
[6] Nunamaker, J., Chen, M., and Purdin, T. D. M. 1991. “Systems Development in Information Systems Research,” Journal of Management Information Systems (7:3), pp. 89-106.
[7] Graph and Network Analysis Dr. Derek Greene Clique Research Cluster, University College Dublin, Web Science Doctoral Summer School 2011
[8] Del Pozo, M., Manuel, C., González-Arangüena, E., & Owen, G. (2011). Centrality in directed social networks. A game theoretic approach. Social Networks, 33(3), 191-200. doi:10.1016/j.socnet.2011.04.001
[9] Landherr, A., Friedl, B., & Heidemann, J. (2010). A Critical Review of Centrality Measures in Social Networks. Business & Information Systems Engineering, 2(6), 371-385. doi:10.1007/s12599-010-0127-3
[10] Brandes, U., Borgatti, S. P., & Freeman, L. C. (2016). Maintaining the duality of closeness and betweenness centrality. Social Networks, 44, 153-159. doi:10.1016/j.socnet.2015.08.003
[11] Del Pozo, M., Manuel, C., González-Arangüena, E., & Owen, G. (2011). Centrality in directed social networks. A game theoretic approach. Social Networks, 33(3), 191-200. doi:10.1016/j.socnet.2011.04.001
[12] Landherr, A., Friedl, B., & Heidemann, J. (2010). A Critical Review of Centrality Measures in Social Networks. Business & Information Systems Engineering, 2(6), 371-385. doi:10.1007/s12599-010-0127-3
[13] Foster, C., Rapoport, A., Orwant, C., (1963). A study of a large sociogram II. Elimination of free parameters, Behavioral Science Journal of the Society for General
System Research,
https://doi.org/10.1002/bs.3830080107
[14] S. Bandyopadhyay, A.R. Rao and B.K. Sinha, Models for Social Networks with Statistical Applications, SAGE Publications, 2010.
Author Profile
Jesus S. Paguigan received the Doctor in Information Technology and Master of Science in Computer Science, Lecturer of Computer Science and Information Technology of Eulogio “Amang” Rodriguez Institute of Science and Technology, Manila Philippines. He is currently the Research Coordinator of College of Arts and Sciences.