72
INTERNATIONAL JOURNAL OF PHARMACEUTICAL, CHEMICAL AND BIOLOGICAL SCIENCES
Available online at www.ijpcbs.com
SPECTROPHOTOMETRIC DETERMINATION OF CABERGOLINE IN
TABLET DOSAGE FORMS
C. Rambabu1, CA. Jyothirmayee2 and K. Naga Raju3*
1Department of Chemistry, A. N. U. PG Centre, Nuzvid, Andhra Pradesh, India. 2Department of Chemistry, St. Theresa’s College for Women, Eluru, Andhra Pradesh, India. 3Department of pharmaceutical analysis, Sir. C.R.R. College of pharmaceutical sciences, Eluru,
Andhra Pradesh, India.
1. INTRODUCTION
Cabergoline(1)1-[(6 allyergoline 8 -yl)]-carbonyl]-1-[3(dimethyl imino)propyl] - 3 ethyl urea(figNo.1) is a dopamine agonist licensed for the treatment of Parkinson’s disease as adjunctive treatment with levodopa plus a dopa- decarboxylase inhibitor in patients effected by on-off mobility problems. Cabergoline is a selective, ergoline, dopamine D2 agonist. Previous literature reveals that few analytical (2)and biological methods(3-7) have been reported for its quantitive estimation. In the present work, two simple, selective and
accurate visible spectrophotometric methods have been developed for the quantitative estimation of cabergoline.
In these methods involves quantitative
precipitation of drug with PMA
(phosphomolybdic acid) (first step) and estimating the PMA released (with acetone from its adduct), by reducing it with (cobalt nitrate) Co(II)-EDTA complex and method II involves quantitative precipitation of CBL(Cabergoline) with tannic acid. (Step I). The liberated tannic acid from the precipitate on treatment with acetone was determined with PMAP-Cr (VI) (P-N-methyl amino phenol sulphate- potassium dichromate) at pH 3.0.chromogen with absorption maxima at
Research Article
ABSTRACT
New, simple, selective and accurate spectrophotometric methods are described in the present work for the determination of cabergoline in the pure samples and pharmaceutical formulations. This method I involves quantitative precipitation of drug with PMA (phosphomolybdic acid) (first step) and estimating the PMA released (with acetone from its adduct), by reducing it with (cobalt nitrate) Co(II)-EDTA complex and method II involves quantitative precipitation of CBL(Cabergoline) with tannic acid. (step I). The liberated tannic acid from the precipitate on treatment with acetone was determined with PMAP-Cr (VI) (P-N-methyl amino phenol sulphate- potassium dichromate) at pH 3.0.chromogen with absorption maxima at 840nm and 570nm respectively. Beer's law is obeyed in the concentration ranges of 5-60 µg/ml and
1.6-12 µg/ml respectively. The results of analysis for the two methods have been
validated statistically and by recovery studies. The methods are extended to pharmaceutical formulations.
73
840nm and 570nm respectively. Beer's law is obeyed in the concentration ranges of 5-60
µg/ml and 1.6-12 µg/ml respectively. The
methods are extended to pharmaceutical formulations.Spectrophotometric parameters were established for standardization of the methods including statistical analysis of data these methods have been successfully extended to the pharmaceutical formulations containing cabergoline.
2. MATERIALS AND METHODS
All spectral measurements were done on
Elico-UV-Visible Spectrophotometer.
Analytical grade reagents were used and all solutions were prepared in double distilled water.
2.1. Preparations of Reagents
2.11. Preparation of ammonium molybdate
Ammonium molybdate Prepared by
dissolving 2g of ammonium molybdate in 100 ml of distilled water.
2.12. Preparation of PTC solution
PTC solution Prepared by dissolving 10g of potassium thiocyanate in 100 ml of distilled water.
2.13. Preparation of tannic acid
Tannic acid Prepared by dissolving 200mg of tannic acid in 100 ml of distilled water.
2.14. Preparation of PMAP solution
PMAP solution Prepared by dissolving 300mg of P-N-methyl amino phenol sulphate in 100ml of distilled water.
2.15. Preparation of Cr (VI) solution
Cr (VI) Prepared by dissolving 300mg of potassium dichromate in 100ml of distilled water
2.16. Preparation of buffer solution:
Buffer solution Prepared by diluting a mixture of 250ml of 0.2 M potassium acid phthalate and 204ml of 0.1M HCl to 1000ml with distilled water and the pH was adjusted to 3.0.
2.17. Preparation of standard drug solution:
About 100mgs of cabergoline was accurately weighed and dissolved in 10ml of 0.1N Hydrochloric acid in a 100 ml volumetric flask and diluted up to the mark with distilledater. The final concentration of
cabergoline was brought to 50µg/ml with distilled water.
2.2. Proposed methods 2.21. Method I
Aliquots of standard drug solution (0.5-3.0ml, 400 g/ml) were delivered in to a series of centrifuge tubes and the volume in each test tube was adjusted to 3.0ml with distilled water. Then 2.0ml of (2.194x10⁻²M)
phosphomolybdic acid was added and centrifuged for 5 min. The precipitate was collected through filtration and subsequently washed with 2.0ml of distilled water. The precipitate in each tube was dissolved in five ml of acetone and transferred into a 25ml graduated test tube. One ml (1.03x10⁻¹M) of
cobalt nitrate and one ml (1.07x10⁻¹M) of
EDTA solution were added and tubes were heated for 12 min at 60Oc. The tubes were
cooled and the solution in each tube was made up to the mark with distilled water. The absorbance was measured at 840nm against a similar reagent blank. The amount of drug was calculated from Beer’s law plot
2.22. Method II
74
2.3. Chemistry of colored spices
2.31. Method I
This method involves quantitative
precipitation of drug with PMA (first step) and estimating the PMA released (with acetone from its adduct), by reducing it with Co(II)-EDTA complex (second step). The experimental conditions were established by studying various parameters like volume of PMA, cobalt nitrate, EDTA, heating time for the maximum color development and the solvent for final dilution. The method involves two steps. First step is the quantitative precipitation of CBL with PMA. Second step is the reduction of PMA (released from the adduct) by Co (II)-EDTA complex to generate molybdenum blue. The proposed sequence of reactions is given in the scheme 1.
2.32. Method II
The method involves quantitative
precipitation of CBL with tannic acid. (step I). The liberated tannic acid from the precipitate on treatment with acetone was determined with PMAP-Cr (VI) at pH 3.0. Tannic acid contains gallic acid units. It is probable that colored species originate through the involvement of PMBQMI (forms in situ from PMAP – Cr VI) and gallic acid unit in tannic acid in the formation of a charge transfer complex. The probable sequence of reaction based on analogy is presented in scheme2
3. RESULTS AND DISCUSSION
Beer's law limits, molar absorbivity, Sand ell’s sensitivity, %range of error and %relative standard deviation are summarized in Table 1. The regression analysis using the method
of least squares was made slope
(b),intercept(a) and correlation co-efficient (r) obtained from different concentrations are given in table 1. The results showed that these methods have reasonable precision.
The optimum conditions for colour
development formethods I and II have been established by varying the parameters one at a time and keeping the other parameters
fixed and observing the effects of product on the absorbance of the colored species. To evaluate the validity and reproducibility of the methods, known amounts of pure drug were added to the previously analyzed
pharmaceutical dosage forms and the
mixtures were analyzed by the proposed methods. The percent recoveries are given in Table - 2. The interference studies revealed that the common excipients and other additives that are usually present in the tablet dosage forms did not interfere at their regularly added levels.
4. CONCLUSIONS
The proposed methods are found to be simple, selective accurate and can be used in the estimation of cabergoline in pure and pharmaceutical dosage forms in a routine manner.
ACKNOWLEDGEMENTS
The authors are thankful to the department of chemistry, Acharya Nagarjuna University- Dr. M.R. Appa Rao Campus, Nuzvid for providing laboratory facilities.
N
N N
O
CH3 N
H CH
3 O
CH3
H
H
CH2
HN
75
Step I
CBL + PMA CBL - PMA + PMA (precipitate) (Unreacted )
Step II
PMA + Co
N O
N O
C H2
O
CH2
CH2
C H2
O C O
O
C
O O
CH2
CH2 C
2-Molybdenum Blue
C
N O
N O
CH2
O
CH2
C H2
CH2
O C O
O
C
O O
C H2
CH2 C
C
+
3-(Released from precipitate with acetone)
Co
Co(II)-EDTA Co(III)-EDTA
Scheme 1: Chemistry of proposed method I
Step I
CBL + TA CBL - TA + TA Adduct (unreacted)
(Precipitate) Step II
N H2C H3
O H 2
S O4-2 + C r(V I) 2
N C H3
O
2
N C H3
O
+ G A es te r in T A
(R elea sed fro m p rec ipitate)
O H
H O
O H
O O
C O O H N C H3
76
Scheme 2 : Chemistry of proposed method II
0 0.1 0.2 0.3 0.4 0.5 0.6
0 20 40 60 80
Conce ntr ation µg m l-1
A
b
s
o
rb
a
n
c
e
[PMA = 1.753x10⁻³M
[EDTA] = 4.298x10⁻³M
[Co(II)] = 4.123x10⁻³M
Fig. 2:Beer’s law plot of CBL-PMA (M1) method
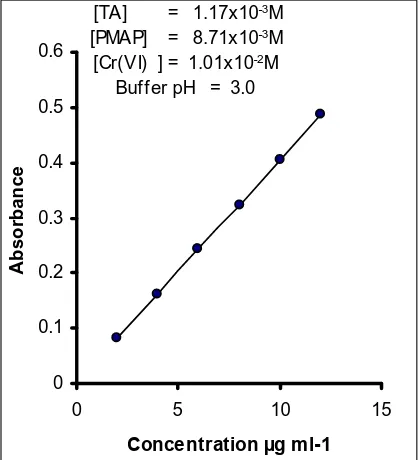
0 0.1 0.2 0.3 0.4 0.5 0.6
0 5 10 15
Concentration µg m l-1
A
b
s
o
rb
a
n
c
e
[TA] = 1.17x10⁻³M
[PMAP] = 8.71x10⁻³M
[Cr(VI) ] = 1.01x10⁻²M
Buffer pH = 3.0
77
Table1: Optical regression characteristics, precision and accuracy of the proposed
methods for cabergoline
Parameter Method I Method II
max (nm) 840 570
Beer’s law limits (g/ml)
5-60 1.6-12
Detection limit (g/ml) 0.2936 0.1079
Molar absorptivity (1 mol-1.cm-1)
5.0490x10³ 8.807x10³
Sandell’s sensitivity (g.cm-2/0.001 absorbance unit)
0.09132 0.0343
Optimum photometric range (g/ml)
25 - 40 6 - 9
Regression equation (Y=a+bc) slope (b)
0.0109 0.0413
Standard deviation on slope (Sb)
2.7502x10⁻⁵ 5.502x10⁻⁴
Intercept (a) 2.0241x10⁻⁴ 5.6x10⁻³
Standard deviation on intercept (Sa)
1.0720x10⁻³ 1.486x10⁻³
Standard error on estimation (Se)
1.1526x10⁻³ 3.48x10⁻³
Correlation coefficient (r)
0.9996 0.9994
Relative standard deviation (%)*
0.268 1.007
% Range of error (confidence limits)
0.05 level
0.281 1.057
0.01 level 0.441 1.6579
% error in Bulk samples **
-0.562 0.369
*Y = a+ bx where x is the concentration of cabergoline in g/ml and Y is the
absorbance at the respective λmax.
** Average of six determinations considered.
Table 2: Assay of cabergoline in Pharmaceutical formulation
Formulation Labelled amount in mg
Amount found by proposed
methods
MI MII
% Recovery*
by proposed
methods
MI MII
Tablet - I 1 0.997 1.004 99.7 100.4
Tablet - II 1 0.992 0.998 99.2 99.8
*Recovery amount was the average of six determinations.
REFERENCES
1. http:/en.wikipedia.org/wiki/Cabergoline 2. Toshihiko Yoshida, Makoto Tanaka,
Suzuki, Makoto Sohmiya and Koichi
Okamoto, Neuroscience letters.
2002;1:330.
3. Onal A et al Chem Pharm Bull (Tokyo). 2007;55(4):629.
4. Levi MS and Brimble MA. Current medicinal chemistry. 2004;II(18):2383 – 2397.
5. Hutton JJ, Kolher WD, Ahlskog JE et al. Neurology. 1996;46:1062 – 1065.
6. Destee A, Schneider E, Gershanik O, Dom. R, Tichy et al. Movement disorders. 1996;22(1):26-29.
7. Igarashi K. Hotta K, Kasuya F, Abe K and Sakoda S. J Chromatograph B. Anal Tech
Bio – medical life Sciences.