PATH PRIORITIZATION AND OPERATIONAL CONSISTENCY FOR
DYNAMIC TRAFFIC ASSIGNMENT: AN ANALYTIC HIERARCHICAL
APPROACH
Srinivas Bulusu1, Srinivas Peeta2, Hong Zheng3, Sushant Sharma4
1 E2open, Inc., Dallas, TX 75240, United States of America
2 Lyles School of Civil Engineering, Purdue University, West Lafayette, IN 47907, United States of America 3 NEXTRANS Center, Purdue University, West Lafayette, IN 47906, United States of America
4 Texas A&M Transportation Institute, San Antonio, TX 78213, United States of America
Received 18 August 2015; accepted 2 March 2016
Abstract: An operational consistency model for real-time dynamic traffic assignment (DTA) applications seeks to correct the time-dependent path assignment within a rolling horizon scheme. This study extends an existing consistency framework to develop a hierarchy for the time-dependent path set based upon their relative importance to ensuring consistency. Using the analytic hierarchy process, the eigenvalue associated with a path is identified as the parameter which enables the rank ordering of paths. The ability to identify a subset of dominant paths relative to enhancing consistency enhances the computational viability of the consistency framework for real-time implementation and has significant practical implications. Additionally, it provides insights on the complex dynamics that are inherent to the operational consistency problem.
Keywords:dynamic traffic assignment, analytic hierarchy process, path prioritization, eigenvalue.
2 Corresponding author: [email protected]
1. Introduction
The dynamic traffic assignment (DTA) problem entails the consideration of several aspects including the accuracy, effectiveness, stochasticity, computational tractability, traffic realism, user heterogeneity, and system characteristics (information availability, type, and dissemination sources). The deployment of DTA entails using sensor data to adjust the DTA model in real-time. The real-time issues can be classified into two groups in general: those pertain to the system-wide operations (system-related issues), and those relevant to the solution procedure and quality (solution-related
issues). The system-related issues include the functional integration, operational execution and its time requirements, measurements and reliabilities of system components, tolerances, and control architecture. The DTA solution-related issues address various nuances of consistency, robustness, and stability of solutions arising from a number of stochastic factors. While the two types of issues are dependent upon each other, this study focuses on the solution-related issues under a set of mild system-related assumptions.
network states over time. It is a solution-related issue that can arise from unreliable origin-destination (O-D) demand estimation (Zhou and Mahmassani, 2005), simplified traffic flow dynamics (Zhang and Nie, 2005), inaccurate traffic flow model (Doan et al., 1999), detector measurement errors (Peeta and Anastassopoulos, 2002), behavior-related factors in route choice (Lotan and Koutsopoulos, 1993; Paz and Peeta, 2009), unpredictable incidents (Peeta and Zhou, 2002) and incorrect assumption of system-related parameters (Peeta and Yu, 2006). Without the correction of the above errors, the inconsistency would accumulate and propagate in the system making the network state estimation and prediction potentially unreliable. The inconsistency can also be viewed as the aggregate effect of random or unknown factors that introduce errors in the path assignment procedure (Peeta and Zhou, 2002).
Inconsistency issues for DTA have been mostly investigated in the context of specific contributing factors. For instance, studies (Antoniou et al., 2007; Balakrishna et al., 2007; Ben-Akiva et al., 2001; Zhou and Mahmassani, 2005) have sought to calibrate DTA models through optimization or statistical methods (He and Ran, 2007) to reduce the inconsistency by adjusting demand, supply, or demand and supply jointly (Huang et al., 2010; Omrani and Kattan, 2012; Vaze et al., 2009). These studies view inconsistency arising from incorrect O-D demand and/or behavior model on the demand side, as well as incorrect traffic flow model on the supply side. Incorrect prediction of travelers’ route choice behavior
en route decisions describe their behavior in response to a change in traffic conditions and the need to deviate from their pre-trip routes. Hybrid route choice models, which combine both pre-trip route choice and en-route en-route choice, have been used to address this inconsistency (Pel et al., 2009; Qian and Zhang, 2013). These studies highlight that behavior is a key source of inconsistency due to the spatio-temporal interactions resulting from travelers’ route choice decisions under information provision. Hence, behavioral aspects need to be carefully considered in consistency-checking procedures to factor travelers’ learning processes and en route adjustment in predicting the time-dependent network states (Paz and Peeta, 2009; Peeta and Yu, 2005).
for ensuring consistency, which seeks to minimize deviations between real-time traffic measurements and predicted network states. All of these studies focus on real-time operational implementation, which requires the development of tractable and computationally efficient solution algorithms.
To address the inconsistency issue for real-time DTA, Peeta and Zhou (2002) developed a hybrid framework combining offline and real-time strategies to deal with two solution-related issues: (i) factoring the randomness in the O-D demand and/or network supply conditions, and (ii) enhancing the computational performance. The offline component uses historical O-D demand data to determine a robust initial solution, which is then updated dynamically in real-time based on unfolding O-D demand and incidents. The computationally intensive components are addressed offline to generate a robust initial solution that allows for efficient real-time updates, thereby enhancing the computational performance. Peeta and Yu (Peeta and Yu, 2004, 2005; Yu and Peeta, 2011) proposed and numerically analyzed a model that combines quantitative and qualitative variables in a single framework to more robustly predict travelers’ en-route route choice behavior under information provision. Later, Peeta and Yu (2006) combined their route choice model for network loading and a consistency-seeking model that updates driver behavior class fractions in real-time, called a behavior based consistency-seeking model (BBCS). BBCS captures the heterogeneous driver class fractions in real-time using the observed link traffic counts (Peeta and Yu, 2006). Although BBCS improves the solution quality, the computational effort is still significant relative to real-time deployment needs.
Peeta and Bulusu (1999) proposed a theoretical consistency-seeking model (CONS) to improve the operational consistency for real-time DTA with advanced traffic management and information systems. In this model, the inconsistency is measured by comparing predicted and observed link traffic counts, and is assumed to arise from a number of sources including inaccurate O-D demand, traffic incidents, inaccurate prediction of path choices for the unequipped user class (vehicles in this class are not equipped to receive real-time information), and inaccurate prediction of compliance for the equipped user class. The model is applied in a rolling horizon-based DTA approach (RH-DTA) (Peeta and Mahmassani, 1995) to improve the consistency by adjusting the path assignments. More specifically, the model first solves a deterministic DTA problem based on rolling-horizon technique to predict the traffic network performance, and then improves the consistency measured by the difference between the predicted network performance and the observed conditions unfolding in real-time. The consistency problem was then formulated as a constrained least squares model and solved using the generalized singular value decomposition (GSVD) method.
computational efficiency considerably, which is synergistic with the real-time deployment objective.
I n t h is st udy, we use t he A na ly tic Hierarchy Process (AHP) to rank order the time-dependent paths in terms of their contribution to enhancing the consistency for real-time DTA deployment, by generating eigenvalues. Paths ranked high are grouped as the set of dominant paths. The rank ordering within the set of dominant paths signifies the importance of a path over the others in the consistency context. The inconsistency is corrected by manipulating only the set of dominant paths rather than all time-dependent paths.
The remainder of the paper is organized as follows. In the next section, the concept of AHP is brief ly introduced, and the methodology to obtain priorities using eigenvectors of a pairwise comparison matrix is discussed. Section 3 applies AHP to the real-time consistency problem to obtain the path hierarchies. It also discusses the AHP-based path prioritization procedure and solution algorithm. Section 4 presents simulation experiments to demonstrate path prioritization in relation to real-time consistency. The final section summarizes the findings of this study and provides some concluding comments.
2. Analytical Hierarchy Process (AHP)
2.1. The Analytic Hierarchy Process (AHP)
The analytic hierarchy process (AHP) (Saaty, 1977; Saaty, 1980) is a technique
significantly, to the extent that considering the dominant subset of TDPs suffices to provide a similar degree of accuracy in the consistency context as when all paths are considered. From an operational perspective, this procedure suggests that manipulating the subset of dominant paths in the network at the current time can enhance the overall system performance in a CONS model. The resulting CONS model has a substantially reduced size that enables computational efficiency for real-time operational needs.
Saaty (1980) discusses aggregate decision-making using AHP, in which a set of alternatives is prioritized (or weighted) according to their importance. The AHP approach is as follows. First, in each level of a hierarchy with respect to an element of the next higher level, a pairwise comparison of n alternatives is constructed in an n x n square matrix. In the current context, the set of alternatives are the time-dependent paths at a specific time. Each matrix element (ith row and jth column) indicates the strength with which path i dominates another path j for a given criterion. Next, the weights of the elements in each level of a hierarchy are scaled with respect to an element of the next higher level. This paper adopts Saaty’s method (Saaty, 1977) to scale the weights of the TDPs at a specific time with respect to another TDP of the next higher level. This is discussed in detail in the next subsection.
2.2. Determine Priorities: The Eigenvector
Approach
goals in an analytic hierarchy process: (i) determine the relative importance of each objective involved in the decision process, and (ii) ensure that the qualitative judgment regarding each alternative to fulfill a certain objective is properly quantified.
Saaty (1980) proposed the eigenvector method for AHP. Let P1, P2… Pn be the set of alternatives, which are the set of TDPs in our context. The relative importance (or weight) of alternative Pi compared to alternative Pj is denoted by pij (usually specified using a 1-9 scale). The pairwise comparisons of alternatives are represented in a reciprocal matrix:
1 2
1 12 1
2 12 2
1 2
1
1/ 1
1/ 1/ 1
n n n
n n n
P P P
P p p
P P p p
P p p
=
(1)
This matrix has positive entries and is called the reciprocal matrix as it satisfies the reciprocal property pji = 1/pij.
The information conveyed by P can be synthesized by methods such as least squares and logarithmic least squares methods (Harker and Vargas, 1987). P is considered to be inconsistent when the reciprocal law is violated, that is, it does not satisfy the relation pij pjk = pik for every i, j, and k. In such a case, the eigenvector method is useful to handle the inconsistency.
Let W be the column vector that denotes the relative weights (w1… wn) of the considered objective. There are n eigenvalues in the square matrix P. Since all diagonal elements in P are 1, the sum of all eigenvalues is n. If
λiis the ith eigenvalue, then:
( )
i tr P sum of thediagonal elements n
λ= ≡ =
∑ (2)
where tr(P) represents trace of matrix P. In a consistent matrix where the reciprocal law is strictly maintained for every i, j, and
k, the largest eigenvalue is “n” and the other eigenvalues are zero. The relative weights in such a case can be obtained by solving the following Eq. (3):
P W = n W (3)
where W is the eigenvector corresponding to the eigenvalue n. But in most cases, the reciprocal matrices are not perfectly consistent. The degree of inconsistency is measured by the difference between the maximum eigenvalue λmax and n. The closer
λmax is to n, the higher degree of consistency of
P. When max is not significantly different from
n, the relative weights W can be estimated as follows:
P W = λmax W (4)
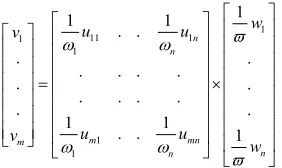
ratio should be lower than 0.10 for every comparison matrix to ensure an accurate estimation. The relative weights of the alternatives under each of the objectives can be determined following the aforementioned steps. Let u1k, u2k… umk be the relative weights of the m alternatives under the objective
k. Let ; the normalized weights under the objective k are obtained as . The normalized weights are aggregated to determine the priorities of the alternatives. The aggregated weights V for the alternatives are determined as follows:
(5)
The alternative with the highest weight is then chosen as the most desirable alternative. The weights are ranked in the descending order and ref lect the priorities of the alternatives.
3. Application of AHP to the Real-Time
Consistency Problem
3.1. Overall Framework
This study extends Peeta and Bulusu’s CONS model (Peeta and Bulusu, 1999) using AHP to improve real-time DTA consistency. The
developed model is labeled as AHP-based CONS (A-CONS). The AHP is used to rank order the TDPs using the eigenvector approach in terms of their significance to inconsistency.
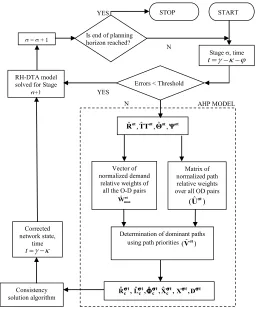
Fig. 1 illustrates the A-CONS for real-time DTA in a stage-based rolling horizon framework. The objective is to reduce the real-time inconsistency between the observed and predicted system states. As illustrated in Fig. 1, the AHP model is triggered if the time-dependent error, measured by the discrepancy between the observed and predicted link traffic counts at specific time points, exceed a pre-defined threshold. The AHP determines the relative weights of the TDPs in the current stage σ, which are used to rank order the TDPs according to their significance to inconsistency. A subset of TDPs with the top r ranks (i.e., 1 through r
out of the total f paths in the current stage) is chosen as the dominant path set, denoted by
c. All O-D pairs that contain the dominant paths are used to determine various inputs to the A-CONS model, including a predicted link-path incidence matrix t
c
Lˆσ, a predicted
transition matrix t c
ˆσ
Φ , a predicted vector Rˆcσt
denoting the time-dependent number of travelers on the paths c, and the observed link traffic counts t
c
Xσ. The A-CONS model then
Fig. 1.
AHP-Based Framework for the Consistent Real-Time DTA Problem
Fig. 2.
The rest of the procedure is essentially identical to the framework in Peeta and Bulusu (1999). The rolling horizon based DTA (RH-DTA), as illustrated in Fig. 2, is used to solve for the predicted traffic states for stage σ. It is used to predict the link traffic counts towards the end of stage , and determine the path assignments for the roll period of this stage. A comprehensive description of the RH-DTA algorithm and its implementation is provided in Peeta and Mahmassani (1995).
In the proposed A-CONS model, a subset of dominant TDPs is identified and utilized to correct inconsistency. Thereby, the dimensions of the A-CONS model and the corresponding computational effort are reduced substantially. The key aspect of A-CONS model is how to ensure that the significant factors inf luencing the consistency are appropriately identified for the rank ordering of the paths.
3.2. The Problem Statement
A traffic network is represented by a directed graph G(N, A) where N is the set of nodes and
A is the set of directed arcs. Denote by Rˆσt
a f-dimensional vector of predicted (time-dependent) number of travelers on f paths up to time t, TTˆ ót a vector of predicted (time
dependent) travel times on f paths, and t kσ
Ψ
a vector of number of links on each path k.
Denote by Dˆσt the predicted number of
vehicles at the origin at time t= − −γ κ ϕ (see
Fig. 2) in stage σ. The AHP model seeks rank order the TDPs in terms of their contribution to the real-time consistency.
3.3. The AHP Model
This section discusses the AHP model for identifying a subset of dominant paths according to their significance in contributing to inconsistency for the real-time DTA problem. First, a pairwise comparison matrix is developed for each objective in AHP. An objective represents a factor contributing to inconsistency. In A-CONS two factors are considered, O-D demand and TDPs for each O-D pair. The two factors are modeled in the following hierarchy approach. At the first hierarchy level, a pairwise comparison matrix of all O-D pairs is established based upon the demands. This incorporates the effect of how O-D demand influences the path characteristics. Suppose the rest factors have equal effects, an O-D with larger demand has more contribution to congestion (link and path flows) and inconsistency (link and path flow errors between observed and predicted states). The second hierarchy level addresses the relative importance of a path in an O-D pair relative to consistency. The weight for each TDP is determined and its priority is computed based upon its contribution to the inconsistency in a specific O-D pair.
In the first hierarchy, the O-D comparison matrix has the following structure:
where b is the number of O-D pairs. θˆpqis an
element of the matrix specifying the ratio of demand between O-D pairs p and q by Eq.(7):
(7)
where , kj denotes the number of paths for O-D pair j,and Dˆjis the total predicted time-dependent O-D demand for O-D pair j at time t in stage σ.
t
ˆσ
Θ is an b b× square matrix with diagonal elements of value 1, and satisfies the reciprocal property (see Eq. (8)).
Due to the reciprocal feature of Θˆσt, the
vector of relative weights can be computed by solving the equation . As discussed in Section 2.2, the eigenvector associated with the maximum eigenvalue λmax
specifies the weight is normalized
by , where is the element in vector is the summation of all the elements in the vector . The normalized
vector is unique, and also .
(8)
The second hierarchy level addresses the relative importance of a path in an O-D pair relative to consistency. For each O-D
pair s, a comparison matrix is developed that comprises of ks paths for s. Hence, n comparison matrices are developed. An element of the path comparison matrix for s is given by ˆ t
ij
cσ , where i, j ∈k
s, and is computed as follows:
(9)
The factor for path i ∈ks in the O-D pair s
is computed as:
(10)
where
= the predicted number of vehicles on path i of O-D pair s at time t in stage σ
= the predicted travel time on path i
of O-D pair s at time t in stage σ
= number of links on path i of O-D pair s at time t in stage σ
The structure of ˆ t si σ
Γ in Eq. (10) is based
on the factors that determine the relative importance of one path compared to the others in terms of contribution to consistency. The numerator, ˆt
si
Rσ , is a straightforward indicator of the path’s contribution to the traffic flow. A large value of ˆ t
si
Rσimplies a larger upper bound on the potential error between predicted and observed path flows. A better measure relative to consistency would be the errors in the link or path f low counts rather than just the predicted path flow ˆ t
si
Rσ. The denominator represents the average travel time per link of path i. t
si σ
Ψ is used to remove
than the distance between the origin and destination, is the focus of consistency. A large denominator value implies more severe congestion on path i due to the congestion on one or more of its links.
Based on Eqs. (9) and (10), the path comparison matrix is also a reciprocal matrix and has the following structure:
(11)
The weights of the path comparison matrix are obtained by solving the equation . The eigenvector is normalized to obtain the relative weights of the paths for the O-D pair s, as shown in Eq. (12):
(12)
where is the sum of values in the eigenvector associated with the maximum eigenvalue for the O-D pair s. The maximum eigenva lues and the corresponding eigenvectors are obtained for all O-D pairs and normalized. The matrix Uˆσt, defined as the relative weights for all S O-D pairs, is of the dimension (K × S), where K equals
1
S s s= k
∑
. The vector of path priority values, , is
1 max,1 1 max,2 2 2 ,max 1 max,
ˆ 0 0 ˆ
ˆ
ˆ ˆ
ˆ 0 0 1
ˆ ˆ
ˆ 0 0 ˆ
S i i S K S U w v w v U w w
v U =
= ×
∑
(13)The path priority values in Eq. (13) are used to determine the rankings of the TDPs in the network according to their significance to enabling consistency. These paths are used to determine the predicted state of the system
(
t)
c t c t c t
c,Lˆ ,ˆ ,Xˆ
Rˆσ σ Φσ σ for the A-CONS
model. The subscript “c” indicates that only dominant paths are used to predict the system state. is a vector of predicted (time-dependent) number of travelers on the set of dominant paths, is a predicted time-dependent enhanced link-path incidence matrix. It indicates the proportion of the number of travelers on a set of TDPs which passes a given link. The elements of are fractions between 0 and 1. is a predicted transition matrix which indicates the time-dependent existence of paths for every O-D pair. It consists of binary values 0 and 1, where 1 indicates the existence of a path. is a vector of predicted link count.
The simulation-based numerical experiments in Section 4 explore the impact of the set of dominant paths in terms of how much they can correct the discrepancy between the observed and predicted system states (in terms of travel times and the consistency indices).
deterministic DTA solution algorithm (Peeta and Mahmassani, 1995), and (ii) an AHP-based consistency solution algorithm. The consistency solution component fits seamlessly with the notion of execution cycles within the context of real-time DTA system operations. It can be triggered at discrete (and unequal) time points based on the logic for consistency check internally embedded with the real-time DTA solution algorithm, as discussed hereafter.
Solution Algorithm
Step 0: Set stage = 0. It represents the time at the start of the planning horizon of interest.
Step 1: Obtain the O-D demand for stage and information on current network conditions at time (see Fig. 2) prior to the start of stage . Initial paths for users in stage are obtained either exogenously from historical data or from current network conditions.
Step 2: Execute the deterministic RH-DTA algorithm for the stage at time before in stage to determine the set of predicted path flow vector Rˆ for stage .
Step 3: AHP Algorithm
Let . From Step 2, obtain the predicted state of the network , in terms of number of users on each TDP, , the predicted time dependent travel times on each path, the predicted time-dependent O-D demand for each O-D pair , the number of links on each path , and link-path incidence matrix Lˆσt for time
of the current stage σ. Also, obtain the corresponding predicted link traffic counts Xˆσt from the deterministic
DTA solution.
Step 3.1: Using , obtain the pairwise comparison matrix using Eq. (8).
Step 3.2: Obtain the eigenvalues and eigenvectors of the pairwise comparison matrix by solving the equation
(
Θˆσt−λI)
t
Wˆσ = 0. The maximum eigenvalue and
the corresponding eigenvector are used to obtain the relative weights of the O-D pairs. The eigenvector is normalized to obtain the normalized relative weights
t max
Wˆσ of all O-D pairs.
Step 3.3: Using , and determine the path comparison matrix Cˆσt.
Step 3.4: The maximum eigenvalue and the corresponding eigenvector of the path comparison matrix Cˆσt for each O-D pair
are used to provide the relative weights of the paths for each O-D pair. The relative weights are normalized by Eq. (11). The matrix Uˆσt denotes the normalized path
relative weights for all O-D pairs.
Step 3.5: Compute the vector of path priorities using Eq. (12). They are used to rank TDPs in the network at time
in stage σ.
Step 3.6: A subset of TDPs with the top rank orders determines the dominant path set in the network. These TDPs are used to obtain the predicted network state
described by t
c t c t c t
c ,Lˆ ,ˆ ,Xˆ
Rˆσ σ Φσ σ , which is used as input to the A-CONS in Step 6.1.
Step 4: Implement the path assignments for the roll period of stage σ.
Step 5: Obtain the observed link traffic counts, Xσt at time in the
in the network (where ε is a positive scalar specifying a threshold), consistency is preserved; go to Step 7. Otherwise, go to Step 6.
Step 6: Use Consistency Solution Algorithm (Peeta and Bulusu, 1999) to obtain the corrected network state R~σt at time .
The consistency solution algorithm applies a generalized singular value decomposition (GSVD) approach to determine
simultaneously that are consistent with the observed link counts .
Step 6.1:
, where ~ represents the corrected states.
t 0
L is a vector of corrected time-dependent
enhanced link-path incidence matrix at the initial iteration; is a vector of corrected time-dependent transition matrix at the initial iteration; t
0
R is a
vector of corrected number of travelers on TDPs at the initial iteration; and t
0
X
is a vector of correct link counts at the initial iteration. Also, observed link counts and O-D demand Dσt at time t
are obtained. Set iteration number i = 0.
Step 6.2: Appendδ I to the enhanced link-path incidence matrix t
i
L~ , where δ is a small scalar, and I is an identity matrix with dimension of t
i R
δ =
t i i L
L I
and t
i i ~
~ =Φ
Φ
Step 6.3: Decompose the matrix L~i and
transition matrix Φ~i using an orthogonal
transformation (Peeta and Bulusu, 1999) to obtain an upper triangular invertible
matrix M and orthogonal matrices Q1 and Q2 such that L~i = Q1 M and Φ~i = Q2 M.
Step 6.4: Decompose Q1 and Q2 using the CS decomposition (Peeta and Bulusu, 1999), a simultaneous diagonalization algorithm, to obtain diagonal matrices C and S.
Step 6.5: Obtain the corrected state of the network t
1 i
R~+.
Step 6.6: Using t 1 i
R~+ as the input to the traffic flow model, determine the corresponding link-path incidence matrix
t 1 i
L~+ and transition matrix Φ~ti+1.
Step 6.7: The convergence of this algorithm is assumed if the following criteria are satisfied:
(i) If errors in link traffic counts are within the threshold α of observed counts, and (ii) If the error in terms of the average vehicular travel time in the roll period of stage is within % of the observed time
at time t.
Criterion (ii) is used only if the travel times can also be observed. If convergence is achieved, go to Step 7. If not, set i = i + 1, and go to Step 6.2 of the consistency solution algorithm.
Fig. 3.
Solution Framework for the AHP-Based CONS Model
4. Simulation Experiments
The performance of the proposed AHP-based CONS model for the real-time DTA is analyzed using simulation-based numerical experiments. The traffic and network characteristics are discussed in Sections 4.1 and 4.2, respectively. The performance measures used to analyze the consistency solution framework are as follows:
1. Percentage error in average travel time: This index provides the percentage error in average travel time for all vehicles in
the roll period of a stage. It provides the percentage deviation of the travel time of the predicted state from the observed state, and is computed as:
% 100 * TT
Tˆ T TT
t t t
σ σ σ−
(14) where:
= Observed average travel time at time
t in stage σ
= Predicted average travel time at time
t in stage σ
in the number of users on a link under the observed and predicted states. It is computed as follows:
2
1 2
ˆ
( )
ˆ t t
t t i i
i l
Z Z
Z Z
I
σ σ
σ σ
Ψ
= − −
= =
Ψ Ψ
∑
(15)
where: l
I = Link consistency measurement t
Zσ = Observed state of the network (link
count) at time t in stage σ
ˆ t
Zσ = Predicted state of the network (link
count) at time t in stage σ
Ψ = Total number of links
The consistency measurement indicates the average error per link in terms of the number of users on that link. The normalization allows comparison of the consistency measurement across stages.
3. Path Consistency measurement (Ip): Ip is defined similar to the link consistency measurement (Eq. (15)), except that link counts are replaced by number of users on TDPs, and Ψ is replaced by number of paths.
It is pertinent to note that while the first two indices are measurable, current technology precludes complete determination of Ipin the real world. It is used here primarily to derive insights on the consistency solution algorithm.
4.1. Network Configuration and Traffic
Characteristics
Table 1 specifies the user class characteristics of the vehicles generated in the network. In the experiments, all four user classes are assumed to be equally represented. The parameters α and β denote the threshold errors in terms of link traffic counts and average vehicular travel time, respectively.
α and β are determined through sensitivity analysis; they are 15% and 6%, respectively, in these experiments. Also, those users who have not reached their destination in the current stage and have an expected remaining travel time greater than 15% of the roll period are used in the consistency analysis.
Table 1
User Class Characteristics
User Class Percentage (%) Type of Information
System Optimal1 (SO) 25 Pre-trip
User Equilibrium2 (UE) 25 Pre-trip
Boundedly Rational3 (BR) 25 Pre-trip + En route
Pre-Specified4 (PS) 25 No Information
1 Equipped users following prescribed system optimal paths. Users who are either unfamiliar with the typical network traffic conditions or affected by a severe incident are likely to follow this information.
2 Equipped users following prescribed user equilibrium paths. Users who are very familiar with the typical network traffic conditions are likely to follow this information.
3 Equipped users following the boundedly rational switching rule in response to descriptive information on the prevailing network conditions. The switching rule states that users switch from their current path at decision points if travel time savings on an alternative route exceed a threshold value.
4 Unequipped users following pre-specified paths. These paths are either determined from historical data (representing past network experience) or solved for exogenously based on current conditions. It is assumed that in the absence of information, users do not switch routes en route.
The AHP-based framework is analyzed at the third stage of the planning horizon, which comprises of 1,560 paths and 4,031 users, as
shown in Table 2. It is assumed that traffic conditions are normal and no incidents occur in the network over the horizon of interest.
Table 2
Stage Traffic Characteristics
Stage Number Number of Paths Number of Users
2 1377 3008
3 1560 4031
4 1430 3031
5 1458 3072
6 746 1245
4.2. Scenarios Addressed
Two scenarios are considered to investigate the effectiveness of the proposed A-CONS model.
from 1 to 150. The second set consists of paths ranked 250 to 400, and the third set comprises of the least dominant paths that are rank ordered from 1,410 to 1,560. The objective is to analyze whether more dominant paths are more effective in correcting the gaps between the predicted and observed states.
Scenario 2: The objective of this experiment is to study the marginal improvement in terms of travel time error and the consistency index when more paths are included in the dominant path set. The paths are included in increments of 150 based on their rank-orders.
4.3. Analysis of Results
Figs. 5-7 show the results for Scenario 1. Fig. 5 illustrates the AHP-based performance relative to consistency in terms of percentage errors in travel times for the three different sets of rank ordered paths for the 3rd stage.
The initial error between the observed and predicted states is 58%. When the A-CONS is used with the paths ranked from 1 to 150, the percentage error of average travel times is reduced to 10% of the observed travel time over 11 iterations. Similarly, the error is reduced to 21% of the observed travel time when paths ranked 250 through 400 are used, and to 47% when the least significant
paths (ranked 1,410 to 1,560) are used in the consistency solution procedure. The results indicate a significant improvement in terms of average travel time errors when only the top 150 ranked paths are used.
Figs. 6(a) and 6(b) illustrate the link and path consistency measurements, respectively, for this scenario. The average error per link in terms of traffic counts is less than 4.1 for the first set, about 4.6 for the second, and about 5.0 for the third. Similarly, the average error in terms of number of users on TDPs is 4.2, 4.8 and 5.1 for the three sets, respectively. The results clearly demonstrate the hierarchical nature of the TDPs relative to enabling consistency. They suggest important paradigms for the real-time deployment of DTA for ATIS/ATMS equipped networks in terms of achieving computational feasibility and efficiency.
Scenario 2 investigates the performance in terms of enabling consistency when more paths are included, by analyzing the marginal improvement when each incremental set of paths is added to the cumulative set of paths considered. Table 3 illustrates the number of users in each path set. Each set comprises of 150 paths, except for the last one. In general, the more paths in the dominant set, the more the number of users.
Table 3
Path and Vehicle Characteristics: Stage Number =3, Number of Paths = 1560, Number of Vehicles = 4031
Path Ranking Relative to Enabling Consistency
Path Set Number
Number of Vehicles
Percentage of Vehicles in this Path Set
Path Ranking Relative to Enabling Consistency
Path Set Number
Number of Vehicles
Percentage of Vehicles in this Path Set
1 - 150 1 1014 25.16 751 – 900 6 277 6.87
Fig. 7 illustrates the percentage difference in travel times between the observed and predicted network states with cumulative increments of ordered TDPs. A significant reduction in errors is obtained when the first set of rank-ordered paths is used as they involve about 25% of the demand. Also, by the 8th iteration, all cumulative
paths sets other than the first 150 paths achieve convergence (within 6.25%). Including more paths in the consistency procedure significantly reduces the number of iterations to convergence, but increases the computational time. The total reduction in travel time errors is 11.4% when all paths in the network are used in the consistency procedure. Fig. 7 provides important insights for real-time paradigms and strategies that seek to trade-off computational efficiency and performance (in terms of consistency). As more paths are considered, the number of iterations required to achieve convergence also decreases. Thereby, when around 900 paths (58% of all paths) are considered, convergence is achieved in 4 iterations as compared to 3 iterations when all paths are considered. Also, because of the reduced number of paths, 4 iterations may take
significantly less time than 3 iterations in which all paths are considered. Hence, the path set that considers paths 1 through 900 is a superior real-time consistency strategy than the one considering all paths. This improves the computational performance for on-line deployment while maintaining similar convergence characteristics. For the same reason, paths 1-600 and 1-750 are also attractive alternatives.
Figs. 8 and 9 illustrate the link and path consistency measurements, respectively. They reiterate the insights for real-time paradigms observed in Fig. 7. The average error per link is within 4 vehicles at convergence when 300 or more paths are used in the A-CONS model. Similarly, the average error in terms of number of users on each path is within 5 users at convergence for all paths. The AHP model uses about 1 to 5 seconds of CPU time depending on the number of paths. These results indicate that use of a subset of paths in the consistency solution procedure only marginally deteriorates the system performance in terms of travel time errors and consistency measurements while substantially improving the computational efficiency.
Fig. 5.
Comparison of the Three Sets of Rank Ordered Paths Relative to Enabling Consistency, in Stage 3
Fig. 6a.
Fig. 6b.
Comparison of Path Consistency Indices for the Three Sets of Rank Ordered Paths, in Stage 3
Fig. 7.
Travel Time Errors with Cumulative Sets of Ordered Paths
Fig. 8.
Link Consistency Index with Cumulative Sets of Ordered Paths
Fig. 9.
Path Consistency Index with Cumulative Sets of Ordered Paths
5. Concluding Comments
The A HP is a widely-used approach for decision-making involving multiple criteria. In this paper, the AHP is used to prioritize the TDPs in a network for enabling on-line consistency. From an operational perspective, the AHP model forms a pre-processor for the CONS model and determines a subset of dominant paths
path flow characteristics in relation to the TDPs in the network. The relative weights are used to rank order the paths.
with paths represent parameters that can signify the relative importance of a path for enabling consistency.
The study experiments also establish the value of the hierarchical structure of TDPs in relation to the O-D demand. As illustrated in Table 3, 52% of the demand was observed on 29% of the paths. Therefore, minimizing the error between the observed and predicted states on 29% of the paths significantly improved consistency. The proposed A-CONS model can also be used in a decentralized network that lacks coordination among zones, and where the objective is to improve the local performance as opposed to the overall performance of the network.
References
Antoniou, C.; Ben-Akiva, M.; Koutsopoulos, H.N. 2007. Nonlinear kalman filtering algorithms for on-line calibration of dynamic traffic assignment models, IEEE Transactions on Intelligent Transportation Systems, 8(4): 661-670.
Arrow, K.J. 1963. Social choice and individual values. John Wiley & Sons, Inc., New York.
Balakrishna, R.; Ben-Akiva, M.; Koutsopoulos, H.N. 2007. Off-line calibration of dynamic traffic assignment: simultaneous demand-supply estimation, Transportation Research Record: Journal of the Transportation Research Board, 2003: 50-58.
Ben-Akiva, M.; Bierlaire, M.; Burton, D.; Koutsopoulos, H.N.; Mishalani, R.G. 2001. Network state estimation and prediction for real-time traffic management, Networks and Spatial Economics, 1(3): 293-318.
Doan, D.L.; Ziliaskopoulos, A.K.; Mahmassani, H.S. 1999. On-line monitoring system for real-time traffic management applications, Transportation Research Record: Journal of the Transportation Research Board, 1678: 142-149.
Harker, P.T.; Vargas, L.G. 1987. The theory of ratio scale estimation: Saaty’s analytic hierarchical process, Management Science, 33(11): 1383-1403.
Hawas, Y.E. 2002. Calibrating simulation models for advanced traveler information systems/advanced traffic management systems applications, Journal of Transportation Engineering, 128(1): 80-88.
He, R.R.; Ran, B. 2007. Calibration and validation of a dynamic traffic assignment model, Transportation Research Record: Journal of the Transportation Research Board, 1733: 56-62.
Huang, E.; Antoniou, C.; Lopes, J.; Wen, Y.; Ben-Akiva, M. 2010. Accelerated on-line calibration of dynamic traffic assignment using distributed stochastic gradient approximation. In Proceedings of the Intelligent Transportation Systems, 13th International IEEE Conference, Funchal, Portugal.
Kang, Y. 1999. Estimation and prediction of dynamic origin-destination (O-D) demand and system consistency control for real-time dynamic traffic assignment problem. Ph.D. thesis, University of Texas at Austin, Austin, TX.
Lotan, T.; Koutsopoulos, H.N. 1993. Models for route choice behavior in the presence of information using concepts from fuzzy set theory and approximate reasoning, Transportation, 20(2): 129-155.
Mirkin, B.G. 1979. Group choice. Halsted Press, New York.
Omrani, R., Kattan, L. 2012. Demand and supply calibration of dynamic traffic assignment models: past efforts and future challenge, Transportation Research Record: Journal of the Transportation Research Board, 2283: 100-112.
Peeta, S.; Anastassopoulos, I. 2002. Automatic real-time detection and correction of erroneous detector data using Fourier transforms for on-line traffic control architectures, Transportation Research Record: Journal of the Transportation Research Board, 1811: 1-11.
Peeta, S.; Bulusu, S. 1999. Generalized singular value decomposition approach for consistent on-line dynamic traffic assignment, Transportation Research Record: Journal of the Transportation Research Board, 1667: 77-87.
Peeta, S.; Mahmassani, H.S. 1995. Multiple user class real time traffic assignment for on-line operations: a rolling horizon solution framework, Transportation Research Part C: Emerging Technologies, 3(2): 83-98.
Peeta, S.; Yu, J.W. 2004. Adaptability of a hybrid route choice model to incorporating driver behavior dynamics under information provision, IEEE Transactions on Systems, Man, and Cybernetics–Part A: Systems and Humans, 34(2): 243-256.
Peeta, S.; Yu, J.W. 2005. A hybrid model for driver route choices incorporating en-route attributes and real-time information effects, Networks and Spatial Economics, 5(1): 21-40.
Peeta, S.; Yu, J.W. 2006. Behavior-based consistency-seeking models as deployment alternatives to dynamic traffic assignment models, Transportation Research Part C: Emerging Technologies, 14(2): 114-138.
Peeta, S.; Zhou, C. 2002. A hybrid deployable dynamic traffic assignment framework for robust online route guidance, Networks and Spatial Economics, 2(3): 269-294.
Pel, A.J.; Bliemer, M.C.J.; Hoogendoorn, S.P. 2009. Hybrid route choice modeling in dynamic traffic assignment, Transportation Research Record: Journal of the Transportation Research Board, 2091: 100-107.
Saaty, T.L. 1977. A scaling method for priorities in hierarchical structures, Journal of Mathematical Psychology, 15(3): 234-281.
Saaty, T.L. 1980. The Analytic Hierarchy Process. McGraw-Hill, New York.
Sen, A. 1970. Collective Choice and Social Welfare. North Holland, San Francisco, CA.
Vaze, V.; Antoniou, C.; Wen, Y.; Ben-Akiva, M. 2009. Calibration of dynamic traffic assignment models with point-to-point traffic surveillance, Transportation Research Record: Journal of the Transportation Research Board, 2090: 1-9.
Wang, H.F.; Shen, S.Y. 1989. Group decision support with MOLP applications, IEEE Transactions on Systems, Man, and Cybernetics, 19(1): 143-153.
Wendell, R.E. 1980. Multi objective mathematical programming with respect to multiple decision makers, Operations Research, 28(5): 1100-1111.
Yu, J.W.; Peeta, S. 2011. Experimental analysis of a hybrid route choice model to capture dynamic behavioral phenomena under advanced information systems, KSCE Journal of Civil Engineering, 15(1): 175-185.
Zhang, H.M.; Nie, X. 2005. Some consistency conditions for dynamic traffic assignment problems, Networks and Spatial Economics, 5(1): 71-87.
Zhou, X.S.; Mahmassani, H.S. 2002. Dynamic programming approach for online freeway f low propagation adjustment, Transportation Research Record: Journal of the Transportation Research Board, 1802: 263-270.