ROAD NETWORK ASSESSMENT IN TRANS-AMADI, PORT
HARCOURT IN NIGERIA USING GIS
Andrew Adesola Obafemi1, Olatunde Sunday Eludoyin2, Dozie Richard Opara3 1,2,3 University of Port Harcourt, Department of Geography and Environmental Management, P. O. Box
91, Port Harcourt, Nigeria
Received 12 July 2011; accepted 14 October 2011
Abstract: This study assessed the road network system of Trans-Amadi industrial layout using a Geographic Information System (GIS). Topographical map of scale 1:100000 and Google Earth, 2010 version were the sources for the acquisition of the data. A reconnaissance survey of the area was also done to assess the present situation and state of the road network. Both the topographical map and the imagery were geo-rectified in ArcGIS 9.2 and geographic data on roads and road junction were captured. Road junctions were digitized as points which are otherwise referred to as nodes while the roads as lines which are also called Arcs. Simple descriptive analysis was used to describe the road condition, pavements and types of the road network in the study. The connectivity level in the road network was determined with the use of Beta Index (BI). The road density was determined with respect to the road length per unit area. The road density was high (8.07 km-1) while the connectivity level of road network was also high (0.77). In terms of road condition, the analysis revealed that road length of 26.66 km (97.19 %) was tarred and in good condition out of 27.43 km of total road length in the study. In terms of road types, the analysis showed that the total length of dualized road type was 6.14 km (22.38 %) while 21.29 km (77.62 %) were not dualized.
Keywords: road network, connectivity, GIS, Trans-Amadi, road density.
1 Corresponding author: aandyfemi@yahoo.com
1. Introduction
Many development projects seriously depend on transport network because transportation is the factor determining the speed of growth and development of a place which can occur through roads, rails, airways, waterways pipelines, etc. (Vinod et al., 2003). Whatever the purpose of journey, mode of transport, available route to take, type of vehicle are some of the factors to be considered. Accurate information on the transport infrastructure is the fundamental requirement for many decision making processes; therefore information is required to be reliable,
walking and cycling hence, priority must be given to the maintenance and improvement of roadways, sidewalks and arterial roads. The survey also shows that the state of Nigerian roads remains poor for a number of reasons such as faulty designs, lack of drainage and very thin coatings that were easily washed away, excessive use of the road network given the under-developed nature of waterways and railways among others. The most important role of both government and individual citizen is to find a solution for managing existing roads even before new ones are constructed but managing modern roadways is a complex business especially at this time when economic growth has come close to a halt in Nigeria.
Thus, the creation, updating, maintenance and general management of road information and network in terms of spatial and non-spatial data are needed but the voluminous nature of data involved for proper record keeping is indeed cumbersome, and cannot effectively be handled by a traditional system of record keeping. The analogue system means remain inflexible resulting in data storage in fixed forms and formats; however, the system becomes less useful for many purposes and is rarely updated because of the costs implication. The maps are easily displaced or destroyed because many different people at different locations use them.
An alternative approach to maintaining a coherent database for roads in a scientific and efficient manner is therefore required and consequently, geographic information systems (GIS) will be advantageous. Hence, there will be improvements in planning, implementation and operation of the road sector through provision of timely, reliable, sufficiently and accurately detailed data which will facilitate the decision making activities. Uluocha (1998) notes that if the noble objective of mapping
for proper utility design and maintenance is to be satisfactorily achieved, the more sophisticated computer-based Automated Mapping/Facility Management (AM\FM) or a Geographic Information System (GIS) must be embraced. According to Miller and Shaw (2001), Geographic Information System for transportation (GIS-T) can play a central role in the new environment for public land-use and transportation decision-making by allowing a wide-range of information to be integrated based on the location and fostering (but certainly not securing) a holistic perspective on complex land-use and transportation problems. Miller and Shaw (2001) explain further that GIS-T allows analytical and computational tools to be used in conjunction with detailed representations of the local geography, allowing analysis and problem-solving to be tailored to the local context. GIS-T can also greatly reduce the gulf between analysis and communication, allowing greater public input into analytical decisions such as the choice of data, modeling assumptions and scenario development. This study therefore assessed the road types, conditions; and also measures the road density and road connectivity level in the study area with optimal use of GIS. The reason being that proper network mapping of a region can efficiently reduce traffic congestion and/ or bottlenecks, create easy access to places that are far and near, reduce transportation time and increase accessibility of industries to their targeted customers. In addition, proper analysis and mapping of road network cannot be underestimated because this serves as a key to economic development in terms of per-capita income and expenditure of the community.
2. The Study Area
the heart of Port-Harcourt with latitudinal extent between 4⁰ 47’ N and 4o 48’ N and
longitudinal extent between 7o 1’E and 7o 2’E.
It is the main industrial area of Port-Harcourt densely populated with buildings of many national and trans-national firms with very few residential areas. The study area enjoys tropical hot monsoon climate due to its latitudinal position. The tropical monsoon climate is characterized by heavy rainfall from April to October ranging from 2000 mm to 2500 mm with high temperature throughout the year and a relatively constant high humidity. The study area is influenced by urbanization or urban sprawl whereby smaller communities have merged together and form a megacity. This is due to high influx of people resulting in a rapid growth of the population in the study area. This in turn is largely due to the expansion of the oil and allied industries which have also attracted many varied manufacturing industries. The relief is generally lowland which has an average elevation of between 20 m and 30 m above sea level. The geology of the area is basically comprised of alluvial sedimentary basin and basement complex. The vegetation found in this area includes raffia palms, thick mangrove forest and light rain forest. The soil is usually sandy or sandy loam underlain by a layer of impervious pan and is always leached due to the heavy rainfall experienced in this area. The study area is well drenched with both fresh and salt water. The salt water is caused by the intrusion of sea water inland, thereby making the water slightly salty. Due to continuous heavy rainfall and river flow, the study area experiences severe flooding almost every year and the effects are extended to biological resources hence the city was chosen as the study area.
3. Methodology
This study made use of secondary data derived from a topographical map of scale 1:100000
obtained from Rivers State Ministry of Lands and Housing whereby roads of the study area were digitized. The satellite imagery of the study area was also obtained from 2010 Google Earth in order to update the existing road networks. The topographical map and the imagery were geo-rectified in ArcGIS 9.2 to geographic co-ordinates whereby the ground control points were used. In ArcGIS 9.2, the boundary and roads were digitized in polygon and polyline respectively. The road junctions were also digitized as points. The area of the boundary was calculated in square kilometers and the length of each road was determined in kilometers. All designed attributes of roads were given and these attributes include road condition, the length of the road and road type (dual or single carriage). GIS spatial analyses were carried out using spatial query whereby the fields like road condition and road types were investigated and converted to a thematic map. The total length in kilometers and the area in square kilometers were calculated in ArcGIS 9.2 for the purposes of the further analysis carried out in this study. The road density was determined and this is defined as the road length per unit area. The formula used to calculate this is (Eq. (1)):
Road density = Total Road Length (RL)/Area. (1)
Beta index of connectivity developed by Kansky (1963) and adopted by Vinod et al. (2003). Beta index (BI) for connectivity is a simple measure of connectivity which can be derived from the formula (Eq. (2)):
BI=Arc/Nodes (2)
where the nodes are the number of road junctions and arcs are connections (straight lines) between the nodes as straight lines. Beta Index ranges from 0.0 for network which consists of nodes without any arc through 1.0 and greater where networks are well connected (Vinod et al., 2003). The beta index analysis helped to decide the connectivity level of the roads. The results are presented in tables, charts and maps.
4. Results and Discussion
4.1. Description of the Current State of
the Roads in the Study Area, Types and
Condition of Road Networks
From the GIS analysis, Table 1 explains the total length of the road that is tarred and untarred in the study area. The table reveals the condition of the road whether good or bad at the time the observation was made on these roads. The table reveals that the road length of 26.66 km was tarred out of 27.43 km total road length which represents 97.19 % of total road length. This analysis showed the road condition to be good because of the greater parts of the roads that were tarred. It is also shows the types of road in the study area whereby the proportion of dualized road type was compared with undualized road type. The analysis revealed that the total length of dualized road type was 6.14 km (22.38 %) while 21.29 km (77.62 %) of total length of 27.43 km were not dualized.
Table 1
Condition of Roads
Condition Total Length (Km) Percentage (%)
Good 26.66 97.19
Bad 0.77 2.81
Total 27.43 100
Type Total Length (Km) Percentage (%)
Dualized 6.14 22.38
Not-Dualized 21.29 77.62
Total 27.43 100
Source: Author’s Analysis, 2010
4.2. Determination of the Road Density
of the Study Area
The road density of the study area is calculated by relating the total density to the total area. This is represented mathematically as Eq. (2), that is:
27.43 km/ 3.40 sq km= 8.07 km-1
This analysis showed that the road density was high comparing it with the standard as highlighted in (Odaga and Heneveld, 2009). This can be seen in the road network of the study area whereby the roads were evenly distributed.
4.3. The Road Connectivity Level
The connectivity level of the road network in Trans-Amadi was determined by a connectivity index through a Beta Index. Beta index is a measure to determine the level of connectivity in road networks (Eq. (3)).
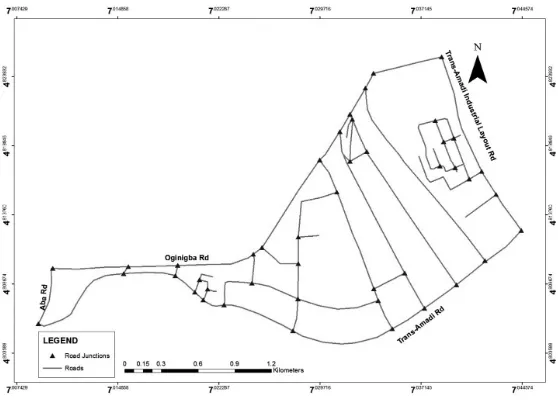
In the case of this study, Arcs = 34, Nodes=44 (See Fig. 3).
Fig. 1.
The Imagery of the Study Area Showing the Boundary Source: Google Earth, 2010
Fig. 2.
The Map Showing the Road Network of the Study Area
The result from the beta index shows that the connectivity of the road network is high in the study area. This could be correlated with the road density which was also high in the study area. The high connectivity can be attributed to the construction of bridges due to the industrial development that the area has been subjected to over time. The study of Vinod et al. (2003) reveals low connectivity with beta index analysis in Kasaragod Taluk road network. This was attributed to the hindrance caused by the streams which made the roads to run parallel to the drainage. The findings also showed that the road network in Trans-Amadi Industrial Layout was an organized network which was evenly distributed in the area. The road condition was generally good and this can be directly attributed to the nature of pavement of the roads whereby over 90 % of the total road length was tarred. This allowed high mobility of goods and services in the area
suggesting that free and easy movement of goods and services was well supported. Wahle et al. (2001) explain that modern western societies are characterized by high mobility meeting the growing demands of industries around the area because the connections between the industries and the customers demanding their goods are maintained. Beckmann (2004) asserts that the road network in many western countries is very dense and it is continuously developing in order to meet the growing demands of the industries while Holl (2004) cited in Beckmann (2004) is of the opinion that a good infrastructure is needed for the connection of markets. In addition, the rate of the development in the study area is discovered to be growing and this may be attributed to the high road density in the area. It is corroborated (Amiegbebor, 2007) that road transport network contributes to the economy of an area as it connects
Fig. 3.
points of origin to destinations. Though the study of Amiegbebor (2007) reveals that the entire Port Harcourt Metropolis is poorly connected and not compact it reaches the conclusion that development in terms of road network is being witnessed in Trans Amadi. This could be due to the positive influence of “Greater Port Harcourt City (GPHC)” plan put in place recently to build a well planned city through the implementation and enforcement of policies that will ensure the provision of first rate infrastructure and delivery of quality services to enhance standard of living and well being of people in Port Harcourt and its environs (Cookey-Gam, 2010).
5. Conclusion and Recommendations
The efficiency of a GIS is clearly evident in this study in terms of road network analysis. The technique was used to assess the road network system in Trans-Amadi Industrial Layout in terms of the present condition of the road, pavement, road type and its connectivity. Therefore, it can be concluded that road network of the study area is in good condition and the connectivity level is still high. Thus the following recommendations are made:
1. The government is encouraged to embrace keeping and managing of spatial data with the use of a GIS.
2. There should be regular maintenance of these roads in the study area and the small area that is bad should be repaired to reach the standard of a 100 % good road network.
3. There is a need for training and re-training programmes among the government staff on a GIS.
4. The international body with its vast strength and power should encourage the developing countries to establish a GIS in different areas of human endeavour through adequate funding.
5. This study can be carried out on a larger scale and other attributes like the drainage system, vehicular movement, impedance analysis, least route cost should be studied among other things.
References
Amiegbebor, D. 2007. Road Transport Network Analysis in Port Harcourt Metropolis, Journal of Research in National Development 5(1): 42-50.
Beckmann, A. 2004. Road Conflicts in National Parks placed in Densely populated and highly cultivated Areas, and Ways to reconcile Them. Unpublished Masters Dissertation: Department of Environment, Technology and Social Studies (TEKSAM), Rosklide University, Rosklide. 110 p.
Cookey-Gam, D. A. 2010. An Overview of the Greater Port Harcourt City Master Plan and Opportunities in Building a World Class City over the next 20 years. Available from internet: <http://gphcity.com/media/ publications/>.
Fiatornu, S. Y. 2006. GIS a Tool for Transportation Infrastructure Planning in Ghana, A Case Study to the Department of Feeder Roads, in Proceedings of the 5th FIG
Regional Conference, 1-14.
Holl, A. 2004. Manufacturing Location and Impacts of Road Transport Infrastructure: Empirical Evidence from Spain,
Regional Science and Urban Economics 34(3): 341-363.
Kansky, K. 1963. Structure of Transportation Network: Relationships between Network Geometry and Regional
Characteristics, Research Paper 84. Chicago: University of
Miller, H. J.; Shaw, S. L. 2001. Geographic Information Systems
for Transportation: Principles and Applications. New York:
Oxford University Press. 470 p.
National Transport Policy for Nigeria. 2003. DraftDocument,
Transport Sector Reform Committee Bureau of Public Enterprises.
Abuja: FG of Nigeria. 54 p.
Odaga, A.; Heneveld, W. 1995. Girls and Schools in Sub Saharan Africa: From Analysis to Action. Washington D.C.: World Bank. 4p.
Uluocha, N. O. 1998. Mapping for Utility Management in Nigeria in Cartography and Challenges of the 21st Century in Nigeria, 183-192.
Vinod, R. V.; Sukumar, B.; Sukumar, A. 2003. Transport Network Analysis of Kasaragod Taluk, Kerala Using GIS,
Indian Cartographer 23: 1-9.
Wahle, J.; Annen O.; Schuster C.; Neubert L.; Schreckenberg, M. 2001. A Dynamic Route Guidance System based on Real Traffic Data, European Journal of Operational Research 131(2): 302-308.
PROCENA PUTNE MREŽE PRIMENOM
GIS-A U TRANS-AMADIJU, PORT
HARKURTU U NIGERIJI
Andrew Adesola Obafemi, Olatunde Sunday Eludoyin, Dozie Richard Opara Sažetak: U ovoj studiji izvršena je procena sistema putne mreže u industrijskoj oblasti Trans-Amadi primenom geografskog informacionog sistema (GIS). Za prikupljanje podataka korišćena je topografska karta razmere 1:100000 i Google Earth, 2010. Takođe je sprovedeno istraživanje ove oblasti kako bi se izvršila procena trenutne situacije i stanja putne mreže. Topografska karta i snimci su geo-rektifikovani u ArcGIS 9.2, dok su geografski podaci o putevima i raskrsnicama zabeleženi. Raskrsnice su digitalizovane kao tačke odnosno čvorovi, a saobraćajnice kao linije odnosno lukovi. U ovoj studiji je u opisu stanja puteva, kolovoza i tipova putne mreže primenjena jednostavna deskriptivna analiza. Stepen povezanosti unutar mreže puteva utvrđen je uz pomoć Beta indeksa (BI). Gustina puteva utvrđena je u odnosu na dužinu puteva po jedinici površine. Dobijeni rezultati pokazuju da je gustina puteva velika (8.07 km-1), kao i stepen povezanosti mreže puteva (0.77). Kada je reč o stanju kolovoza, analiza je pokazala da je 26.66 km (97.19 %) kolovoza asfaltirano i u dobrom stanju u odnosu na 27.43 km ukupne dužine puteva u ovoj studiji. Kada je reč o tipovima kolovoza, analiza je pokazala da je ukupna dužina puteva sa dve trake 6.14 km (22.38 %) dok 21.29 km (77.62 %) iznose putevi bez dve trake.