Iran J Public Health, Vol. 48, No.8, Aug 2019, pp.1503-1511
Original Article
Anthropometric Estimations for Iranian General Population
*Mahnaz SAREMI
1,2, Mahnaz KAZEMHAGHIGHI
21. Workplace Health Promotion Research Center, Shahid Beheshti University of Medical Sciences, Tehran, Iran 2. Department of Ergonomics, School of Public Health and Safety, Shahid Beheshti University of Medical Sciences, Tehran, Iran
*Corresponding Author: Email: m.saremi@sbmu.ac.ir
(Received 23 Jan 2018; accepted 12 Apr 2018)
Introduction
The main principle of ergonomics is to design the activity to match the characteristics of the user. On the other word, if an instrument, a workplace or a system is intended for human use, then its design should be based upon the characteristics of its human users. This principle, so-called “us-er-centered design”, could result in many en-hancements in terms of functional efficiency, comfort, health, safety and quality of life (1). In contrast, the lack of incorporating anthropomet-ric information in the design phase would result in an increase in the frequency of work-related injuries, as well as a decrease in human perfor-mance and well-being.
However, human beings are not all the same. Their anthropometric (e.g. body size, shape strength, and endurance), physiological,
Biome-chanical and psychological characteristics differ from one to another. In addition, factors such as age, sex, race, job, diet, physical exercise and so on influence human body dimensions (1, 2). These variabilities need to be taken into account by designers in order to provide adequate adjust-ability of workstations, tools, products and hu-man-machine interfaces.
Because of the above mentioned human inter and intra-individual changes, the majority of de-veloped and developing countries have produced their own anthropometric databank. Some exam-ples include anthropometric data of Asian (3, 4), African (5, 6), European (7, 8) and American (9, 10) peoples. However, although publication of the first systematic anthropometric tables dated on 1950s, no anthropometric survey has yet been
Abstract
Background: An essential requirement exists for a single exhaustive source of anthropometric databank in Iran. Available information about Iranian bodily dimensions is not applicable to the general population due to the sample of people investigated. This study aimed to present the first Iranian anthropometric databank by estima-tion.
Methods: After a systematic review, 24 relevant sources of information were found and included. No time limit was considered. The method of Rapid Anthropometrics Scaled for Height was used.
Results: Overall, 36 bodily dimensions were estimated, for which the seven percentiles of 1st, 5th, 25th, 50th, 75th,
95th, and 99th were calculated, stratified by sex.
Conclusion: The resulting tables can be claimed as the most representative anthropometric databank for Iranian general 20-64 yr population now. Data are suitable for practical purpose and are applicable in both occupational and community setting.
conducted on Iranian general population with regard to the occupational health application. Available data on this topic is mainly limited to Iranian industrial (11) and army (12) personnel which would not be presentative for the general population. Apart from its vital importance for designing various work stations and spaces, na-tional anthropometric tables are required to fab-ricate any ease of use urban spaces such as public buildings, leisure facilities, general transportation services, and so on.
Since anthropometric surveys are often costly and time-consuming, ergonomists prefer to pre-pare anthropometric databases based on more simple methods such as estimation rather than measurement. One of the most widely employed methods of estimation is that proposed by Barkla (13) and Roebuck et al. (14). Entitled “Rapid An-thropometrics Scaled for Height” (RASH) by Pheasant, this method was validated and em-ployed to estimate British anthropometric data-base (15, 16). The RASH method requires only data on the stature (i.e. mean and standard devia-tion) of an unknown population to which scaling factors derived from a known homogeneous population is applied. The technique was used in some similar researches afterward all over the world (17, 18).
An important need for appropriate anthropomet-ric source on Iranian body characteristics exists among national ergonomists and designers. Re-cently, existed anthropometric data for Iranian population is not sufficiently comprehensive with respect to both sample size and representative-ness (19). Therefore, the present study is the first attempt to provide a single comprehensive and representative source of anthropometric infor-mation on Iranian general population. Such data-bank is extensively applicable as a key element to provide ergonomic design requirements and to create products, hand tools, furniture, work-stations, etc. as much fit as possible to the nation. In this regard, after an integrated review of relat-ed publishrelat-ed literature, a dataset is assemblrelat-ed us-ing the RASH method assumed to be sufficiently exhaustive and accurate for practical purpose;
especially in terms of the creation of spaces in various public or industrial environments.
Materials and Methods
The method of RASH was applied for estimating anthropometric database of Iranian general popu-lation. This method is based on the assumption that although people vary greatly in size, they are likely to be similar in proportions (2). It requires only know the mean (m) and standard deviation (s) of stature of an unknown population (i.e. tar-get population). Scaling factors for intended bodily dimensions would be calculated from a known population (i.e. reference population) and then applied to the height data in the target one. Coefficient em was calculated using following
formula (15): em=x̅h̅
Where x̅ is the mean value of the intended bodily dimension and h̅ is the mean stature in the refer-ence population.
Then, scaling ratio (Em) was obtained as
arithme-tic mean of em (15, 16): Em=∑emn
The same method was used for estimating coeffi-cients (es) and scaling ratios (Es) related to the
standard deviations. Calculations were made as a function of sex.
The reference population
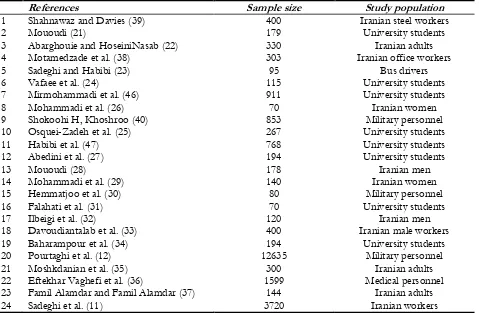
Conducting a systematic review using Google Scholar, Medline, SID, IranMedex, Magiran, MedLib and Civilica, an integrative collection of ever published anthropometric datasets of Irani-an adults was developed. No time limit was con-sidered. This collection was considered as the reference population. Studies were included as a function of their aim and methodology. There-fore, cases hypothesized any relationship between body variables (e.g. weight, BMI, wrist circumfer-ences, etc.) and health problems (obesity, diseas-es, etc.) or conducted on children were excluded. Repeated datasets (i.e. same data published in more than one source) were also removed. As presented in Table 1, altogether 24 sources of information were found.
Table 1: The reference population
References Sample size Study population
1 Shahnawaz and Davies (39) 400 Iranian steel workers
2 Mououdi (21) 179 University students
3 Abarghouie and HoseiniNasab (22) 330 Iranian adults
4 Motamedzade et al. (38) 303 Iranian office workers
5 Sadeghi and Habibi (23) 95 Bus drivers
6 Vafaee et al. (24) 115 University students
7 Mirmohammadi et al. (46) 911 University students
8 Mohammadi et al. (26) 70 Iranian women
9 Shokoohi H, Khoshroo (40) 853 Military personnel
10 Osquei-Zadeh et al. (25) 267 University students
11 Habibi et al. (47) 768 University students
12 Abedini et al. (27) 194 University students
13 Mououdi (28) 178 Iranian men
14 Mohammadi et al. (29) 140 Iranian women
15 Hemmatjoo et al. (30) 80 Military personnel
16 Falahati et al. (31) 70 University students
17 Ilbeigi et al. (32) 120 Iranian men
18 Davoudiantalab et al. (33) 400 Iranian male workers
19 Baharampour et al. (34) 194 University students
20 Pourtaghi et al. (12) 12635 Military personnel
21 Moshkdanian et al. (35) 300 Iranian adults
22 Eftekhar Vaghefi et al. (36) 1599 Medical personnel
23 Famil Alamdar and Famil Alamdar (37) 144 Iranian adults
24 Sadeghi et al. (11) 3720 Iranian workers
The target population
For the target population, we have selected re-cent nationwide surveillance on non-communicable disease risk factors, which in our knowledge is the best representative of the gen-eral population in terms of sample size, age, sex, socio-economic, and geographical distribution. Using a random multistage cluster sampling method, the study measured, among other varia-bles, stature of 79,611 Iranian rural and urban citizens (50.1% men; 49.9% women) aged from 20 to 64 yr with standardized and calibrated in-struments (20).
Results
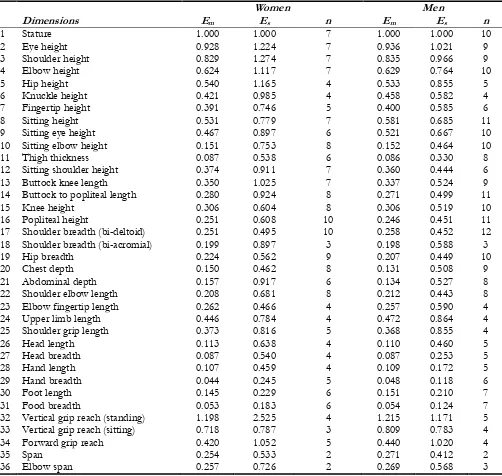
Scaling factors for 36 anthropometric estimations are presented in Table 2. Accordingly, stature has the highest ratios with eye and shoulders heights; and the smallest ratios with hand and foot
breadths. Indeed, body dimensions of men and women are likely to follow a similar scaling pro-file (Table 2).
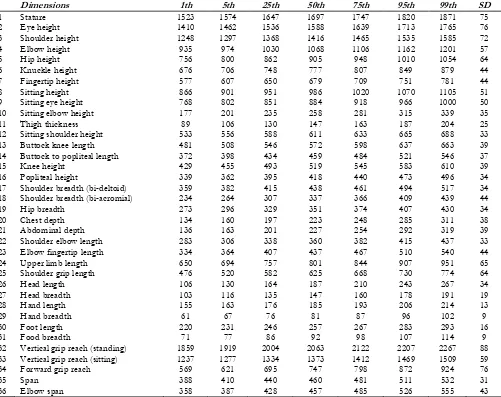
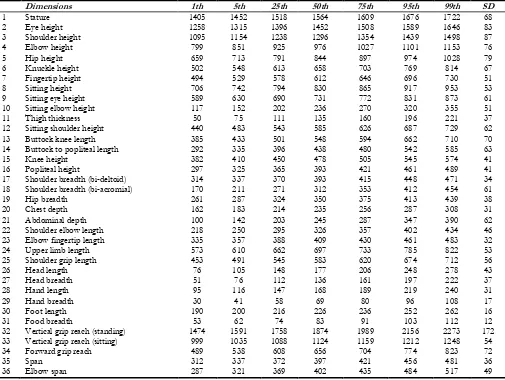
Tables 3 and 4 show anthropometric estimates calculated based on these scaling factors for men and women, respectively. Iranian men’s average height is estimated to be 1697 mm versus 1564 mm for female. The tallest Iranian man is about 348 mm taller than the shortest one; while the tallest Iranian woman is about 317 mm taller than the shortest woman is.
Discussion
valid method of RASH, this study was able to present the first single source of anthropometric information for Iranian general population. It is therefore not illogical to claim that the present set of estimations is the most valid representation of the anthropometrics of the Iranian general
20-64 yr people achieved now. The pioneer in using this method was Pheasant, who developed an anthropometric source for British civilian adults based on a combination of the main previously published datasets (15).
Table 2: Scaling ratios for mean (Em) and standard deviation (Es) of 36 bodily dimensions
Women Men
Dimensions Em Es n Em Es n
1 Stature 1.000 1.000 7 1.000 1.000 10
2 Eye height 0.928 1.224 7 0.936 1.021 9
3 Shoulder height 0.829 1.274 7 0.835 0.966 9
4 Elbow height 0.624 1.117 7 0.629 0.764 10
5 Hip height 0.540 1.165 4 0.533 0.855 5
6 Knuckle height 0.421 0.985 4 0.458 0.582 4
7 Fingertip height 0.391 0.746 5 0.400 0.585 6
8 Sitting height 0.531 0.779 7 0.581 0.685 11
9 Sitting eye height 0.467 0.897 6 0.521 0.667 10
10 Sitting elbow height 0.151 0.753 8 0.152 0.464 10
11 Thigh thickness 0.087 0.538 6 0.086 0.330 8
12 Sitting shoulder height 0.374 0.911 7 0.360 0.444 6
13 Buttock knee length 0.350 1.025 7 0.337 0.524 9
14 Buttock to popliteal length 0.280 0.924 8 0.271 0.499 11
15 Knee height 0.306 0.604 8 0.306 0.519 10
16 Popliteal height 0.251 0.608 10 0.246 0.451 11
17 Shoulder breadth (bi-deltoid) 0.251 0.495 10 0.258 0.452 12
18 Shoulder breadth (bi-acromial) 0.199 0.897 3 0.198 0.588 3
19 Hip breadth 0.224 0.562 9 0.207 0.449 10
20 Chest depth 0.150 0.462 8 0.131 0.508 9
21 Abdominal depth 0.157 0.917 6 0.134 0.527 8
22 Shoulder elbow length 0.208 0.681 8 0.212 0.443 8
23 Elbow fingertip length 0.262 0.466 4 0.257 0.590 4
24 Upper limb length 0.446 0.784 4 0.472 0.864 4
25 Shoulder grip length 0.373 0.816 5 0.368 0.855 4
26 Head length 0.113 0.638 4 0.110 0.460 5
27 Head breadth 0.087 0.540 4 0.087 0.253 5
28 Hand length 0.107 0.459 4 0.109 0.172 5
29 Hand breadth 0.044 0.245 5 0.048 0.118 6
30 Foot length 0.145 0.229 6 0.151 0.210 7
31 Food breadth 0.053 0.183 6 0.054 0.124 7
32 Vertical grip reach (standing) 1.198 2.525 4 1.215 1.171 5
33 Vertical grip reach (sitting) 0.718 0.787 3 0.809 0.783 4
34 Forward grip reach 0.420 1.052 5 0.440 1.020 4
35 Span 0.254 0.533 2 0.271 0.412 2
36 Elbow span 0.257 0.726 2 0.269 0.568 3
Table 3: Anthropometric estimates for Iranian male adults (all dimensions in mm)
Dimensions 1th 5th 25th 50th 75th 95th 99th SD
1 Stature 1523 1574 1647 1697 1747 1820 1871 75
2 Eye height 1410 1462 1536 1588 1639 1713 1765 76
3 Shoulder height 1248 1297 1368 1416 1465 1535 1585 72
4 Elbow height 935 974 1030 1068 1106 1162 1201 57
5 Hip height 756 800 862 905 948 1010 1054 64
6 Knuckle height 676 706 748 777 807 849 879 44
7 Fingertip height 577 607 650 679 709 751 781 44
8 Sitting height 866 901 951 986 1020 1070 1105 51
9 Sitting eye height 768 802 851 884 918 966 1000 50
10 Sitting elbow height 177 201 235 258 281 315 339 35
11 Thigh thickness 89 106 130 147 163 187 204 25
12 Sitting shoulder height 533 556 588 611 633 665 688 33
13 Buttock knee length 481 508 546 572 598 637 663 39
14 Buttock to popliteal length 372 398 434 459 484 521 546 37
15 Knee height 429 455 493 519 545 583 610 39
16 Popliteal height 339 362 395 418 440 473 496 34
17 Shoulder breadth (bi-deltoid) 359 382 415 438 461 494 517 34
18 Shoulder breadth (bi-acromial) 234 264 307 337 366 409 439 44
19 Hip breadth 273 296 329 351 374 407 430 34
20 Chest depth 134 160 197 223 248 285 311 38
21 Abdominal depth 136 163 201 227 254 292 319 39
22 Shoulder elbow length 283 306 338 360 382 415 437 33
23 Elbow fingertip length 334 364 407 437 467 510 540 44
24 Upper limb length 650 694 757 801 844 907 951 65
25 Shoulder grip length 476 520 582 625 668 730 774 64
26 Head length 106 130 164 187 210 243 267 34
27 Head breadth 103 116 135 147 160 178 191 19
28 Hand length 155 163 176 185 193 206 214 13
29 Hand breadth 61 67 76 81 87 96 102 9
30 Foot length 220 231 246 257 267 283 293 16
31 Food breadth 71 77 86 92 98 107 114 9
32 Vertical grip reach (standing) 1859 1919 2004 2063 2122 2207 2267 88 33 Vertical grip reach (sitting) 1237 1277 1334 1373 1412 1469 1509 59
34 Forward grip reach 569 621 695 747 798 872 924 76
35 Span 388 410 440 460 481 511 532 31
36 Elbow span 358 387 428 457 485 526 555 43
For being representative, a sample should be an unbiased indication of the intended population. In the case of previously reported Iranian an-thropometric datasets, one of the limitations face to the representativeness of data is that the sam-ple size for about 80% of them is under 500 (21-39). Moreover, being conducted on the specified groups of industrial (11, 33, 39) or army (12, 30, 40) employees or in a specified location (32, 35), not across Iran, is the fact supporting the inaccu-racy of using previous datasets for the general population. Anthropometric dimensions signifi-cantly differ between various occupational groups (41). Incorrect design of workplaces and
Table 4: Anthropometric estimates for Iranian female adults (all dimensions in mm)
Dimensions 1th 5th 25th 50th 75th 95th 99th SD
1 Stature 1405 1452 1518 1564 1609 1676 1722 68
2 Eye height 1258 1315 1396 1452 1508 1589 1646 83
3 Shoulder height 1095 1154 1238 1296 1354 1439 1498 87
4 Elbow height 799 851 925 976 1027 1101 1153 76
5 Hip height 659 713 791 844 897 974 1028 79
6 Knuckle height 502 548 613 658 703 769 814 67
7 Fingertip height 494 529 578 612 646 696 730 51
8 Sitting height 706 742 794 830 865 917 953 53
9 Sitting eye height 589 630 690 731 772 831 873 61
10 Sitting elbow height 117 152 202 236 270 320 355 51
11 Thigh thickness 50 75 111 135 160 196 221 37
12 Sitting shoulder height 440 483 543 585 626 687 729 62
13 Buttock knee length 385 433 501 548 594 662 710 70
14 Buttock to popliteal length 292 335 396 438 480 542 585 63
15 Knee height 382 410 450 478 505 545 574 41
16 Popliteal height 297 325 365 393 421 461 489 41
17 Shoulder breadth (bi-deltoid) 314 337 370 393 415 448 471 34
18 Shoulder breadth (bi-acromial) 170 211 271 312 353 412 454 61
19 Hip breadth 261 287 324 350 375 413 439 38
20 Chest depth 162 183 214 235 256 287 308 31
21 Abdominal depth 100 142 203 245 287 347 390 62
22 Shoulder elbow length 218 250 295 326 357 402 434 46
23 Elbow fingertip length 335 357 388 409 430 461 483 32
24 Upper limb length 573 610 662 697 733 785 822 53
25 Shoulder grip length 453 491 545 583 620 674 712 56
26 Head length 76 105 148 177 206 248 278 43
27 Head breadth 51 76 112 136 161 197 222 37
28 Hand length 95 116 147 168 189 219 240 31
29 Hand breadth 30 41 58 69 80 96 108 17
30 Foot length 190 200 216 226 236 252 262 16
31 Food breadth 53 62 74 83 91 103 112 12
32 Vertical grip reach (standing) 1474 1591 1758 1874 1989 2156 2273 172
33 Vertical grip reach (sitting) 999 1035 1088 1124 1159 1212 1248 54
34 Forward grip reach 489 538 608 656 704 774 823 72
35 Span 312 337 372 397 421 456 481 36
36 Elbow span 287 321 369 402 435 484 517 49
Some key anthropometric dimensions are “knee height”, “sitting height” and “arms reach” (1). A good anthropometric database should also be up-to-date. This feature is essential since human body characteristics vary over time and from generation to another. Our proposed set of esti-mations has the potential of being rapidly updat-ed as soon as a more recent source of Iranian height would be available. Indeed, these data could be easily repeated for any sub-group of the general population.
Errors associated with using this technique are small and would be considered as negligible, even in comparison with common interpretation er-rors or those arising from the corrections for shoes and cloths (16). However, one could
sug-gest that this method is much better applicable to body dimensions which best depend on the length of bones than circumferential dimensions. If relevant, this may be considered as a limitation of this study.
Conclusion
as a more accurate evaluation of all products, ma-chinery and spaces, either national or imported international ones, is expected. By means of inte-grating the presented tables into design phase, we hope national designers to provide greater safety, satisfaction and commonwealth for Iranian citi-zens.
Acknowledgements
This work was part of an MSc thesis by the sec-ond author at Shahid Beheshti University of Medical Sciences, Tehran, Iran (Grant number: 6692).
Ethical considerations
Ethical issues (Including plagiarism, informed consent, misconduct, data fabrication and/or fal-sification, double publication and/or submission, redundancy, etc.) have been completely observed by the authors.
Conflict of interest
The authors declare that there is no conflict of interests.
References
1. Pheasant S, Haslegrave CM (2016). Bodyspace: Anthropometry, ergonomics and the design of work. ed. CRC Press.
2. Bridger RS (2003). Introduction to ergonomics. 2nd ed. ed. Taylor & Francis, London ; New York.
3. Chuan TK, Hartono M, Kumar N (2010). Anthropometry of the Singaporean and Indonesian populations. International Journal of Industrial Ergonomics, 40:757-766.
4. Fernandez JE, Uppugonduri KG (1992). Anthropometry of South Indian industrial workmen. Ergonomics, 35:1393-1398.
5. Mokdad M (2002). Anthropometric study of Algerian farmers. International Journal of Industrial Ergonomics, 29:331-341.
6. Steyn K, Bourne L, Jooste P, Fourie J, Rossouw K, Lombard C (1998). Anthropometric profile of a black population of the Cape Peninsula in South Africa, East Afr Med J. 75:35-40.
7. Bolstad G, Benum B, Rokne A (2001). Anthropometry of Norwegian light industry and office workers. Appl Ergon, 32:239-246. 8. Hertzberg HTE (1963). Anthropometric Survey of
Turkey, Greece and Italy. ed. Macmillan.
9. McDowell MA, Fryar CD, Hirsch R, Ogden CL (2005). Anthropometric reference data for children and adults: US population, 1999– 2002. Adv Data,(361):1-5.
10. Fryar CD, Gu Q, Ogden CL (2012). Anthropometric reference data for children and adults: United States, 2007-2010. Vital Health Stat 11. (252):1-48.
11. Sadeghi F, Mazloumi A, Kazemi Z (2015). An anthropometric data bank for the Iranian working population with ethnic diversity. Appl Ergon. 48:95-103.
12. Pourtaghi G, Valipour F, Sadeghialavi H, Lahmi M (2014). Anthropometric characteristics of Iranian military personnel and their changes over recent years. Int J Occup Environ Med. 5:115-24.
13. Barkla D (1961). The estimation of body measurements of British population in relation to seat design. Ergonomics, 4:123-132. 14. Roebuck JA, Kroemer KHE, Thomson WG
(1975). Engineering anthropometry methods. ed. John Wiley & Sons.
15. Pheasant S (1982). Anthropometric estimates for British civilian adults. Ergonomics, 25:993-1001. 16. Pheasant S (1982). A technique for estimating anthropometric data from the parameters of the distribution of stature. Ergonomics, 25:981-92.
17. Ali İ, Arslan N (2009). Estimated anthropometric measurements of Turkish adults and effects of age and geographical regions. International Journal of Industrial Ergonomics, 39:860-865.
19. Kazemhaghighi M, Saremi M. The situation of anthropometric databank in Iran: a review study. Iran Occupational Health, 14:95-102-95. 20. Ahranjani SA, Kashani H, Forouzanfar M et al
(2012). Waist circumference, weight, and body mass index of iranians based on national non-communicable disease risk factors surveillance. Iran J Public Health. 41:35-45. 21. Mououdi MA (1997). Static anthropometric
charactristics of Tehran University students age 20-30. Appl Ergon, 28:149-150.
22. Abarghouie NS, HoseiniNasab H (2008). Static anthropometry in Iran. First International Conference on Ergonomics.
23. Sadeghi N, Habibi E (2009). The survey of relation between musculoskeletal disorders and anthropometric indices in the bus drivers in Isfahan. Iran Occupational Health, 6(1):6-14. 24. Vafaee B, Zaree F, Nikpey A, Varmazyar S,
Safaryvaryani A (2011). Review the Proportion of university seats with body dimensions of students at the School of Public Health of Qazvin University of Medical Sciences in 1388. Iran Occupational Health, 8:39-47.
25. Osquei-Zadeh R, Ghamari J, Abedi M, Shiri H (2012). Ergonomic and anthropometric consideration for library furniture in an Iranian public university. Int J Occup Environ Med, 3:19-26.
26. Mohammadi M, Sadeghi H, Sadeghi-Naieni H, Nikbakht H (2011). The relationship between ergonomics characteristics park oval bike with anthropometric indices Iranian women. The Sixth National Conference on Physical Education and Sport Sciences students of Iran.
27. Abedini R, Choobineh AR, Soltanzadeh A et al (2012). Static Anthropometric Dimensions and Regression Equations among Student Population. Health System Research, 8(4):613-623.
28. Mououdi MA (2013). The determination of static anthropometry characteristics for designing and evaluating the comfort of saddle chair. Iran Occupational Health, 9(4):24-29.
29. Mohammadi M, Sadeghi H, Sadeghi Naeini H et al (2012). The ergonomic properties of outdoor fitness equipment with respect to the anthropometric characteristic of Iranian women: a case study chest press machine and
pull chairs. European Journal of Experimental Biology, 2:2077-2082.
30. Hemmatjoo Y, Ebrahimi MH, Mohammadi A, Roshani M (2012). Anthropometric assessment of military personnel of the Ministry of Defence industry in the city of Tabriz and compare it with non-military personnel in the studied city and Iran country. Journal of Medical Sciences the Army of Islamic republic of iran, Proceedings of the Second National Conference of preventive medicine, health, relief and treatment of surface and subsurface sea.
31. Falahati M, Zokaei M, Sadeghi Naeini H, Moradi GR (2013). Determination of variables and anthropometric indicators for classroom chair design (Study group: Tehran University medicine science–2011). Iran Occupational Health, 10:99-108.
32. Ilbeigi S, Ebrahimi-Sadr M, Afzalpour MA (2013). Survey The Ergonomic Properties of Outdoor Fitness Equipment with Anthropometric Characteristics of men. Journal of Research in Rehabilitation Sports, 1:37-27.
33. Davoudiantalab AH, Meshkani M, Nourian S, Mofidi AA (2013). Anthropometric Dimensions of Iranian Male Workers and Comparison with Three Asian Countries. International Journal of Occupational Hygiene, 5:166-171
34. Baharampour S, Nazari J, Dianat I, Asgharijafarabadi M (2013). Student's Body Dimensions in Relation to Classroom Furniture. Health Promot Perspect. 3:165-174. 35. Moshkdanian G, Moghani-Ghoroghi F, Shiasi M
et al (2014). Anthropometric characteristics of upper limb in Iranian and Pakistani subjects. Journal of Gorgan University of Medical Sciences, 16:80-85.
36. Eftekhar Vaghefi SH, Elyasi L, Amirian SR, Eftekhar Vaghefi S (2013). Anthropometric Survey of Worker Population in Bandar-Abbas. Thrita, 3:e11669.
38. Motamedzade M, HassanBeigi MR, Choobineh AR, Mahjoob H (2009 ). Design and Development of An Ergonomic Chair for Iranian Office Workers. ZUMS journal, 17:45-52.
39. Shahnawaz H, Davies B (1977). Anthropometric study of Iranian steel workers. Ergonomics, 20:651-658.
40. Shokoohi H, Khoshroo MR (2011). Fitness Measurement of the Combat Troops to Prevent the Skleton and Muscular Disorders due to Inappropriate Design of the Military Equipments. JAUMS, 9:177-172.
41. Del Prado-Lu JL (2007). Anthropometric measurement of Filipino manufacturing workers. International Journal of Industrial Ergonomics, 37:497-503.
42. Ghaffari M, Alipour A, Jensen I, Farshad AA, Vingard E (2006). Low back pain among Iranian industrial workers. Occup Med (Lond). 56:455-460.
43. Saremi M, Khayati F (2015). Evaluation of incidence of low back pain and its
relationship with ergonomic risk level of wards among nurses. Journal of Modern Rehabilitation, 9:68-77.
44. Parno A, Poursadeghiyan M, Omidi L, Parno M, Sayehmiri K, Sayehmiri F (2016). The Prevalence of Work-Related Musculos keletal Disorders in the upper Extremity: A SystematicReview and Meta-Analysis. Safety Promotion and Injury Prevention, 4:9-18.
45. Mozafari A, Vahedian M, Mohebi S, Najafi M (2015). Work-Related Musculoskeletal Disorders in Truck Drivers and Official Workers. Acta Med Iran. 53:432-438.
46. Mirmohammadi SJ, Mehrparvar AH, Jafari S, Mostaghaci M (2011). An assessment of the anthropometric data of Iranian university students. International Journal of Occupational Hygiene, 3:85-89.