R E S E A R C H
Open Access
Catastrophic health expenditure and
impoverishment in Mongolia
Javkhlanbayar Dorjdagva
1,2*, Enkhjargal Batbaatar
1, Mikael Svensson
3, Bayarsaikhan Dorjsuren
4and Jussi Kauhanen
2Abstract
Background:The social health insurance coverage is relatively high in Mongolia; however, escalation of out-of-pocket payments for health care, which reached 41 % of the total health expenditure in 2011, is a policy concern. The aim of this study is to analyse the incidence of catastrophic health expenditures and to measure the rate of impoverishment from health care payments under the social health insurance scheme in Mongolia.
Methods:We used the data from the Household Socio-Economic Survey 2012, conducted by the National
Statistical Office of Mongolia. Catastrophic health expenditures are defined an excess of out-of-pocket payments for health care at the various thresholds for household total expenditure (capacity to pay). For an estimate of the impoverishment effect, the national and The Wold Bank poverty lines are used.
Results:About 5.5 % of total households suffered from catastrophic health expenditures, when the threshold is 10 % of the total household expenditure. At the threshold of 40 % of capacity to pay, 1.1 % of the total household incurred catastrophic health expenditures. About 20,000 people were forced into poverty due to paying for health care.
Conclusions:Despite the high coverage of social health insurance, a significant proportion of the population incurred catastrophic health expenditures and was forced into poverty due to out-of-pocket payments for health care.
Keywords:Catastrophic health expenditure, Impoverishment, Financial protection, Mongolia
Background
Ensuring financial protection for the population against the cost of ill-health is one of the fundamental objectives of the health system [1]. It has been estimated that approximately 100 million people worldwide are forced into poverty, and around 150 million people face cata-strophic expenditure as a consequence of high out-of-pocket (OOP) payments for health care each year [2]. Additionally, a large number of people abstain from util-izing health care resources due to the financial costs.
The literature has shown that a higher proportion of OOP payments of health expenditure is related to a higher percentage of households that suffer from
catastrophic health expenditures and are forced into pov-erty [3, 4]. The World Health Report 2010 proposed a strategy to improve or modify country-specific health financing systems so as to achieve universal health cover-age (UHC), which aims to ensure that everyone has access to comprehensive and health services of acceptable quality without incurring financial hardship [2]. Furthermore, UHC has become one of the overarching health targets of the Sustainable Development Goals by 2030, approved by the UN General Assembly in September 2015 [5].
As in many other countries, health financing reforms in Mongolia are guided by the concept of UHC. Before 1990, Mongolia had a centralised health system where the government was wholly responsible for both health service delivery and financing. It provided access to uni-versal“free” health care (i.e. no patient cost-sharing) [6]. However, during the socio-economic transition from a centrally planned to a market-oriented economy that started in 1990, health financing reforms aimed to
* Correspondence:javkhlanbayar.d@gmail.com
1Department of Health Policy and Management, School of Public Health, Mongolian National University of Medical Sciences, Zorig Street, Ulaanbaatar 14210, Mongolia
2Institute of Public Health and Clinical Nutrition, Faculty of Health Sciences, University of Eastern Finland, Kuopio, Finland
Full list of author information is available at the end of the article
expand funding sources beyond the government budget [7]. This policy change encouraged household contribu-tion to health financing through user fee and co-payment initiatives. At the same time, reforming the health care financing system with user fees/co-payments needed a strategy and evidence-based actions where available, so as to preclude people from incurring financial difficulties due to the introduction of co-payments.
In 1994, the government of Mongolia successfully in-troduced a new social health insurance system (SHI) [8, 9] . The main purpose of SHI introduction and im-plementation was not only to promote equitable access to health care through prepayment, i.e. reducing nega-tive effects of user fee policies, but also to provide financial protection for the population from excessive financial hardships, especially for low income and vulnerable population groups [7, 9]. This policy focus is still valid, and remains as an issue of priority in Mongolia’s medium- and long-term health and SHI development policies [6, 9–12].
Currently, SHI is one of the main sources of health financing along with the government health budget. As of 2014, almost the entire population is covered by SHI and entitled to the same health service benefits regard-less of their socio-economic characteristics [9].
According to the health insurance law, the insur-ance premium for employees in public and private sectors is 4 % of their monthly salaries, which is shared equally between the employer and employee The premium for children under 18 years and students is equal to 1 % of the national minimum wage per month. For all other groups, the premium rate is 2 % of the national minimum wage. It is worth mentioning that the premiums for some vulnerable and specific groups, including children younger than age 18, pensioners, mothers caring for new-born chil-dren up to the age of two, military personnel and people on low incomes are fully subsidized by the government [12].
The benefit package offered by SHI includes major inpatient services at both secondary and tertiary level hospitals with a patient cost-sharing at around 10 to 15 % and a limited number of outpatient ser-vices [8, 13]. In addition, SHI covers 50 to 100 % of the cost of essential medicines prescribed by family physicians and medical doctors working at the pri-mary level of health centres [8]. The Government health budget funds primary health care services pro-vided through family health centres and soum (district) health centres; and some specific services including treat-ment of chronic and infectious diseases provided at sec-ondary and tertiary level hospitals [8, 13].
In the past, several efforts have been made to assess
the effect of direct out-of-pocket payments on
household income and expenditure. The World Bank report, based on the Mongolian Household Socio-Economic Survey (HSES) 2007/2008, stated that the incidence of catastrophic health expenditure was 3.3 %, when the threshold was set at health expendi-tures at 40 % or more of non-food expenditure. It also reported that the rate of impoverishment due to out-of-pocket payments was 2.5 % [14]. These results indicated that the incidence of catastrophic health ex-penditure and impoverishment is smaller in Mongolia compared to some other developing countries [14].
Other studies found that the poverty rate in Mongolia has decreased from 35.2 to 27.4 % (between 2008 and 2012) [15, 16]. In the same period, SHI coverage increased from 83.2 to 98.6 % [17, 18]. Des-pite these positive trends, our previous studies showed that the degree of income-related inequalities in health care utilization increased between 2008 and 2012 [19]. In addition, the poor tended to use pri-mary health care rather than secondary or tertiary hospital care, although they had a lower health status and greater needs [19], i.e. high-income groups re-ported significantly better health [20]. In contrast, high-income groups were more likely to bypass pri-mary health care and directly choose more costly health services at the higher levels of hospitals or in the private sector [19]. A referral system has been built into the health sector; nonetheless, gatekeeping at primary health care is weak and unnecessary self-referral to the upper level hospitals is common [18].
Another emerging fact is that the share of OOP payments in the total health expenditure reached 41 % in 2011 [9]. As the international evidence indi-cates, when OOP payments exceed 20 % of total health expenditure, it is difficult to reach UHC, and a country may need to improve financial protection policies [3, 21].
Based on these grounds, this paper aims to contribute to policy discussions by estimating the incidence of cata-strophic health expenditure and the rate of impoverish-ment with the latest available household income and expenditure survey data, and to analyse the overall trends and effects of SHI on financial protection in Mongolia. The paper also intends to promote uniform measurement and regular monitoring of household catastrophic health expenditure and impoverishment in Mongolia as part of national efforts to reform health financing in order to achieve UHC.
Methods Data
HSES is a nationally representative and annually conducted survey intended to “evaluate and monitor the income and expenditure of households, update the basket and weights for consumer price index, and inputs to the national accounts” [16]. The survey has three levels of strata, including Ulaanbaatar (the cap-ital city), aimag (provincial) centres and soum (dis-trict) centres, and the countryside [16]. The survey used a standard questionnaire which consisted of a wide range of questions on household income, ex-penditure, consumption as well as health care pay-ments. A total of 12,811 households are included in the survey. The detailed household characteristics were described in the HSES 2012 report [16].
Measuring catastrophic health expenditure
Catastrophic health expenditure occurs if OOP
payments for health care exceed a particular threshold of a household’s resources: income, expenditure or consumption [22, 23].
However, it is well known that there is a limitation in using total household expenditure as an indicator for household resources, considering that low-income households may have low OOP for health care due to the fact that the vast majority of resources are spent on food and basic survival. Thus, if households are not able to meet catastrophic health payments, we may underestimate the burden of OOP payments for health care. A partial solution is to estimate cata-strophic health expenditure if health care costs ex-ceeds the chosen threshold of household non-food expenditure [23]. Household non-food expenditures is also known as “non-discretionary expenditure” [22] or “capacity to pay” [24]. It is measured as the difference between total household expenditure and household food expenditure. Hereafter, we use the term “capacity to pay”, and in this paper we use both “total house-hold expenditure” and “capacity to pay” as living standard indicators.
Ifxis the total household expenditure,nf(x) is capacity to pay,T is OOP payments for health care,z is a given threshold, and thus a household incurs catastrophic health expenditure ifT/x, orT/nf(x), exceeds z [23].
In the literature commonly used threshold values (z) are 10 % for total household expenditure and 40 % for capacity to pay [23]. However, in this paper we also use additional thresholds in order to investigate potential consequences and robustness in the interpretations of the results.
Measuring incidence and intensity of catastrophic payments
The incidence (H) of catastrophic payments can be expressed by head count. It is obtained by the
proportion of households that incurred catastrophic pay-ments and is estimated by the formula below [23].
H¼N1X N
i¼1
Ei ð1Þ
where N is the sample size. E is an indicator such that
Ei= 1 ifTxii >z, and otherwise zero.
The head count cannot capture the magnitude by which household OOP payments exceed the given threshold. While, the catastrophic payments overshoot,
O, denotes the average extent to which health payments exceeds the chosen threshold for households that in-curred catastrophic expenditures. The household over-shoot is estimated as follows [23]:
Oi¼Ei Txi i −z
ð2Þ
Then, the average of the overshoot is simply written as:
O¼N1XN i¼1
Oi ð3Þ
Briefly, H refers to the incidence of catastrophic payments, whereas O is the intensity of catastrophic payments. Both measures, H and O, are insensitive to the distribution of catastrophic payments. It is evident that the consequences of catastrophic health expendi-tures for rich and poor are different. We used concentration indices, CE and CO, for Ei and Oi, re-spectively, to measure the distribution of catastrophic payments in relation to household expenditures. The concentration indices fall between -1 and +1. Posi-tive/negative CE indicates the better-off/worse-off are more likely to exceed the chosen threshold. Analo-gously, the overshoot is concentrated among the rich/ poor if CO is positive/negative.
The weighted head count and overshoot measures can easily be estimated as follows [22]:
Hw¼H⋅ 1−Ce
ð Þ ð4Þ
Ow¼O⋅ 1−C o
ð Þ ð5Þ
The weighted head count and overshoot measures show the impact of OOP when different weights are given to households depending on expenditure level [23]. The households with the lowest expenditures are weighted by 2, and the households with the highest ex-penditures are weighted by 0, and the weight decreases with higher household expenditures.
All of the measures in terms of capacity to pay were estimated as the replacement of total household expend-iture,xi, by capacity to pay,nf(xi), in the above indicated equations.
Health care payments and poverty
A high OOP payment for health care may push house-holds into poverty. In practice, a number of people who are forced into poverty by the need to pay for health services are not included in the national poverty meas-urement as poor households.
Impoverishment effect of OOP payments for health care can be obtained by the difference between a poverty level with the gross of OOP payments (before health care payments) and a poverty level with the net of OOP payments (after health care payments). First, we esti-mated the gross of the health payments poverty ratio
(HPgross). This gives the percentage of the population
liv-ing below the poverty line before health payments [23];
HPgross¼ XN
i¼1sip gross i XN
i¼1si
ð6Þ
where pigross is equal to 1 if the per capita total expend-iture of household (yi) is less than the poverty line and otherwise 0. si denotes the household size and N indi-cates the number of households in the sample.
The next measure is a gross of health payments individual-level poverty gap, which is estimated as follows:
ggrossi ¼pgrossi ðPL−yiÞ ð7Þ
PL refers the poverty line. Based on the equation 7, the mean of poverty gap is simply found as:
Ggross ¼ XN
i¼1sig gross i XN
i¼1si
ð8Þ
The net of health payments head count can be esti-mated by replacing pigross with pinet in the equation 6. Where pinet is equal to 1 if the per capita total expend-iture of the household is less than the poverty line and The net of the health payments poverty gap is esti-mated as the replacement of ggrossi by ginet in the equa-tion 8 with ginet=pinet(PL−yi).
A normalized poverty gap, which enables us to make international comparisons across countries with different poverty lines and currency units, is estimated as follows:
NGgross
=Ggross/PL Poverty line
In order to estimate the above-mentioned poverty mea-sures, a poverty line should be set. We used the
Mongolian national poverty line, which was 118,668 Mongolian tugrik (MNT) per month ($ 201.02 PPP in 2011) in 2012 as defined by the NSO [16]. This poverty line was estimated based on the cost of minimum food requirements per person (2100 calories a day) plus some non-food expenditures.
Second, for international comparisons we also used the $1.90 (PPP in 2011) per day per person poverty line defined by the World Bank for international compari-sons. After adjustment of poverty parity exchange, this poverty line is equal to 34,769.6 MNT per month in 2012 price [25].
Results
Distribution of OOP
The distributions of health service utilization by ex-penditure quintiles are shown in Table 1. There were 4062 (29.8 %) households that reported that at least one member of the household was hospitalized during the previous year and 15.6 % of the households used outpatient services at least once in the past month. Re-sults showed that the richer used both outpatient and inpatient health services significantly more than did the poor. The urban households reported more outpatient use (p< 0.01) than the rural ones. There is no statisti-cally significant difference (p> 0.05) between inpatient use in the urban and rural areas.
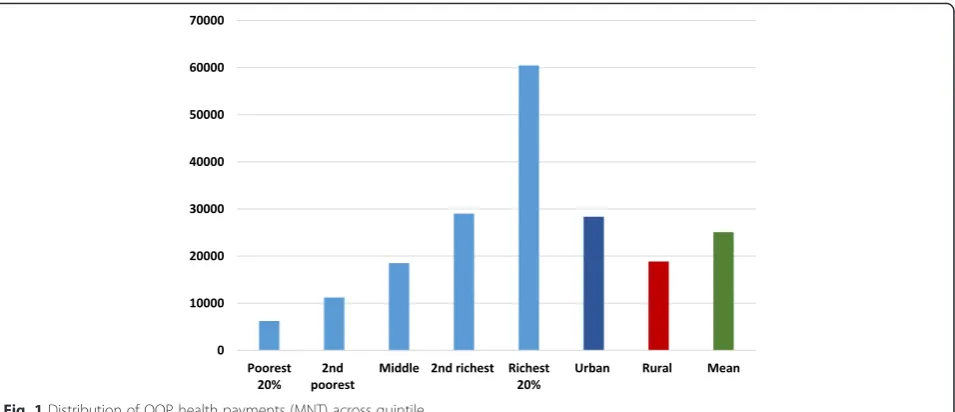
The distribution of OOP health payments (MNT) across quintiles is shown in Fig. 1. The mean OOP pay-ments among the total households was 25,086.5 MNT. The results indicate that the amount of OOP health pay-ments increases with the quintile increase, e.g. the OOP health payments among the richest 20% households were almost 10 times higher compared to the poorest 20% households. In addition, the level of OOP payments in the rural areas was significantly smaller than that in the urban areas.
Table 1Distribution of health service utilization by expenditure quintile
Outpatient (N= 2097) Inpatient (N= 4062)
All 15.6 % 29.6 %
Quintile
1 11.2 % P< 0.01 23.2 % P< 0.01
2 13.9 % 26.8 %
3 16.9 % 30.3 %
4 16.9 % 32.2 %
5 19.2 % 35.6 %
Urban 17.0 % P< 0.01 29.8 % P= 0.07
Catastrophic health expenditures
The measures of the incidence of catastrophic payments for health care in Mongolia are shown in Table 2. We estimated catastrophic payments as a share of the total household expenditure and capacity to pay, based on several threshold budget shares.
The incidence of catastrophic head count can be explained as follows. When the threshold is 5 % of the total expenditure, 12.1 % of Mongolian households in-curred catastrophic payments for health care. When we increase the threshold, the incidence falls. For instance, 1.2 % of Mongolian households spends in excess of 25 % of the total expenditure on health care. Similarly, as the threshold is raised from 15 to 40 % of capacity to pay, the incidence of catastrophic head count drops from 7 to 1.1 %.
Table 2 provides information on the rank-weighted head counts and concentration index for Ei. The re-sults showed that the rank-weighted head counts are smaller than the unweighted head ratio at all levels of thresholds, regardless of whether catastrophic pay-ments is defined by the total expenditure or capacity to pay. It indicates that the better-off are more likely to incur catastrophic payments for health. This was confirmed by positive concentration indices for the incidence of catastrophic payments at all thresholds.
Table 3 shows OOP health payments in excess of cata-strophic payments threshold budget share.
Probably the incidence of catastrophic head count, the mean overshoot, falls from 0.99 to 0.16 % as the thresh-old rises from 5 to 25 %. In the last row of Table 3, the mean positive overshoot (MPO) is provided. It can be read as those spending more than 15 % of the total cap-acity to pay on health care payments, who on average spent 28.68 % (15 + 13.68 %). Those spending more than 40 % of capacity to pay on health care payments on aver-age spent 55.05 %. On the other hand, the mean over-shoot among those exceeding the threshold need is raised as the threshold increases.
Health care payments and poverty
Poverty measures corresponding to household expendi-tures both before and after health payments are shown in Table 4. As mentioned before, we used two poverty lines in this study, the Mongolian national poverty line (118,668 MNT) and the World Bank poverty line ($1.90 per day). At the Mongolian national poverty line, the poverty head count is 22.26 %, i.e. 22.26 % of the Mon-golian population is estimated to be in poverty using household expenditures as a living standard indicator. After accounting for OOP health care payments, a 0.78 % rise in the poverty head count was observed. This Fig. 1Distribution of OOP health payments (MNT) across quintile
Table 2Percentage of households incurring catastrophic payments for health care in Mongolia, 2012
Out-of-pocket health spending as a share of total expenditure As a share of non-food expenditure
Threshold 5 % 10 % 15 % 25 % 15 % 25 % 40 %
Head count 12.1 % 5.5 % 3.3 % 1.2 % 7.0 % 3.4 % 1.1 %
Concentration index, CE 0.03 0.09 0.17 0.32 0.00 0.08 0.29
result can be interpreted such that over twenty thousand people in Mongolia are forced into poverty due to OOP health care payments. The poverty gap, the average def-icit to reach the poverty line in the population, also rises from 6953.57 MNT to 7284.22 MNT. The normalized poverty gap increased from 5.86 to 6.14 %; however, a slight rise in the normalized mean positive gap was found (26.33 to 26.64 %).
Using the World Bank poverty line ($1.90 per day), we found that both the poverty head count and poverty gap were much smaller than the results using the Mongolian national poverty line, which is as expected, given that the Mongolian national poverty line is much higher than the World Bank absolute poverty line.
Conclusion and discussion
Measuring and monitoring OOP impact is critical for countries aiming at UHC. Since there is an increasing OOP concern, this study using the most recent data pro-vides new evidence on catastrophic health expenditure and its impoverishment effect in. In the past, Mongolia made efforts to estimate OOP impacts by using different methodologies and thresholds, which made it difficult to compare and follow-up policy reforms. Some studies es-timate the impoverishment effects of health care pay-ments at the individual level using ADePT software, and some do it at the household level [14, 26]. The method-ology used in the current study is described in the World Bank guidelines which are more relevant to health financing reforms aimed at improving financial protection [23].
In this study, we estimated the rate of catastrophic health expenditure and impoverishment due to the OOP payments for health care using the HSES 2012. The study reveals several interesting points.
First, 5.5 % of total households suffered from cata-strophic health expenditures based on an OOP threshold at 10 % of total household expenditure. At the threshold of 40 % of capacity to pay, 1.1 % of the total household incurred catastrophic health expenditures.
Bredenkamp et al. analysed the incidence of cata-strophic health expenditure in Mongolia using the total household consumption as the living standard indicator based on the HSES 2007/2008 data [14]. They found that the incidence of catastrophic health expenditure was 10 and 3.3 % at the threshold of 10 % of the total household expenditure and 40 % of capacity to pay. Considering the different choices of the living standard indicator between the studies, we cannot make a direct comparison between the results. However, it is worth mentioning that the government of Mongolia provided a one-time subsidy to the uninsured groups from the Hu-man Development Fund (a special stabilization fund from mining revenue) in 2011 [6]
Consequently, between 2008 and 2012 the SHI cover-age increased from 83.2 to 98.1 %. This implied that spe-cifically among the poor and vulnerable groups, financial protection was extended.
Second, to our knowledge, this study provides the first evidence of intensity of catastrophic health payments in Mongolia. Intensity of catastrophic health payments was relatively low, for instance, it was 0.58 % (0.17 %) at the
Table 3OOP health payments in excess of catastrophic payments threshold budget share in Mongolia, 2012
Out-of-pocket health spending as a share of total expenditure As a share of non-food expenditure
Threshold 5 % 10 % 15 % 25 % 15 % 25 % 40 %
Mean overshoot 0.99 % 0.58 % 0.37 % 0.16 % 0.96 % 0.47 % 0.17 %
Concentration index, CO 0.17 0.25 0.33 0.46 0.14 0.24 0.39
Rank-weighted overshoot, OW 0.95 % 0.53 % 0.31 % 0.11 % 0.96 % 0.43 % 0.12 %
Mean positive overshoot 8.13 % 10.61 % 11.32 % 12.97 % 13.68 % 14.07 % 15.05 %
Table 4Measures of poverty based on expenditure gross and net of spending on health care, Mongolia 2012 The national poverty line 118, 668 MNT per month The WB poverty line 1.90 US (PPP) per day
Gross of health payments
Net of health payments
Absolute Relative Gross of health payments
Net of health payments
Absolute Relative
Poverty head count 22.26 % 23.04 % 0.78 % 3.51 % 0.22 % 0.25 % 0.03 % 15.21 %
Poverty gap (MNT) 6953.57 7284.22 330.65 4.76 % 16.56 20.13 3.57 21.55 %
Normalized poverty gap 5.86 % 6.14 % 0.28 % 4.76 % 0.05 % 0.06 % 0.01 % 21.57 %
Normalized mean positive gap
threshold of 10 % (40 %) of total household expenditure (capacity to pay).
Third, the result demonstrates that the richer households (or households with a higher capacity to pay) are more likely to incur catastrophic health pay-ments. Similar results were reported in the World Bank’s study in Mongolia as well as in other develop-ing countries [4, 14].
This pattern is likely to be a reflection of the health system structure in the country. The ADB (2008) re-ported that the health system has a risk to become a dual system in where the poor use public facilities and the rich use private facilities [27].
In a previous study, we found that the poor and low-income groups were more likely to use primary health care, regardless of their health needs, which in general are greater than in higher income groups [19, 20]. This may be explained by the fact that primary health care is free of charge and more easily accessible than other upper level hospitals. Today, nearly the entire population has SHI coverage regardless of their socio-economic characteristics; however, the low-income groups are sub-stantially less likely to access specialized health care ser-vices at the higher referral levels due to both direct costs, including co-payments, medicines, consultations, and indirect costs, such as for transport and meals.
Primary health care centre have a gatekeeping role in the health sector. In practice, the gatekeeping is weak and cannot control self-referrals to the upper level hos-pital admissions [6]. In addition, the SHI covers a larger part of inpatient services at the upper level hospitals where the proportion of unnecessary admission is high. These factors lead to higher OOP payments for households.
For instance, in order to obtain inpatient services, the insured person has to pay 10 and 15 % co-payment for inpatient services at secondary and tertiary level hospitals. Moreover, a majority of the in-patients get meals from their home daily. About 40 % of the inpatients buy drugs and injections themselves during their hospitalization [28]. The HSES 2009 re-ported that 71 % of household OOP payments tend to be made for medications, which were bought from private pharmacies [6, 15].
Fourth, we found that the poverty head count before accounting for OOP payments was 22.26 %, which is lower that the NSO’s estimation (27.4 %) [16]. It can be explained by a choice of living standard indicator. After accounting for OOP for health care from household ex-penditures, the poverty rate increased by 0.78 percentage points (relative change is 3.51 %). This indicates that about 20,000 people were forced into poverty due to paying for health services based on the Mongolian na-tional poverty line. A similar previous study was
conducted by the World Bank team using the HSES 2007/2008, reported that OOP for health payments in-creased the poverty head count by 2.5 % and that its relative change was 7 % [14]. In general, this impoverish-ment effect of OOP payimpoverish-ments for health expenditures is lower compared to other developing countries, specific-ally those countries where prepaid health financing mechanisms is less developed [4, 22, 29, 30].
In accordance with the findings of the study, we emphasize some potential policy implications. First, in spite of the developments of financial protection policies and a high SHI coverage, the country still has barriers to reaching UHC. Our results suggest that intensity and in-cidence of catastrophic health expenditure is relatively low; however, the OOP share of total health expendi-tures is still 41 %. International and regional evidence showed that the higher share of OOP expenses, in par-ticular above 20 %, of total health expenditures in coun-tries, the more people suffer from catastrophic health expenditure [3, 21]. Additionally, the current way to re-port the catastrophic health expenditure and impover-ishment effect is ad-hoc and is insufficient to support and sustain UHC. Hence, monitoring progress towards UHC in Mongolia requires more frequent studies.
Second, the results also demonstrate that rich house-holds are more likely suffer from catastrophic payments. In general, they tend to bypass primary health care ser-vices and seek more expensive upper health care serser-vices with self-referral, regardless of their health needs [19]. In this scenario, direct and indirect costs are usually much higher for users owing to the current weak gatekeeping system.
Hence, a more effective referral system may be benefi-cial, including stronger gatekeeping, at the primary health care level of the health sector. It would not only reduce households’ risk of incurring catastrophic OOP payments for health expenditures, but it would also lead the health sector to better efficiency. For instance, the WHO concluded that primary health care is essential for better health outcomes of those health care systems, in which primary health care plays a main role in i) provid-ing balanced preventive and promotive services regard-ing the social determinants, and ii) a referral service to higher level of hospitals [31].
which was a political promise during the parliament election. Hence, keeping the current high SHI cover-age is a vital issue for the future financial protection of the poor and workers in the informal sector.
Importantly, a recent study showed that high SHI coverage alone (breadth) cannot lead to UHC and im-prove financial protection in the country [9]. There is a need of policy actions to improve other dimensions of UHC, including health service coverage (depth) and cost coverage (height).
Additionally, it is known that people sell their apartments or borrow money from others in order to afford some specific and expensive health care ser-vices regardless of the SHI coverage in the country. In this case, intensity of catastrophic health expend-iture and impoverishment is much deeper among cer-tain specific groups. Thus, we emphasize that the HSES questionnaire should be extended with ques-tions which focus on how people make health care payments, for example, from either savings or by loan, etc. Further studies aiming to acquire this infor-mation will provide more specific policy messages to the decision makers.
Finally, we should note the limitations of this study. The study did not address the distribution or struc-ture of catastrophic health expendistruc-tures and its pov-erty effect. It may call for further studies in this field. In addition, it is a cross-sectional study, thus unable to make a causal analysis.
Abbreviations
ADB, Asian Development Bank; HSES, Mongolian Household Socio-Economic Survey; MNT, Mongolian tugrik; NSO, National Statistical Office of Mongolia; OOP, out-of-pocket payment; SHI, social health insurance; UHC, Universal Health Coverage; UN, United Nations; WHO, World Health Organization
Acknowledgements
The data used in this paper are the Mongolian Household Socio-Economic Survey, collected by the National Statistical Office of Mongolia. Javkhlanbayar Dorjdagva received the UEF Doctoral School Scholarship.
Funding
Not applicable
Availability of data and material
Not applicable
Authors’contributions
JD designed the study and carried out the statistical analysis. JD and EB critically contributed to the interpretation of results and drafted the manuscripts. MS, BD and JK participated in a critical revision of the manuscript. All authors read and approved the final manuscript.
Competing interests
The authors declare that they have no competing interests.
Consent for publication
Not applicable
Ethics approval and consent to participate
Not applicable
Author details
1Department of Health Policy and Management, School of Public Health, Mongolian National University of Medical Sciences, Zorig Street, Ulaanbaatar 14210, Mongolia.2Institute of Public Health and Clinical Nutrition, Faculty of Health Sciences, University of Eastern Finland, Kuopio, Finland.3Health Metrics Unit, the Sahlgrenska Academy, University of Gothenburg, Gothenburg, Sweden.4Department of Health Systems Governance and Financing, WHO, Geneva, Switzerland.
Received: 4 April 2016 Accepted: 4 July 2016
References
1. WHO. The world health report 2000–Health systems: improving performance. 2000.
2. WHO. World Health report 2010: Health systems financing: the path to universal coverage. 2010.
3. Xu K, Saksena P, Jowett M, Indikadahena C, Kutzin J, Evans DB. Exploring the thresholds of health expenditure for protection against financial risk. 2010. 4. van Doorslaer E, O’Donnell O, Rannan-Eliya RP, Somanathan A, Adhikari SR, Garg CC, et al. Catastrophic payments for health care in Asia. Health Econ. 2007;16(11):1159–84.
5. Sustainable Development Goals. Available at: [http://www.un.org/pga/wp- content/uploads/sites/3/2015/08/120815_outcome-document-of-Summit-for-adoption-of-the-post-2015-development-agenda.pdf]
6. Bolormaa T, Natsagdorj T, Tumurbat B, Bujin T, Bulganchimeg B, Soyoltuya B, et al. Health Systems in Transition Mongolia: Health System Review. European Observatory on Health Systems and Policies: Copenhagen; 2007.
7. Dorjsuren B, Soonman K, Aviva R. Development of social health insurance in Mongolia: Success, challenges and lessons. Int Soc Secur Rev. 2005;58(4):27–44. 8. Dashzeveg C, Mathauer I, Enkhee E, Dorjsuren B, Tsilaajav T, Batbayar C. A
health financing review of Mongolia with a focus on social health insurance. 2011.
9. Bayarsaikhan D, Kwon S, Chimeddagva D. Social health insurance development in Mongolia: Opportunities and challenges in moving towards Universal Health Coverage. Int Soc Secur Rev. 2015;68(4):93–113.
10. MOH and JICWELS. Health sector strategic master plan 2006–2015. Ulaanbaatar: MOH; 2005.
11. The Government of Mongolia: The national strategy on health financing for 2010–2014. Ulaanbaatar. 2010.
12. Law on Social Health Insurance. Available at http://www.legalinfo.mn/law/ details/10922.
13. MOH. Health indicators 2011. Ulaanbaatar: Center for Health Development; 2012. 14. Bredenkamp C, Buisman LR, Prencipe LM, Somanathan A, Tsilaajav T, Wagstaff
A. Mongolia - Health equity and financial protection report. Health equity and financial protection report. Washington, DC: World Bank Group; 2012. 15. NSO. Household Socio-Economic Survey 2007/2008. Ulaanbaatar: NSO; 2009. 16. NSO. Household Socio-Economic Survey 2012. Ulaanbaatar: NSO; 2013. 17. MOH. Health Indicators - 2009. Ulaanbaatar: Center for Health Development;
2010.
18. Tsilaajav T, Ser-Od E, Baasai B, Byambaa G, Shagdarsuren O. Mongolia Health System Review. Health Systems in Transition. Geneva: World Health Organization Regional Office for the Western Pacific; 2013. 19. Dorjdagva J, Batbaatar E, Dorjsuren B, Kauhanen J. Income-related
inequalities in health care utilization in Mongolia, 2007/2008-2012. Int J Equity Health. 2015;14:57.
20. Dorjdagva J, Batbaatar E, Dorjsuren B, Kauhanen J. Explaining differences in education-related inequalities in health between urban and rural areas in Mongolia. Int J Equity Health. 2015;14(1):154. -015-0281-9.
21. WHO. Health financing strategy for the Asia Pacific region (2010–2015). Manila and New Delhi: WHO Regional Office for the Western Pacific and WHO Regional Office for South-East Asia; 2009.
22. Wagstaff A, van Doorslaer E. Catastrophe and impoverishment in paying for health care: with applications to Vietnam 1993-1998. Health Econ. 2003; 12(11):921–34.
23. O’Donnell O, van Doorslaer E, Wagstaff A, Lindelow M. Analyzing health equity using household survey data: a guide to techniques and their implementation. Washington, DC: World Bank Group; 2007.
25. World Development Indicators: Poverty rates at international poverty lines [http://wdi.worldbank.org/table/2.8]
26. Macroeconomics and Health N. Policy brief. http://meh.mn/health/project-studies-health/implemented-project-health/49-policy-brief.html. Accessed 9 Mar 2016.
27. ADB. Mongolia: Health and Social Protection; 2008. Available at http://www. oecd.org/countries/mongolia/42227662.pdf.
28. Nanzad O, Namjil T, Tsilaajav TS, Byambaa M, Dondonkhuu O,
Daramragchaa A, et al. Hospital services costing survey at aimag and district health facilities. Ulaanbaatar: Ministry of Health; 2011.
29. Kwesiga B, Zikusooka CM, Ataguba JE. Assessing catastrophic and impoverishing effects of health care payments in Uganda. BMC Health Serv Res. 2015;15:30.
30. Chuma J, Maina T. Catastrophic health care spending and impoverishment in Kenya. BMC Health Serv Res. 2012;12:413.
31. WHO. Closing the Gap: Health Equity through action on the social determinants of health, World Health Organization. Geneva: World Health Organization; 2008.
• We accept pre-submission inquiries
• Our selector tool helps you to find the most relevant journal
• We provide round the clock customer support
• Convenient online submission
• Thorough peer review
• Inclusion in PubMed and all major indexing services
• Maximum visibility for your research
Submit your manuscript at www.biomedcentral.com/submit