R E S E A R C H
Open Access
Evaluation of two implementation strategies in 51
child county public service systems in two states:
results of a cluster randomized head-to-head
implementation trial
C Hendricks Brown
1*, Patricia Chamberlain
2, Lisa Saldana
2, Courtenay Padgett
2, Wei Wang
3and Gracelyn Cruden
1Abstract
Background:Much is to be learned about what implementation strategies are the most beneficial to communities attempting to adopt evidence-based practices. This paper presents outcomes from a randomized implementation trial of Multidimensional Treatment Foster Care (MTFC) in child public service systems in California and Ohio, including child welfare, juvenile justice, and mental health.
Methods:Fifty-one counties were assigned randomly to one of two different implementation strategies (Community Development Teams (CDT) or independent county implementation strategy (IND)) across four cohorts after being matched on county characteristics. We compared these two strategies on implementation process, quality, and milestone achievements using the Stages of Implementation Completion (SIC) (Implement Sci 6(1):1–8, 2011). Results:A composite score for each county, combining the final implementation stage attained, the number of families served, and quality of implementation, was used as the primary outcome. No significant difference between CDT and IND was found for the composite measure. Additional analyses showed that there was no evidence that CDT increased the proportion of counties that started-up programs (i.e., placed at least one family in MTFC). For counties that did implement MTFC, those in the CDT condition served over twice as many youth during the study period as did IND. Of the counties that successfully achieved program start-up, those in the CDT condition completed the implementation process more thoroughly, as measured by the SIC. We found no significant differences by implementation condition on the time it took for first placement, achieving competency, or number of stages completed.
Conclusions:This trial did not lead to higher rates of implementation or faster implementation but did provide evidence for more robust implementation in the CDT condition compared to IND implementation once the first family received MTFC services. This trial was successful from a design perspective in that no counties dropped out, even though this study took place during an economic recession. We believe that this methodologic approach of measurement utilizing the SIC, which is comprised of the three dimensions of quality, quantity, and timing, is appropriate for a wide range of implementation and translational studies.
Trial registration:Trial ID: NCT00880126 (ClinicalTrials.gov).
Keywords:Implementation, Multidimensional Treatment Foster Care, Stages of Implementation Completion
* Correspondence:[email protected]
1Department of Psychiatry and Behavioral Sciences, Northwestern University Feinberg School of Medicine, 750 North Lake Shore Dr, 10thFloor, Chicago, IL 60611, USA
Full list of author information is available at the end of the article
Background and objectives
One of the leading scientific challenges in implementa-tion research is to determine what strategies are optimal to implement evidence-based programs successfully in communities, organizations, and populations. There is a considerable debate in the field about the best scientific approaches for answering such questions; one approach suggests that multiple baseline and other non-randomized designs often are the most appropriate or most acceptable [1,2], while others argue for the use of randomized imple-mentation trials that contrast impleimple-mentation strategies against each other [3-8]. This paper is based on the ana-lysis of a randomized implementation trial of an evidence-based behavioral intervention delivered through county public child service systems. We first present new analytic measures and models for testing differences in speed, qual-ity, and quantity of implementation between two different strategies, each of which targets implementation of the same evidence-based program, Multidimensional Treat-ment Foster Care (MTFC) [9], an alternative to group or residential placement.
Specifically, we tested whether a peer-to-peer Community Development Team implementation strategy for county child public service systems (CDT; experimental condition) could improve the speed and quality of implementation, the quantity of families who received MTFC, and the ability of counties to reach competence in continued delivery of MTFC [10] compared to the existing individualized, single independent county implementation strategy (IND) or comparison condition. As a type of learning collaborative, CDT required counties to work together to develop their respective implementation plans and overcome barriers in implementation, whereas counties in IND developed their own plans and worked individually with the MTFC pur-veyor (i.e., as is typically done in MTFC implementation ef-forts). These two implementation strategies are compared to one another, holding fixed the same evidence-based intervention.
MTFC, a behavioral mental health intervention pro-gram, was implemented in both conditions. MTFC in-volves placement in specially trained and supported community-based foster care homes in lieu of placement in aggregate care settings. MTFC is a top-tier evidence-based intervention for high-need youth in the child public service systems, including juvenile justice, mental health, and child welfare systems. This program is one of the ori-ginal ten highest tier evidence programs designated by the Blueprints for Healthy Youth Development whose certifi-cation standards for determining which programs are evidence-based are among the highest in the field [11]. MTFC has demonstrated effects on preventing violence, delinquency and criminal behavior, illicit drug use, depres-sion, and teen pregnancy, and because of these benefits and its high potential for cost savings [12], it has been
identified by many states in the United States as one of a handful of evidence-based programs to be imple-mented as an alternative to restrictive placement in resi-dential or group care settings. California, for example, certified MTFC as one of only two programs that they approved for addressing the needs of high service using foster care children [9].
This paper compares two alternative ways to implement MTFC. All counties in this trial were randomized to either CDT or IND and participated between 3 and 6 years based on assigned cohort in this rollout design [7]. In contrast to standard efficacy and effectiveness trials where the key interest is on evaluating improvement in health outcomes for the ultimate target population, this study focused on the changes that occur in the multilevel public service sys-tems responsible for implementing MTFC. The levels range from leaders (county directors) in the mental health, child welfare, and juvenile justice systems to the private agency directors implementing the model, their clinical teams of front line practitioners, and the foster parent who is directly responsible for the care of the foster child.
Methods
Overview of the trial design
Trial recruitment began in California in May 2006. The trial was expanded to include Ohio counties to the partici-pating California counties from March 2009 through November 2010. Follow-up ran from approximately March 2007 to April 2012 in California, and from June 2009 to May 2010 in Ohio. All outcome measures for this study were derived from the Stages of Implementation Comple-tion [13-16], which measures implementaComple-tion processes, in-cluding how complete an implementation occurred, how fast it occurred, the quality with which it was implemented, number of clients served, and which milestones were achieved, including program start-up and credentialing. The trial involved a head-to-head comparison of the peer-to-peer CDT and individualized IND strategies.
Trial participants
As we describe in more detail below, counties that had prior experience implementing MTFC were excluded from the trial; thus, this study focused on “non-early adopting”counties [17]. In the years prior to this study, the California Institute of Mental Health (CiMH), which provides technical assistance, research, and policy devel-opment to California counties to implement evidence-based practices, embraced the use of MTFC for the state and extended a general invitation to all California coun-ties to receive training in MTFC. At that time, a total of 9 of California’s 58 counties elected to participate. Eligibility
This project used two exclusion criteria in selecting counties across the two states: those that had received MTFC previously and those that were too small to make MTFC a viable program. First, counties could not have been early adopters of MTFC. Thus, the nine California early adopting counties mentioned above were excluded from the trial. The County of Los Angeles also was ex-cluded from randomization due to a class action lawsuit which led to a decision to require that MTFC/CDT be used in this county. Secondly, the remaining non-early adopting counties with too few foster youth eligible for MTFC were excluded from this study. Specifically, we ex-cluded counties that had six or fewer youth in care on two snapshot days during the prior year, as this number was too small to maintain an active MTFC referral flow. This size restriction excluded an additional eight low-need counties. The remaining 40 eligible California counties were targeted for recruitment and randomization in 2006.
Two years into the project, recruitment was extended to Ohio to increase sample size. Due to study resource limi-tations, only an additional 12 counties were sought for re-cruitment. Using virtually identical inclusion/exclusion criteria as applied to the California counties, i.e., removing
counties with prior MTFC implementation efforts and fewer than 6 youth in care, 38 of 88 Ohio counties were deemed eligible. These counties were randomly ordered and approached for participation in the trial, intending to recruit 12 counties from Ohio. However, only 11 counties agreed to take part during the time-limited open recruit-ment period we offered. Therefore, a total of 51 counties were recruited for participation.
Recruitment
At the time of each state’s respective recruitment, all eli-gible counties were sent an invitation letter to participate in this study, explaining that the project would evaluate two different strategies for implementing MTFC: IND im-plementation and CDT. It was explained that IND-assigned counties would work singularly, as is customarily done with MTFC implementation (i.e., business as usual), while the CDT-assigned counties would engage in peer-to-peer networking and problem solving with five to seven other counties. The letter also explained that each county would be randomly assigned to one of these two implementation conditions in order to evaluate which implementation method was most effective in yielding successful imple-mentation outputs.
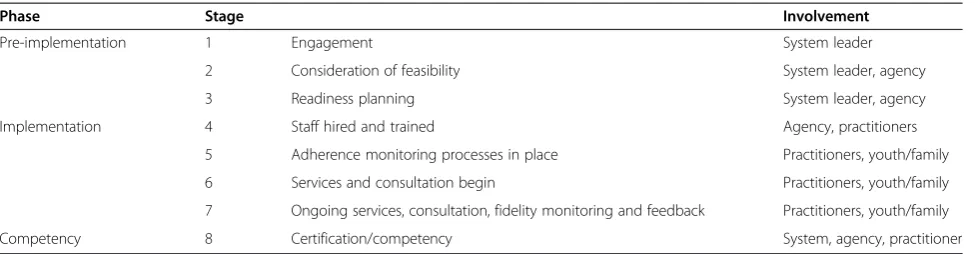
Outcomes: the Stages of Implementation Completion The Stages of Implementation Completion (SIC) [10] measure was developed to evaluate completion, speed, and quality of implementation progress in both the CDT and IND conditions. The SIC defines eight stages resented within three phases of implementation (i.e., pre-implementation, pre-implementation, and sustainabilitya) and includes the measurement of activities that involve interactions at multiple levels during the implementation process including system leaders, agency directors, prac-titioners, and clients (Table 1).
Components of SIC used in addressing hypotheses The SIC measure was used to generate three types of scores used in forming the primary composite outcome; the final stage attained in the implementation process (0–8), the total of all activities indicating quality of implementation across stages 1–8—indicating how thoroughly or com-pletely implementation was carried out and the number of families receiving MTFC. From these, we computed the composite score used in analyses for our primary hypoth-esis. We adjusted each of these three measures for cohort since their observation times were different. We then scaled the residuals to have a variance of one and used the first principal component - the linear combination of the data having maximal variance - to form the composite score used in analyses.
number of stags attained and when two major mile-stones occurred, when a county first placed a youth, and when clinical competency occurred.
Previous evaluation of the SIC by Saldana and Chapman has demonstrated strong psychometric properties [16] and ability to predict meaningful implementation outcomes such as successful program start-up [15].
Implementation strategies as intervention conditions We first describe the IND, used initially to implement MTFC. IND counties received the usual technical assist-ance and implementation support as is typically provided to teams who are adopting a new MTFC program. This in-cludes a set of three readiness calls with a highly experi-enced MTFC purveyor and a face-to-face stakeholder meeting where the county stakeholders meet with the MTFC purveyor to ask questions, work through implemen-tation procedures, and develop a concrete plan for start-up.
For IND counties - as well as CDT (see below for dif-ferences) - the readiness calls were followed by a 5-day all staff training for administrators, supervisors, thera-pists, and skill building trainers, a 2-day foster parent training, training in using the MTFC fidelity monitoring system, program start-up (placement of youth in MTFC foster homes), and ongoing consultation and support in implementing the model through weekly viewing of video recordings of foster parent meetings and consult-ation calls to maintain fidelity to the model.
Counties randomized to the CDT condition also re-ceived all of the activities in the previous paragraph. In addition, they received technical assistance from two CDT consultants who were trained and experienced in imple-menting the MTFC model as they had previously assisted the initial nine counties in California excluded from this study. This support was offered over the course of the im-plementation process in six peer-to-peer meetings and in monthly conference calls with program administrators. CDT facilitators either were the developers of the CDT model or trained by the CDT developers. These facilitators
began engaging county leaders in the CDT condition around the decision to adopt MTFC using similar proce-dures as in the IND condition but explained that their county would begin meeting with five to seven other counties at a time to help problem solve and share inmation about implementation issues [18]. This group for-mat allowed for sharing of ideas across teams, discussion of key barriers experienced by counties in California or Ohio that were unique to the state landscapes, and re-source sharing. The CDT principles and elements have previously been described in detail [14].
The CDT learning collaborative can be considered as a special type of quality improvement collaborative (QIC). These QICs grew out of adaptations of early attempts to apply industrial continuous quality improvement processes to the organizational systems used to deliver these mental health programs [19-22]. CDT utilizes some of the same components as QIC models of implementation, particularly providing structured opportunities for collaboration and problem solving across sites. CDT also has unique features, including its focus on the adoption of evidence-based men-tal health programs by local public service agencies through the direction and support of a statewide mental health ser-vice. Further, most QIC models are intended to monitor pa-tient level outcomes but sometimes fall short of measuring meaningful system level outputs that assess the extent of evidenced based program implementation [22].
Randomization
In our protocol, we laid out a type of rollout design where randomization [4] of eligible counties would occur at two levels: implementation condition (CDT or IND) and when implementation would begin (three yearly cohorts, the last in two states). The second level of randomization involv-ing timinvolv-ing was necessary to address study resource limita-tions and our inability to introduce the MTFC model to all counties at the same time. As per our protocol, eligible counties were matched within each state on county demo-graphic variables including size, number of children in
Table 1 Stages of Implementation Completion (SIC) by agent involved
Phase Stage Involvement
Pre-implementation 1 Engagement System leader
2 Consideration of feasibility System leader, agency
3 Readiness planning System leader, agency
Implementation 4 Staff hired and trained Agency, practitioners
5 Adherence monitoring processes in place Practitioners, youth/family
6 Services and consultation begin Practitioners, youth/family
7 Ongoing services, consultation, fidelity monitoring and feedback Practitioners, youth/family
Competency 8 Certification/competency System, agency, practitioner
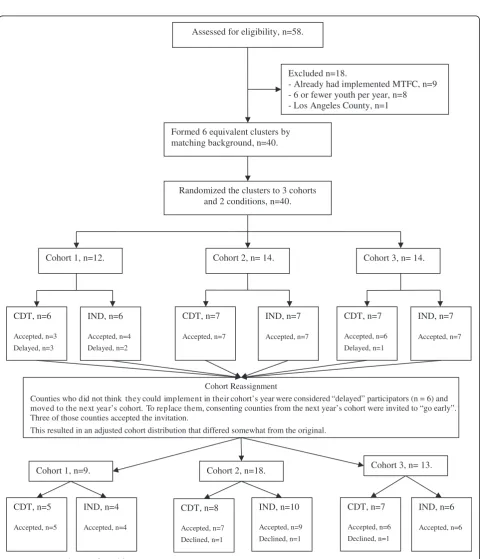
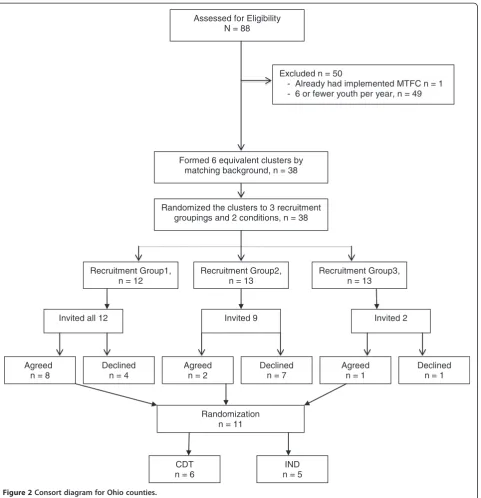
poverty, number of minority children, use of Medicaid, and per capita and group home placement rate. Although the matching criterion was the same across the two states, the randomization process differed slightly between the two (see Figures 1 and 2, consort diagrams). California counties were randomized prior to recruitment, as all
eligible counties were invited to participate. On the other hand, because we recruited only 11 counties in Ohio, randomization occurred following their acceptance of the invitation to participate in order to maintain a bal-anced randomized design. A total of six equivalent groups of counties in California, each with six to eight
Assessed for eligibility, n=58.
Excluded n=18.
- Already had implemented MTFC, n=9 - 6 or fewer youth per year, n=8 - Los Angeles County, n=1
Randomized the clusters to 3 cohorts and 2 conditions, n=40.
Cohort 1, n=12.
CDT, n=6
Accepted, n=3
Delayed, n=3
Cohort 2, n= 14.
IND, n=6
Accepted, n=4
Delayed, n=2
Cohort 3, n= 14. Formed 6 equivalent clusters by
matching background, n=40.
CDT, n=7
Accepted, n=6
Delayed, n=1
IND, n=7
Accepted, n=7
CDT, n=7
Accepted, n=7
IND, n=7
Accepted, n=7
CDT, n=5
Accepted, n=5
IND, n=10
Accepted, n=9
Declined, n=1
IND, n=6
Accepted, n=6
CDT, n=8
Accepted, n=7
Declined, n=1
CDT, n=7
Accepted, n=6
Declined, n=1 Cohort Reassignment
Counties who did not think they could implement in their cohort’s year were considered “delayed” participators (n = 6) and moved to the next year’s cohort. To replace them, consenting counties from the next year’s cohort were invited to “go early”. Three of those counties accepted the invitation.
This resulted in an adjusted cohort distribution that differed somewhat from the original.
Cohort 1, n=9. Cohort 2, n=18. Cohort 3, n= 13.
IND, n=4
Accepted, n=4
counties, were constructed using random permutations of potential assignments of counties to cohort and con-dition so as to minimize between group differences on all county demographic variables among thousands of possible permutations of the same size. Thus, balance was achieved by assigning each of the 40 eligible coun-ties in California to one of the 6 groupings of councoun-ties into cohort and condition, using the optimal assignment found through computer simulation.
Allocation concealment mechanism
The six groups then were randomly assigned to cohort and to intervention through a computer-generated randomization programmed by the biostatistician. None of the counties, nor staff at the California Institute of Mental Health, were aware of their allocation until the research team informed all counties of their cohort and implementation strategy assignments. Randomization was determined similarly in Ohio, but there was only
Assessed for Eligibility N = 88
Excluded n = 50
- Already had implemented MTFC n = 1 - 6 or fewer youth per year, n = 49
Formed 6 equivalent clusters by matching background, n = 38
Randomized the clusters to 3 recruitment groupings and 2 conditions, n = 38
Recruitment Group1, n = 12
Invited all 12 Invited 9 Invited 2
Agreed n = 8
Declined n = 4
Agreed n = 2
Declined n = 7
Agreed n = 1
Declined n = 1 Recruitment Group2,
n = 13
Recruitment Group3, n = 13
Randomization n = 11
CDT n = 6
IND n = 5
one cohort (year 3), so randomization only occurred for implementation strategy.
Procedures to minimize contamination across implementation condition and allocation concealment method
A protocol for conducting this study was developed to minimize possibilities of implementation contamination across condition [7,9,17]. This was particularly relevant to prevent the IND assigned counties from receiving add-itional implementation guidance from CDT facilitators or other counties assigned to CDT, especially considering existing relationships that they had with these colleagues. Weekly meetings were held among the investigative team, IND and CDT facilitators, and the project biostatistician to track progress and limit contamination.
Because of the nature of the two implementation strat-egies, it was impossible to mask or blind these condi-tions, as well as cohort, from the counties or from the California Institute of Mental Health. The county leaders did know their county’s conditions, and they filled out online surveys themselves. Research staff collected con-crete dates for each event in the SIC, and while they were not blind to implementation assignment, there was no decision-making in these tasks that could have intro-duced bias. Later in this paper, we describe how 9 of the 40 counties began at times not originally assigned. In re-placing vacancies by moving counties to an earlier cohort while keeping their implementation condition constant, neither the California Institute of Mental Health intermedi-ary/broker nor the counties themselves knew of the ran-dom ordering that the research team generated through a computer algorithm that we used to prioritize which coun-ties were asked to move forward.
Statistical methods
Our statistical analyses of this head-to-head randomized implementation trial were based on an intent-to-treat analysis in which the 51 counties’ responses were allo-cated to the assigned implementation strategy, whether or not the county completed any implementation stages.
We recognize that there are two types of clustering in this randomized trial, and it is known, but not suffi-ciently appreciated [23], that ignoring clustering can lead to incorrect statistical inference [24]. The first of these clusterings involves the four different cohorts of counties (three in California and one in Ohio) in the trial. Counties in the same cohort experienced the same times of follow-up and were exposed to the similar external forces. Be-cause both implementation conditions occurred in each cohort (the statistical term is a blocking factor), this design was balanced across time and can therefore, with proper accounting of cohort as a random factor, yield appropriate inferences. Secondly, because of the peer-to-peer nature of
CDT implementation, we would expect that the correl-ation among the CDT-assigned counties that work to-gether to implement MTFC within a cohort could well be higher than that of the IND counties in the same cohort. This type of design is an example of an individual (here, county) randomized to receive treatment in a group de-sign [24]. This second type of clustering often is ignored in such trials [23], but this oversight can also lead to in-flated type I error rates, overly precise variance estimates, and spurious findings. Additional file 1 provides consort statements pertinent to this cluster randomized trial.
We used the random effect modeling [25] to handle both of these types of clustering. The most general model in-volved a separate random effect for the four CDT cohorts as in a cluster randomized trial and a separate random ef-fect for the four CDT cohorts. If the random efef-fect for CDT within cohort was found to be nil, i.e., the maximum likelihood estimate of intraclass correlation (ICC) =0, we considered a single cohort-level random effect that was comparable for both CDT and IND counties; that is, the 51 counties were nested into the four cohorts that shared a common variance, and counties were treated as having in-dependent effects within these cohorts. If in addition, the random effect at the cohort level was found to be nil (co-hort-level maximum likelihood ICC =0), we then reduced the model to a fixed effects model to account for potential variation across cohorts. Thus, in situations where the best point estimates of both cluster effects was zero, the 51 counties were considered as independent conditional on the cohort. If the point estimates were greater than zero, even if they were tiny, we reported this and included the random effects in our analysis. We also examined the ef-fects of baseline covariates both as main efef-fects and as hav-ing interactions with implementation condition. A final model was selected based on lowest Bayesian Information Criteria (BIC) [26].
Prior to formal analysis, we examined the distribution of number of placements by graphical means. The data reflected a bimodal distribution with many counties hav-ing no placements (consistent with non-successful im-plementation) and the remainder had a wide range. We first compared the proportions of CDT and IND coun-ties having any placements with Mantel-Haenszel tests that were stratified by cohort and then compared the distributions of placements conditional on those coun-ties having at least one placement. As the counts were highly skewed, we first tested whether a linear model, a generalized linear model (i.e., with a Gamma distribu-tion), or a model that transformed the number of counts (i.e., logarithmic or square root) fit the data better using BIC as a criterion (after adjustment of the likelihood for transforming the dependent variable) [31]. This best fitting class of models was then used to carry out a test to com-pare the numbers of placements for CDT versus IND.
To analyze quality of pre-implementation, implementa-tion, and competency separately, we summed the individ-ual binary qindivid-uality indicators then divided by the number of measures across stages 1–3 for pre-implementation, 4– 7 for implementation, and 8 for competency in continuing to deliver MTFC to families. As these proportions all had positive scores, we examined a series of generalized linear models to account for positive skewness in the data. We again controlled for cohort in this analysis and adjusted standard errors and statistical tests for clustering of CDT counties within cohort.
In submitting this grant proposal, we projected that the proportion of agencies implementing MTFC in CDT counties would increase from 15%, as expected for IND, to 60%, anticipating a large benefit from CDT. Even if the ICC for CDT counties were very high, i.e., as large as 0.5, this design was expected to have 85% power. For outcomes that are more continuous, such as our com-posite measure used as our primary endpoint, we pre-dicted that the trial would have sufficient power to detect an effect size of 0.9 at power 0.80 and an effect size of 0.8 at power 0.70 for a two-sided 0.05 level test given ICCs less than 0.10.
Results Participant flow
Consort diagrams are provided for California counties (Figure 1) and for Ohio (Figure 2). Of the 58 California counties, 18 were excluded because they met exclusion re-strictions; all remaining 40 counties consented to partici-pate and were randomized. Of the 88 Ohio counties, 50 were ineligible and the remaining 38 counties were divided into three comparable clusters. A total of 12 Ohio coun-ties were invited, 11 agreed to participate, and all of these were randomized.
Baseline data
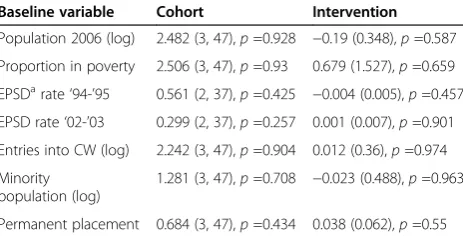
Counties that did not think they could implement in their assigned cohort’s year were considered “delayed” participators (n=6) and moved to the next year’s cohort. To replace them, consenting counties from the next year’s cohort were invited to“go early”. Three of those counties accepted the invitation. Thus, a total of 9 of the 40 cohort assignments in California were modified to fill vacancies in this rollout design (22%; 6 of 13 assigned to the first cohort moved to the second, 2 of 13 originally assigned to the second cohort were moved to the first, and 1 of 14 originally assigned to the third cohort was moved to the second, see Figure 1). Because of these co-hort reassignments, we checked again for comparability of counties on baseline measures across the cohorts and the two implementation strategy assignments. All 40 California counties and all 11 Ohio counties retained their assigned implementation condition (IND or CDT); they only switched cohorts. Table 2 shows these compar-isons. Assignment was balanced for cohorts as well as implementation condition, as there were no significant differences across the county demographic variables.
Recruitment
System leaders from (1) Child Welfare, (2) Juvenile Justice, and (3) Mental Health from each county were invited to consent to participate using the same procedures across implementation condition. Consent was only necessary from one of the three systems for the county to be in-cluded in the participant pool.
As previously noted, the recruitment procedures be-tween California and Ohio varied slightly (see con-sorts). In California, all counties were recruited at the start of the study, but those in cohorts 2 and 3 were told that their start dates would be staggered annually. Thus, counties in these later cohorts could agree to participate without having to implement until 12 to 24 months later.
Table 2 Baseline comparisons by cohort and intervention condition
Baseline variable Cohort Intervention
Population 2006 (log) 2.482 (3, 47),p=0.928 −0.19 (0.348),p=0.587 Proportion in poverty 2.506 (3, 47),p=0.93 0.679 (1.527),p=0.659 EPSDarate‘94-’95 0.561 (2, 37),p=0.425 −0.004 (0.005),p=0.457 EPSD rate‘02-’03 0.299 (2, 37),p=0.257 0.001 (0.007),p=0.901 Entries into CW (log) 2.242 (3, 47),p=0.904 0.012 (0.36),p=0.974 Minority
population (log)
1.281 (3, 47),p=0.708 −0.023 (0.488),p=0.963
Permanent placement 0.684 (3, 47),p=0.434 0.038 (0.062),p=0.55 a
Numbers analyzed in each cluster
In order to maximize our annual study resources, we reassigned cohorts in California (see consort diagram 1) to fill vacancies while maintaining assigned implementa-tion condiimplementa-tion and randomizaimplementa-tion. To do this, we first randomized the order of counties within their respective cohorts and then used this order to invite them to
“move up”in the rollout, always replacing counties who wanted to delay with those in the same implementation condition. This process allowed us to be responsive to county needs, while also maintaining our randomization and balanced design. Of the six CDT-assigned CA coun-ties originally in the first cohort, three of these were reassigned and began with cohort 2. Of the seven IND CA counties originally assigned to the first cohort, three of these were reassigned and began with cohort 2. Two of the seven CDT counties originally assigned to cohort 2 were reassigned and began with cohort 1. One of the seven IND counties originally assigned to cohort 3 was reassigned and began with cohort 1. This resulted in 9 Californian counties in cohort 1 (5 CDT, 4 IND), 18 in cohort 2 (8 CDT, 10 IND), and 13 in cohort 3 (7 CDT, 6 IND). Because Ohio counties were added to the sample during California cohort 3, there was no need to delay or “move up” start dates in this state. Therefore, it was necessary for Ohio counties to consent to participate at the time of invitation or not at all. We randomized 11 Ohio counties into cohort 4 (6 CDT, 5 IND).
Outcomes and estimation: primary hypothesis
For our composite measure that combined the total num-ber of stages attained, the numnum-ber of youth receiving MTFC services, and the quality of implementation across all eight stages, a principal component analysis on these standardized measures revealed a nearly equal weighting of all three measures for the first principal component. A linear regression analysis of this first principal component on implementation condition, using random effects for cohort and CDT groups found a positive but non-significant effect of CDT versus IND (effect size =0.24, CI = (−0.35,0.83),p=0.42).
Outcomes and estimation: secondary hypotheses
For the secondary hypotheses, the three variables included in the composite score were analyzed separately, and we also tested whether the proportion of counties that suc-cessfully started up a MTFC program, the proportion of programs that reached clinical competency, and the speed of implementation (i.e., timing to first placement) differed by implementation.
Comparing the total number of stages attained
For both CDT and IND, counties’ final implementation stage ranged across the full eight stages. Figure 3 shows
Kaplan-Meier type curves corresponding to highest stage attained rather than the more traditional time to an event. Beyond stage 2, the small separations in the curves suggest that the CDT counties were slightly more likely than IND to reach higher stages based on an ordinal logistic regres-sion analysis, but this did not reach significance when stratifying by cohort (proportional odds ratio =1.35, 95% CI = (0.46, 3.95), p =0.59). Both the median (three for CDT and two for IND) and the unadjusted mean (3.96 for CDT and 3.52 for IND) were slightly higher for CDT com-pared to IND. Using a cumulative ordinal mixed effects re-gression model, we found no difference in the final stage attained by implementation strategy (p =0.39). We also found that implementation strategy was non-significant in a fixed effect analysis that adjusted for county need (num-ber of placements on snapshot days) cohort, and state (mean difference in CDT versus IND =0.23, 95% CI = (−0.90, 1.37),p=0.68). There was no indication of any inter-action of cohort by implementation strategy (F(3,43) =1.12, p =0.35), although the California counties in the last two cohorts passed through significantly fewer stages than those of the first cohort and the only Ohio cohort.
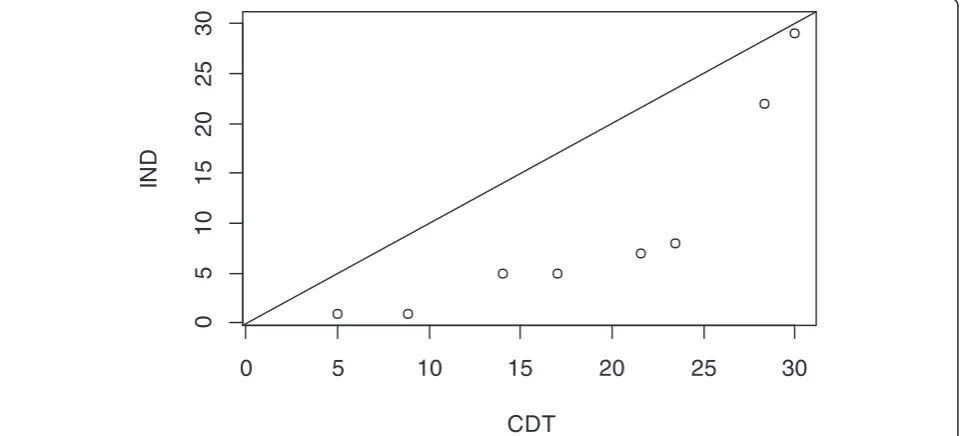
Comparing the number of youth receiving MTFC services Overall, the average number of placements in MTFC per site over the study period was 6.4 for the CDT-assigned counties, compared to 3.1 for IND. This difference is not significant overall when tested in a quasi-likelihood Pois-son model with fixed cohort effects (p=0.27). However, as previously noted, the proportions of counties that had no placements was nearly identical (p=0.94); thus, we ex-amined the distribution of numbers of placements be-tween CDT and IND only among those counties that placed any youth. The differences in distribution of place-ments are represented in an exploratory fashion through an empirical quantile-quantile plot in Figure 4. Each quan-tile for CDT is plotted against that for IND; the fact that all quantile comparisons fell at or below the diagonal line of equivalence indicates that the CDT distribution of placements appears to have higher values for each quantile (e.g., median, upper and lower quartiles) than that for IND. We followed up this exploratory examination by searching for a best fitting model to the data.
of CDT was marginally significant (coefficient =1.42, CI = (−0.01, 2.86), p =0.051 on 12 df), indicating that there were higher numbers of placements under CDT versus IND. Among counties that did place a youth into MTFC, those randomized to CDT placed nearly 2.5 times the number of youth as those in IND.
Comparing the proportion of counties that successfully started up MTFC
Nine out of 26 counties in the CDT condition placed one or more youth (35%), and 8 out of 25 counties in the IND condition placed one or more youth (32%). Control-ling for cohort, there was no significant difference between Figure 3Final stage of implementation for community development team (CDT) and independently administered (IND).
0
5
10
15
20
25
30
0
5
10
15
20
25
30
CDT
IN
D
conditions (Mantel-Haenszel odds ratio 0.95, CI = (0.24, 3.72),p=0.94).
Comparing the proportion achieving competence
Achieving competency is the first step toward achieving sustainability, and this starts to occur at Stage 8 on the SIC. Five of the 51 counties received full certification during the study time period, indicating competency. Of these five, four were in the CDT condition, but there were no significant differences by implementation strat-egy (odds ratio =4.06, p =0.43 by Mantel-Haenszel test).
Comparing the timing of first placement and timing to obtain clinical competency
A formal Cox proportional hazard model predicting time to first youth placement in MTFC (which occurs at the beginning of stage 6), adjusting for level of county need and adjusting for cohort and state strata also yielded faster but non-significant differences for CDT versus IND (hazard ratio =1.13, 95% CI = (0.34, 3.79), p =0.84).
From Cox regression modeling, the speed with which CDT counties obtained competency was not significantly different from the IND county (hazard ratio =2.99, 95% CI = (0.35, 25.60),p=0.32).
Proportion of pre-implementation activities completed There was no evidence of any difference in quality of pre-implementation by condition using a random effects model (coefficient =0.04, CI = (−0.08, 0.16), p =0.65). Unlike our previous analyses, there was strong evidence of cohort effects on pre-implementation quality, with an intraclass correlation of 0.45, with cohorts 2 and 3 in California having significantly fewer pre-implementation activities completed compared to cohort 1.
Proportion of implementation activities completed An analysis was conducted based on the sum of activities completed throughout stages 4–7 to determine how thor-oughly the counties completed the recommended imple-mentation activities during the impleimple-mentation phase. These values ranged from 8 to 19 for those 17 counties that began stage 4, all of whom completed stage 6. We found substantial intraclass correlation due to cohort ef-fects (ICC =0.38). In the random effect model, we found that CDT had significantly higher overall quality of imple-mentation scores for stages 4–7 than did IND (coefficient =0.126, CI = (0.01, 0.25),p=0.03).
Proportion of competency activities completed
No differences were found between conditions regarding the number of activities completed in the competency stage. All five counties that reached this stage had the maximum score of 2.
Discussion
In this study, we found no evidence that the CDT imple-mentation strategy achieved higher overall implementa-tion compared to that for IND using either a composite score or assessments of how many stages were com-pleted, how fast they were achieved, whether a county achieved placement of any youth, or whether a county achieved full competency. These findings were domi-nated by an overall low rate of MTFC placement; 35% in the CDT condition and 32% in IND. Among those coun-ties that did place at least one youth in MTFC, there were indications in both quality of implementation as well as quantity that CDT performed better than IND. Thus it ap-pears that CDT’s effect was negligible in achieving first placement as well as speed or extent of moving through implementation states. CDT did, however, appear to in-crease the number of placements and inin-crease the quality of implementation once implementation began. For these counties, CDT impact appeared to result in more robust MTFC programs as indicated by having significantly more youth placed in care during the study period among coun-ties that began placements, and by having completed more implementation activities. None of the other secondary hypotheses were confirmed in this study.
Generalizability
Findings from this trial on MTFC are likely to generalize to other counties and states since we focused on the 80% of counties that were non-early adopting. The only counties that were excluded from this study were those that had previous exposure to MTFC or served too few youth to make MTFC an economically viable program in these counties. The trial took place during one of the worst financial crises faced by states, yet the design and program implementation were maintained throughout.
We note that the California Institute of Mental Health played a critical intermediary role in this project in both states [32]. Other states may not have access to such an organization and may not have the state level infrastruc-ture to carry out CDT. However, since the California Institute of Mental Health was successful in working with counties from another state, this technology is likely to be exportable.
Limitations
low rate of certification. It is well recognized that the stat-istical power for time to event and binary measures (e.g., milestone attainment) have lower statistical power than do most analyses of continuous quantity and quality mea-sures. Even for the primary analysis based on a composite measure whose distribution was close to normally distrib-uted, the effect size was 0.28 while the p value was not close to significant (p=0.42). Such an effect size is consid-ered small but could be meaningful in large-scale imple-mentation. Also, despite the comparatively high cost and length of this randomized trial, the low numbers of co-horts made it very difficult to assess variation across time, especially for counties assigned to CDT. We may need to find unique opportunities when evidence-based interven-tions are being rolled out to share the expense of large-scale implementation trials.
Another limitation in this study is that we did not ex-plicitly examine variation in the patterns of implementa-tion across counties, but rather considered variaimplementa-tion more as “nuisance” parameters in our analysis. Further analyses are needed to understand whether there are dis-tinct patterns of implementation that occur (e.g., a long pre-implementation period), and whether such patterns can be predicted and therefore provide opportunities for individualized feedback and intervention with counties that are not making adequate progress. Such analyses are currently under investigation as part of an ongoing R01 (PI: Saldana).
It is not clear from our study whether using a different learning collaborative other than CDT to support the im-plementation of another evidence-based program would yield more or less improvements in implementation.
The cost of using the CDT approach is a major poten-tial caveat because this cost is added to the business as usual costs enacted in the IND condition. Cost has high relevance to policy and system leaders and is being ex-amined in additional analyses [16,33].
Interpretations
The Community Development Team implementation strategy, which uses trained consultants with knowledge of local policies and conditions to guide problem solving in teams of counties facing similar implementation chal-lenges, may be particularly important in implementing complex mental health interventions within social service settings, such as MTFC, in non-early adopting counties. In extending Rogers’finding that innovations that can be implemented relatively simply have high potential for rapid diffusion, we find that a more intensive implementa-tion strategy, such as CDT, is partially helpful when imple-menting complex interventions to less innovation-seeking organizations, such as the social service agencies respon-sible for delivering mental health interventions to the targeted populations [34]. The notion that routine
face-to-face and telephone conferences allowing for peer-to peer exchanges with consultants who are knowledgeable about state and county conditions, regulations, policies, and polit-ics seems intuitively obvious as a means to boost imple-mentation prospects, but this is the first trial to definitively show some effects from this process. In fact, to our know-ledge, this is the largest county-level randomized trial to compare two implementation strategies against each other to examine implementation effectiveness.
There are two dimensions where this study differs from other important implementation efforts involving evidence-based programs. First, the design of this study with its head-to-head randomized trial and the assess-ment of impleassess-mentation success/failure using the SIC allows us to make empirical comparisons of distinct im-plementation strategies. CDC’s Dissemination of Effect-ive Behavioral Interventions (DEBI) program [35], for example, used a national training center to provide training in HIV prevention programs to all community-based organizations that are interested, so there is little opportunity to test implementation effectiveness. Simi-lar to the two arms of this implementation trial, DEBI provides training on the delivery of the program itself. Un-like the two arms in this study, DEBI does not provide much technical assistance pertaining to capacity building at the community level, nor on supervision once training has ended. By not including an implementation measure such as the SIC, the DEBI program has limitations in learning how important these additional steps are.
A second unusual feature is that CDT involves a peer-to-peer process of addressing challenges in delivering an evidence-based intervention. Many other implementa-tion strategies rely solely on technical support delivered to a sole system. For example, the Blueprints Replication Initiative provided extensive capacity building support to communities to implement those top-tier programs that Blueprints had identified and whose providers also had, at that time, sufficient capacity to deliver implementa-tion training [36]. In the Blueprint implementaimplementa-tion pro-ject, they concluded that their training program led to high fidelity program delivery. Unlike our study, it is not immediately clear how many communities this Blue-prints Replication Initiative initially contacted to partici-pate in this study, nor was there any indication that implementation would be successful with any communi-ties other than the early adopters.
process components, evaluation-decision making, process evaluation mechanics, and continuous quality improve-ment mechanics showed higher scores among those sites that received GTO compared to control.
Our own trial provides important findings regarding the use of a particular learning collaborative, CDT, in imple-menting a mental health intervention within social service settings. While we have not decomposed the effects of the different components of CDT, the improvements in qual-ity and quantqual-ity of implementation that we have found suggest limited optimism for the use of certain aspects of quality improvement collaboratives. In Nadeem et al.’s re-view of quality improvement cooperative research, they identified five randomized controlled trials of such imple-mentation strategies, three of which used active control comparisons such as we have done [22]. This study thus contributes to this small but important literature.
In addition to providing some evidence for the hypothe-sized outcomes for CDT, this study also succeeded from a design point of view. The study used a novel rollout ran-domized implementation trial design in two states to com-pare two implementation strategies focused on one evidence-based mental health intervention. In this head-to-head randomized implementation trial, counties were randomized to both the timing of implementation and im-plementation condition. We had no difficulty obtaining consent from counties to participate, and throughout the design, we were able to keep counties true to their assigned condition. No county dropped out of this design once they began, although several elected not to implement MTFC. This is not completely surprising given that all of the par-ticipating counties in both conditions had previously been given opportunities to implement MTFC and they had de-clined to do so; these counties are described as non-early adopting counties.
The assignment of counties to cohorts allowed county leadership to plan in advance for implementation, and our protocol, which allowed counties to move to later cohorts and fill vacancies while remaining in the same implementation condition, provided sufficient flexibility for counties to make timing adjustments. Our protocol of weekly research meetings involving the CDT and IND consultants who supported implementation in both con-ditions minimized the potential contamination across conditions. More detailed social network analysis in the California counties demonstrated that trust and influence relationships between county leaders in the two conditions were similar and not likely to affect the conclusions of this study [43]. Finally, we note that this trial took place during a major economic recession, which did reduce the willing-ness of counties to implement a new program model. However, because of the randomized trial design, we could still make valid causal inferences comparing the two im-plementation strategies. Had this study been conducted
under any design other than a randomized trial, we would not have been able to disentangle the effects of the ex-treme economic changes from the implementation condi-tion effects.
We also note that this study introduces more sophisti-cated modeling of implementation processes than often is done. The SIC allowed us to measure implementation across multiple stages and milestones and across multiple levels of participants from county government to foster parents in the MTFC team. The SIC provided information on the quality and quantity of implementation as well. By assessing timing, quality, and quantity of implementation, we were able to pinpoint much more accurately what changes in implementation process occurred, including progress and lack thereof. We believe that this methodolo-gic approach of measurement with a SIC scale of the three dimensions of quality, quantity, and timing is appropriate for a wide range of implementation studies. In a recently funded study, Saldana (R01 MH097748) is adapting the SIC for other child and family evidence-based programs for service sectors including schools, juvenile justice, and substance abuse treatment [16]. The purpose is to evaluate the common or universal implementation activities that are utilized across evidence-based programs in their implemen-tation strategies and to examine whether these universal items are equally important in achieving implementation success. Similarly, the study examines if the stages of the SIC are stable across evidence-based programs even when the activities defining SIC stages might differ. These adapted SIC tools will then be evaluated for ad-equate psychometric properties, including predictive ability, in order to further examine the value of imple-mentation process and milestones in achieving success-ful program implementation.
The SIC scale, as well as the analytic models described here, is also relevant to the field of translational research, which has focused particularly on milestone attainment and less on quality and quantity [44]. The traditional view of implementation as one single stage of translational re-search, concerning the“bedside to community”translation that begins with “bench” research, can be enriched and viewed from a broader perspective. Indeed, the SIC meas-urement system and the analytic methods described here, which were developed around implementation, could also be used to monitor the entire translational process from bench to bedside to community.
Conclusions
Completion to assess the speed of milestone attainment and the quality and quantity of implementation, we found that CDT did not increase overall implementation based on a composite measure of stage attainment, number of youth placed, and quality of implementation. There was no difference in the proportion or rate of implementing MTFC compared to IND nor the speed of milestone at-tainment. Compared to IND implementing counties, CDT implementing counties served more than twice as many youth during the study period. Additionally, the quality of implementation was improved in these CDT counties.
Endnote a
Additional competency certification is continuing beyond the formal end of the trial.
Additional file
Additional file 1: Table S1.CONSORT 2010 checklist of information to include when reporting a cluster randomized trial.
Abbreviations
CDT:Community Development Team strategy; ICC: intraclass correlation; IND: individualized, single-county implementation strategy;
MTFC: Multidimensional Treatment Foster Care; SIC: Stages of Implementation Completion; QIC: quality improvement collaborative.
Competing interests
The authors declare that they have no competing interests.
Authors’contributions
CHB participated in the design of the study and was the lead on all of the analyses in the current paper. PC conceived of the study and was the PI on the research trial. LS lead on the development of the SIC and co-conducted the research trial with PC. CP was the project manager and contributed to the drafting of the current paper. WW assisted in conducting the analyses on the study. GC assisted with the writing and editing of the current paper. All authors read and approved the final manuscript.
Authors’information
CHB is a Professor in the Department of Psychiatry and Behavioral Sciences and Departments of Preventive Medicine and Medical Social Sciences, Northwestern University Feinberg School of Medicine, as well as the Director, Center for Prevention Implementation Methodology (Ce-PIM) for Drug Abuse and Sexual Risk Behavior, and Director, Prevention Science and Methodology Group (PSMG). PC is a Research Scientist, and the Science Director at the Oregon Social Learning Center (OSLC). She is the Director of the P50 Center for Translational Drug Abuse Prevention in Child Welfare at OSLC and founded the MTFC and KEEP intervention models. LS is a Research Scientist at OSLC, Co-Investigator on the study, and the lead on the development of the SIC measure. CP was the project manager of the study and monitored the protocol adherence throughout the study. WW is an Associate Professor of Biostatistics at the University of South Florida, specializing in statistical method development and the application of statistics in social science. GC is a project coordinator in the Department of Psychiatry and Behavioral Sciences, Northwestern University Feinberg School of Medicine.
Funding
This research was supported by the following grants: R01 MH076158, NIMH, U.S. PHS (PI: Chamberlain); R01 MH076158-05S1, P30 DA023920, P50 DA035763, NIDA, U.S. PHS (PI: Chamberlain); P30 DA027828, NIDA, U.S. PHS (PI: Brown); K23 DA021603, NIDA, R01 MH0977748 NIMH, U. S. PHS (PI: Saldana); The Children’s Bureau, Department of Health and Human Services, and the WT Grant Foundation. The content of this paper is solely the responsibility of the authors and does not necessarily represent the official views of the funding agencies.
Author details 1
Department of Psychiatry and Behavioral Sciences, Northwestern University Feinberg School of Medicine, 750 North Lake Shore Dr, 10thFloor, Chicago, IL 60611, USA.2Oregon Social Learning Center, 10 Shelton Mcmurphey Blvd, Eugene, OR 97401, USA.3University of South Florida, 13201 Bruce B Downs MDC 56, Office 2130, Tampa, FL 33612, USA.
Received: 27 September 2013 Accepted: 19 September 2014
References
1. Glasgow RE, Magid DJ, Beck A, Ritzwoller D, Estabrooks PA:Practical clinical trials for translating research to practice: design and measurement recommendations.Med Care2005,43(6):551–557.
2. Glasgow RE, Davidson KW, Dobkin PL, Ockene J, Spring B:Practical behavioral trials to advance evidence-based behavioral medicine. Ann Behav Med2006,31(1):5–13.
3. National Research Council and Institute of Medicine:Preventing mental, emotional, and behavioral disorders among young people: progress and possibilities.InCommittee on the Prevention of Mental Disorders and Substance Abuse Among Children, Youth, and Young Adults: Research Advances and Promising Interventions.Edited by O’Connell ME, Boat T, Warner KE, Board on Children, Youth, and Families, Division of Behavioral and Social Sciences and Education. Washington, DC: The National Academies Press; 2009. Anonymous.
4. Brown CH, Ten Have TR, Jo B, Dagne G, Wyman PA, Muthen B, Gibbons RD: Adaptive designs for randomized trials in public health.Annu Rev Public Health2009,30:1–25.
5. Spoth R, Rohrbach LA, Greenberg M, Leaf P, Brown CH, Fagan A, Catalano RF, Pentz MA, Sloboda Z, Hawkins JD, Society for Prevention Research Type 2 Translational Task Force Members and Contributing Authors:Addressing core challenges for the next generation of type 2 translation research and systems: the translation science to population impact (TSci Impact) framework.Prev Sci2013,14:319–351.
6. Landsverk J, Brown CH, Chamberlain P, Palinkas L, Rolls Reutz J, Horwitz SM: Design and analysis in dissemination and implementation research.In Dissemination and Implementation Research in Health: Translating Science to Practice.Edited by Brownson RC, Colditz GA, Proctor EK. London: Oxford University Press; 2012:225–260.
7. Chamberlain P, Brown C, Saldana L, Reid J, Wang W, Marsenich L, Sosna T, Padgett C, Bouwman G:Engaging and recruiting counties in an experiment on implementing evidence-based practice in California. Adm Policy Ment Health Ment Health Serv Res2008,35(4):250–260. 8. Brown CH, Wang W, Kellam SG, Muthén BO, Petras H, Toyinbo P, Poduska J,
Ialongo N, Wyman PA, Chamberlain P, Sloboda Z, MacKinnon DP, Windham A, The Prevention Science Methodology Group:Methods for testing theory and evaluating impact in randomized field trials: intent-to-treat analyses for integrating the perspectives of person, place, and time.Drug Alcohol Depend 2008,95(Suppl 1):S74–S104. Supplementary data associated with this article can be found, in the online version, at doi:10.1016/j.drugalcdep.2008.01.005. 9. Chamberlain P:Treating Chronic Juvenile Offenders: Advances Made Through
the Oregon Multidimensional Treatment Foster Care Model.Washington, DC: American Psychological Association; 2003.
10. Chamberlain P, Brown CH, Saldana L:Observational measure of implementation progress in community based settings: the Stages of Implementation Completion (SIC).Implement Sci2011,6(1):1–8. 11. University of Colorado Boulder:Blueprints programs.www.
blueprintsprograms.com.
12. Leve LD, Harold GT, Chamberlain P, Landsverk JA, Fisher PA, Vostanis P: Practitioner review: children in foster care–vulnerabilities and evidence‐ based interventions that promote resilience processes.J Child Psychol Psychiatry2012,53(12):1197–1211.
13. Chamberlain P, Roberts R, Jones H, Marsenich L, Sosna T, Price JM:Three collaborative models for scaling up evidence-based practices.Adm Policy Ment Health Ment Health Serv Res2012,39(4):278–290.
14. Saldana L, Chamberlain P:Supporting implementation: the role of community development teams to build infrastructure.Am J Community Psychol2012,50(3–4):334–346.
16. Saldana L:The stages of implementation completion for evidence-based practice: protocol for a mixed methods study.Implement Sci2014,9(1):43. 17. Chamberlain P, Saldana L, Brown CH, Leve LD:Implementation of
multidimensional treatment foster care in California: a randomized trial of an evidence-based practice.InEmpirically Supported Interventions for Community and Organizational Change.Edited by Roberts-DeGennaro M, Fogel S. Chicago, IL: Lyceum Books, Inc; 2010:218–234.
18. Sosna T, Marsenich L:Community Development Team Model: Supporting the Model Adherent Implementation of Programs and Practices.California Institute of Mental Health: Sacramento, CA; 2006.
19. Berwick DM:Continuous improvement as an ideal in health care.N Engl J Med1989,320(1):53–56.
20. Berwick DM:Quality comes home.Ann Intern Med1996,125(10):839–843. 21. Laffel G, Blumenthal D:The case for using industrial quality management
science in health care organizations.JAMA1989,262(20):2869–2873. 22. Nadeem E, Olin SS, Campbell L, Hoagwood KE, Horwitz SM:Understanding
the components of quality improvement collaboratives: a systematic literature review.Milbank Q2013,91(2):354–394.
23. Pals SL, Wiegand RE, Murray DM:Ignoring the group in group-level HIV/ AIDS intervention trials: a review of reported design and analytic methods.AIDS2011,25:989–996.
24. Murray DM, Varnell SP, Blitstein JL:Design and analysis of group-randomized trials: a review of recent methodological developments.Am J Public Health 2004,94(3):423–432.
25. Gibbons RD, Hedeker D, Elkin I, Waternaux C, Kraemer HC, Greenhouse JB, Shea MT, Imber SD, Sotsky SM, Watkins JT:Some conceptual and statistical issues in analysis of longitudinal psychiatric data: application to the NIMH Treatment of Depression Collaborative Research Program dataset. Arch Gen Psychiatry1993,50(9):739–750.
26. Schwarz G:Estimating the dimension of a model.Ann Stat1978,6:461–464. 27. Larsen K:The Cox proportional hazards model with a continuous latent
variable measured by multiple binary indicators.Biometrics2005, 61:1049–1055.
28. Agresti A:An Introduction to Categorical Data Analysis.New York: Wiley; 1996. 29. Bates D, Maechler M:Linear mixed-effects models using S4 classes (Ime4
package).2013. http://cran.r-project.org/web/packages/lme4/lme4.pdf. 30. Christensen RHB:Package‘ordinal’, CRAN; 2013. http://cran.r-project.org/
web/packages/ordinal/ordinal.pdf.
31. Box GEP, Cox DR:An analysis of transformations revisited, rebutted. J Am Stat Assoc1982,77(377):209.
32. Fixsen DL, Naoom SF, Blase KA, Friedman RM, Wallace F:Implementation Research: A Synthesis of the Literature, University of South Florida, Louis de la Parte Florida Mental Health Institute. Tampa, FL: FMHI Publication #231; 2005. 33. Saldana L, Chamberlain P, Bradford WD, Campbell M, Landsverk J:The cost
of implementing new strategies (COINS): a method for mapping implementation resources using the Stages of Implementation Completion.Children Youth Services Rev In Press.
34. Rogers E:Diffusion of Innovations.4th edition. New York: The Free Press; 1995. 35. Collins C, Harshbarger C, Sawyer R, Hamdallah M:The diffusion of effective
behavioral interventions project: development, implementation, and lessons learned.AIDS Educ Prevent2006,18(supp):5–20.
36. Elliott DS, Mihalic S:Issues in disseminating and replicating effective prevention programs.Prev Sci2004,5(1):47–53.
37. Chinman M, Hunter SB, Ebener P, Paddock SM, Stillman L, Imm P, Wandersman A:The getting to outcomes demonstration and evaluation: an illustration of the prevention support system.Am J Community Psychol 2008,41(3–4):206–224.
38. Chinman M, Imm P, Wandersman A:Getting to Outcomes 2004: Promoting Accountability Through Methods and Tools for Planning, Implementation, and Evaluation.Santa Monica, CA: Rand Corporation; 2004. TRTR101.
39. Chinman M, Early D, Ebener PA, Hunter S, Imm P, Jenkins P, Sheldon J, Wandersman A:Getting to outcomes: a community-based participatory approach to preventive interventions.J Interprof Care2004,18(4):441–443. 40. Chinman M, Hannah G, Wandersman A, Ebener P, Hunter SB, Imm P,
Sheldon J:Developing a community science research agenda for building community capacity for effective preventive interventions. Am J Community Psychol2005,35(3–4):143–157.
41. Chinman M, Tremain B, Imm P, Wandersman A:Strengthening prevention performance using technology: a formative evaluation of interactive Getting To Outcomes®.Am J Orthopsychiatry2009,79(4):469–481.
42. Wandersman A:Getting To Outcomes: an evaluation capacity building example of rationale, science, and practice.Am J Eval2013,35(1):100–106. 43. Palinkas LA, Holloway IW, Rice E, Brown CH, Valente T, Chamberlain P:
Influence network linkages across treatment conditions in randomized controlled trial of two strategies for scaling up evidence-based practices in public youth-serving systems.Implement Sci2013,8(1):133.
44. Trochim W, Kane C, Graham MJ, Pincus HA:Evaluating translational research: a process marker model.Clin Transl Sci2011,4(3):153–162.
doi:10.1186/s13012-014-0134-8
Cite this article as:Brownet al.:Evaluation of two implementation
strategies in 51 child county public service systems in two states: results of a cluster randomized head-to-head implementation trial.Implementation Science20149:134.
Submit your next manuscript to BioMed Central and take full advantage of:
• Convenient online submission
• Thorough peer review
• No space constraints or color figure charges
• Immediate publication on acceptance
• Inclusion in PubMed, CAS, Scopus and Google Scholar
• Research which is freely available for redistribution