R E S E A R C H
Open Access
Can a multicomponent multidisciplinary
implementation package change
physicians
’
and nurses
’
perceptions and
practices regarding thrombolysis for acute
ischemic stroke? An exploratory analysis of
a cluster-randomized trial
Md Golam Hasnain
1, Christopher R. Levi
1,2, Annika Ryan
1,3, Isobel J. Hubbard
1, Alix Hall
3,
Christopher Oldmeadow
1,3, Alice Grady
1,3,4,5, Amanda Jayakody
1, John R. Attia
1,3,6and Christine L. Paul
1,3*Abstract
Background:The Thrombolysis ImPlementation in Stroke (TIPS) trial tested the effect of a multicomponent, multidisciplinary, collaborative intervention designed to increase the rates of intravenous thrombolysis via a cluster randomized controlled trial at 20 Australian hospitals (ten intervention, ten control). This sub-study investigated changes in self-reported perceptions and practices of physicians and nurses working in acute stroke care at the participating hospitals.
Methods:A survey with 74 statements was administered during the pre- and post-intervention periods to staff at 19 of the 20 hospitals. An exploratory factor analysis identified the structure of the survey items and linear mixed modeling was applied to the final survey domain scores to explore the differences between groups over time. Result:The response rate was 45% for both the pre- (503 out of 1127 eligible staff from 19 hospitals) and post-intervention (414 out of 919 eligible staff from 18 hospitals) period. Four survey domains were identified: (1) hospital performance indicators, feedback, and training; (2) personal perceptions about thrombolysis evidence and implementation; (3) personal stroke skills and hospital stroke care policies; and (4) emergency and ambulance procedures. There was a significant pre- to post-intervention mean increase (0.21 95% CI 0.09; 0.34;p< 0.01) in scores relating to hospital performance indicators, feedback, and training; for the intervention hospitals compared to control hospitals. There was a corresponding increase in mean scores regarding perceptions about the
thrombolysis evidence and implementation (0.21, 95% CI 0.06; 0.36;p< 0.05). Sub-group analysis indicated that the improvements were restricted to nurses’responses.
(Continued on next page)
© The Author(s). 2019Open AccessThis article is distributed under the terms of the Creative Commons Attribution 4.0 International License (http://creativecommons.org/licenses/by/4.0/), which permits unrestricted use, distribution, and reproduction in any medium, provided you give appropriate credit to the original author(s) and the source, provide a link to the Creative Commons license, and indicate if changes were made. The Creative Commons Public Domain Dedication waiver (http://creativecommons.org/publicdomain/zero/1.0/) applies to the data made available in this article, unless otherwise stated. * Correspondence:[email protected]
1
School of Medicine and Public Health (SMPH), University of Newcastle (UoN), Callaghan, NSW, Australia
3Hunter Medical Research Institute (HMRI), New Lambton Heights, NSW,
Australia
(Continued from previous page)
Conclusion:TIPS resulted in changes in some aspects of nurses’perceptions relating to the evidence for intravenous thrombolysis and its implementation and hospital performance indicators, feedback, and training. However, there is a need to explore further strategies for influencing the views of physicians given limited statistical power in the physician sample.
Trial registration:ACTRN12613000939796, UTN: U1111–1145-6762.
Background
Implementation of evidence-based recommendations is critical to delivering optimal clinical care to patients and achieving improvements in health outcomes [1]. How-ever, the adoption of such recommendations into clinical practice often faces barriers [2] at the individual, organizational, and system levels [3].
Acute ischemic stroke (AIS) is one of the leading causes of mortality and morbidity globally [3] and in Australia [4]. Intravenous thrombolysis can improve clinical outcomes if administered within 4.5 h of symp-tom onset to eligible patients with AIS [5]. However, despite evidence of its efficacy and despite its inclusion in clinical guidelines [6], thrombolysis rates have remained persistently low over the last 10 years, at around 11% among all stroke cases [4]. Several potential barriers restricting the administration of intravenous thrombolysis in patients experiencing AIS [7] have been identified. At the individual level, Shiffman et al. demon-strated that physicians’ knowledge of the desired behav-ior could lead to improvements across quality indicators in emergency care [8]. Similarly, improved skills and
Contributions to the literature
This study demonstrated the ability of a multicomponent implementation intervention to influence the perceptions of
clinical staff regarding hospital performance indicators, feedback, and training; and their individual perceptions about the evidence base supporting poststroke thrombolysis and its implementation.
This change occurred in the context of a transient change in the proportion of patients receiving thrombolysis for acute stroke.
This study illustrates the importance of exploring processes as well as outcomes in the context of implementation trials, in that a change in clinician perceptions was achieved alongside a transient change in clinical practice. This suggests the need to further explore the perceptions/
practice nexus during implementation trials.
opportunities to perform the desired behavior led to in-creased staff confidence in the care of patients with chronic cardiac failure [9]. Additionally, individual staff attitudes were associated with adherence to clinical guidelines [10]. In the case of AIS, the strong evidence base has been shown to increase physicians’level of cer-tainty about the impact and administration of intraven-ous thrombolysis [11,12], and their familiarity with, and motivation to adhere to, recommended guidelines [7,
13]. At the health systems level, resources and a sup-portive workplace environment have been shown to positively influence evidence-based practice [3]. Ineffi-cient in-hospital processes for managing emergency stroke patients and a lack of appropriate infrastructure, staffing, and hospital capacity are known barriers to poor rates of intravenous thrombolysis [7,13]. As both physi-cians and nurses have a central role in thrombolysis, their perceptions and practices potentially influence intravenous thrombolysis rates [14,15].
from both professions. As there are known differ-ences between metropolitan and non-metropolitan hospitals such as staff experience, workload, infra-structure, etc. [20], the location of hospitals should be considered when assessing staff perceptions. Staff perceptions and practices are often explored using study-specific, non-validated measures. Therefore, wherever possible, it is important to identify the val-idity of the measure; for example, factor analysis can be used to assess how well a new measure captures the intended construct [21].
Therefore, the study aimed to (i) assess the validity of the staff survey measure through the exploratory factor analysis of the survey and (ii) investigate whether the perceptions and practices of the physi-cians and nurses involved in the TIPS study changed as a result of the TIPS intervention and whether any changes were specific to the practice group (physician or nurse) and hospital location (metropolitan or non-metropolitan).
Methods
Design and setting
The TIPS study recruited 20 hospitals across three states of Australia between 2011 and 2015. It evaluated the effectiveness of a multicomponent, multidisciplinary, collaborative intervention aimed at improving rates of intravenous thrombolysis [16, 17]. TIPS study hospitals were randomized to either receive the intervention activ-ities (intervention hospitals) or continue with usual care (control hospitals) [17]. This study includes two cross-sectional surveys: one during the pre-intervention (2012-mid 2013) and another during the post-intervention (2015) period. We used STrengthening the Reporting of OBservational studies in Epidemiology (STROBE) guide-line to report the study (Additional file 1). The survey was anonymous and administered to physicians and nurses employed in the participating hospitals [16].
TIPS intervention and its activities
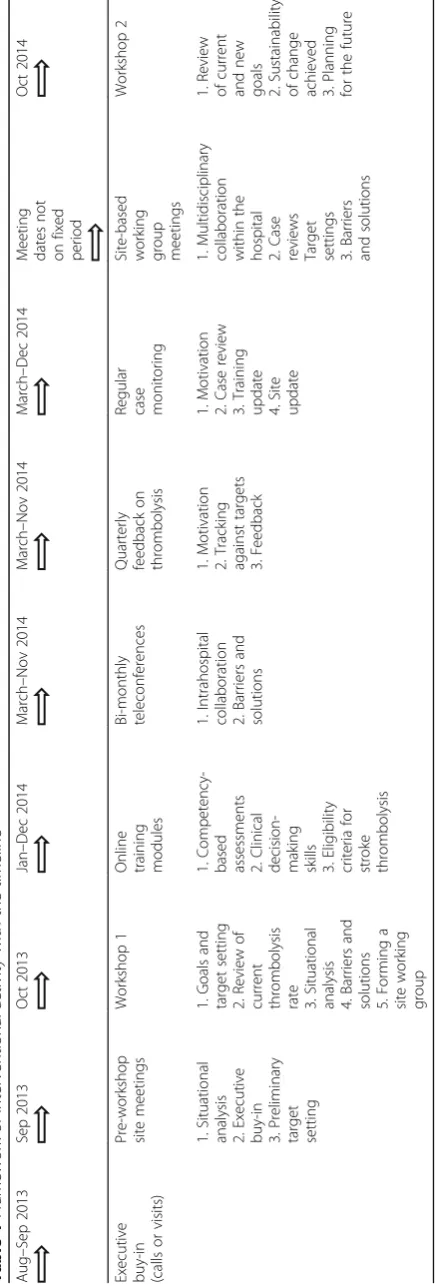
Intervention components were developed in accord-ance with the behavior change wheel [16] and strat-egies with a preferred emphasis on the following components of behavior change wheel: education, persuasion, training, modeling, and enablement. Seven intervention components were delivered actively over 16 months which included pre-workshop meetings, collaborative communal workshops, site-based work-ing groups, web-based trainwork-ing modules, regular tele-phone case monitoring, bi-monthly feedback of thrombolysis rate, and bi-monthly inter-site telecon-ferences. Intervention activities and the study timeline are described in Table 1.
Participants
All participating hospitals had a Stroke Unit or the staffing equivalent, and all were in the early stages of implement-ing intravenous thrombolysis. Participatimplement-ing hospitals in-cluded those that were publicly and privately funded and metropolitan and non-metropolitan based. Metropolitan and non-metropolitan hospitals were defined according to the Australian Standard Geographical Classification Remoteness Areas [22]. Eligible survey respondents were physicians and nurses who worked in the Stroke Units and/or the Emergency departments of the participating hospitals and had a role in assessing or managing acute stroke patients during the survey time period.
Procedure
Eligible survey participants were identified by a staff member within each hospital responsible for the organization of stroke care, and this was usually a nurse (survey coordinator). Eligible participants were invited to participate via a combination of email and personal communication. All surveys were completed in hard copy and these were deposited in collection boxes. The survey coordinator provided data on the estimated num-ber of eligible staff, the numnum-ber of surveys distributed, and the number returned.
Outcome measures
The survey was made up of 74 statements and in the first section, respondents were asked to rate their agreement using a five-point Likert Scale: Strongly disagree, disagree, agree, strongly agree, and not applicable [23] and the sec-ond section had some participants and hospital related in-formation. A copy of this survey has been added to this manuscript (Additional file2: Supplement 1). Survey items were selected from the previously published literature on behavior change and implementation of evidence-based practice. In addition, the National Stroke Foundation’s Clinical Guidelines for the management of Stroke and its recommendation for hospital facilities and evidence for intravenous thrombolysis was also considered to finalize the survey items [24, 25]. The survey items were also piloted by a team of behavioral researchers, stroke clini-cians, emergency physiclini-cians, and stroke nurses at the University of Newcastle and the Hunter New England Local Health District [26]. The survey was divided into two sec-tions and they are as follows.
Section A: stroke care and intravenous thrombolysis
Table 1 Framework of interventional activity with the ti meline Aug – Sep 2013 Sep 2013 Oct 2013 Jan – Dec 2014 March – Nov 2014 March – Nov 2014 March – Dec 2014 Mee ting dates not on fixe d period O ct 2014 Execut ive buy-i n (calls or vis its) Pre-wo rkshop site me eting s Workshop 1 O nline train ing mod ules Bi-mont hly teleconf erences Quarterly feedback on thrombo lysis Regu lar case monitori ng Site-based work ing group meeting s Work shop 2 1. Situational analy sis 2. Execut ive buy-i n 3. Preli minary target setting 1. Goals and target setting 2. Review of curre nt throm bolysis
rate 3.Situational analysi
patients for intravenous thrombolysis, hospital policy, and performance indicators for stroke care, impact, safety, and barriers to intravenous thrombolysis, the hospital’s monitoring and feedback systems, its emer-gency service, the protocol used to identify, treat and follow-up patients with stroke, and staff skills levels and staff training facilities. An example of a Section A statement is: “This hospital has goals for improving performance in stroke care”.
Section B: individual and hospital characteristics
This section was entitled “About You and Your Work-place” and included 14 questions. Of these, three were directed at physicians only, and one at nurses only. Questions investigated a respondent’s age, gender, role within the hospital, and the number of years worked in a stroke unit and/or stroke care. They also investigated a hospital’s intravenous thrombolysis rate, pre-arrival noti-fication system from the ambulance, responsibilities around data entry, the proportion of stroke patients seen by Emergency physicians, number of patients referred to stroke care, proportion treated with intravenous thromb-olysis, and the respondent’s role and responsibilities around intravenous thrombolysis. An example of a Sec-tion B statement is “Does the hospital have arrange-ments in place for pre-arrival notification of stroke patients from the ambulance service?”
Statistical analysis
Identifying construct validity and internal consistency
The frequencies and percentages of the responses for each statement were examined. An exploratory factor analysis was conducted on all statements, except those with > 20% missing values or “not applicable”responses, as they were assessed as having limited relevance [27]. A principal factors method was undertaken to identify the underlying factor structure [28]. The number of factors to retain was determined by assessing the following cri-teria: (i) the Kaiser-Criteria (eigenvalue more than 1 rule); (ii) the break in the scree plot; and (iii) assessment of parallel analysis [29]. The number of factors suggested by these three criteria oblique rotation was done and the results of each assessed and compared to determine the most appropriate factor structure [29]. The final factor structure was determined as the structure that met the following criteria: items loading on only one factor≥0.4, minimal cross-loadings between items [30], and the structure that makes conceptual sense (Additional file2: Supplement 3). Finally, to check and measure the reli-ability and internal consistency of the final factor struc-ture, the Cronbach’s alpha coefficient for each selected factor was calculated [31].
Calculation of scores
Following factor analysis, each selected factor was defined as a domain. Domain scores were calculated for each participant, by summing all statement responses in a domain and dividing them by the number of non-missing statements. The total score for each domain for each participant was four. Likert responses were allo-cated a score of strongly disagree = 1, disagree = 2, agree = 3, and strongly agree = 4. Only those who responded to at least 75% of the statements within each domain were calculated a domain score [32].
Measuring the effect of the intervention
Separate linear mixed models were conducted for each domain score to identify whether staff statements differed in response to the intervention. Between-group differences in the change in mean staff responses from pre-intervention to post-intervention were assessed. In each model, the main effect for the intervention group and time were included as fixed effects as well a group by time interaction term. Baseline thrombolysis rate was also included as a fixed effect in all models to control for this factor. A random intercept for the hospital was included to account for the clustered design of the trial. To assess our secondary aim, similar models were also conducted separately by profession (i.e., physician and nurse) and geographical location (i.e., metropolitan and non-metropolitan) to allow for assessment of these fac-tors as potential effect modifiers. Due to violations in the assumption of homoscedasticity, robust errors were employed for models assessing domain 1 and 2 of staff barriers. For domain, three and four bootstrap estima-tion was employed due to violaestima-tions in the assumpestima-tion of normality.
Results
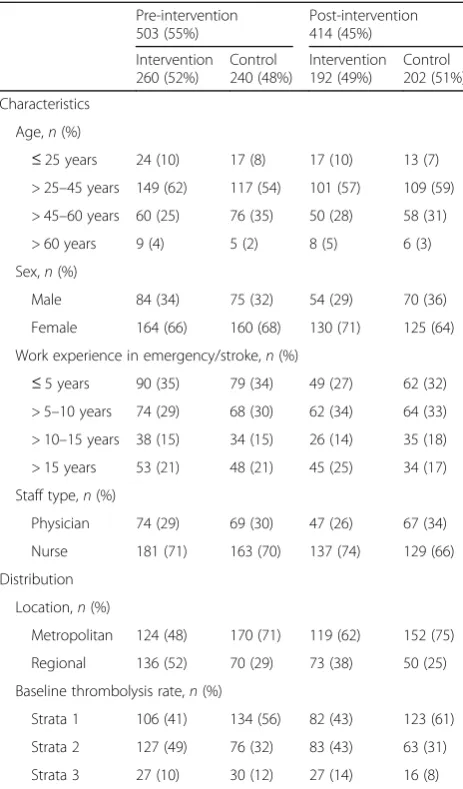
All 20 TIPS hospitals were invited to participate in the staff survey; 19 hospitals participated in the pre-intervention survey and 18 of those participated in the post-intervention survey. During the pre-intervention period, of the 1127 eligible staff, 503 returned completed surveys, whereas during the post-intervention period, of the 919 eligible staff, 414 returned completed surveys, equating to a 45% response rate for both surveys. Table2
reports respondents’characteristics against the interven-tion and control hospitals and the pre- and post-intervention surveys.
and its implementation. Domain 3 included six statements related to staff stroke care skills and hospital stroke care policies. Domain 4 included four statements related to emergency and ambulance procedures. The Cronbach’s alphas for domain 1, 2, 3, and 4 were 0.90, 0.79, 0.80, and 0.85 respectively.
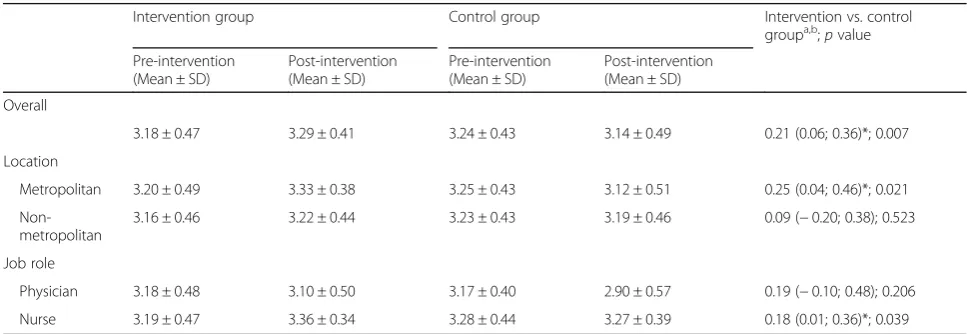
When comparing results between the control and intervention hospitals, the domain 1 mean score in the intervention hospitals showed a significant mean in-crease of 0.21 (95% CI 0.09; 0.34;p< 0.01) from the pre-to the post-intervention surveys (Table 3), indicating a positive change in staff perceptions relating to hospital performance indicators, feedback, and training. Similarly, the domain 2 mean score showed a significant increase of 0.21 (95% CI 0.06; 0.36;p< 0.05) (Table4), indicating a positive change in staff perceptions relating to the evi-dence supporting thrombolysis and its implementation.
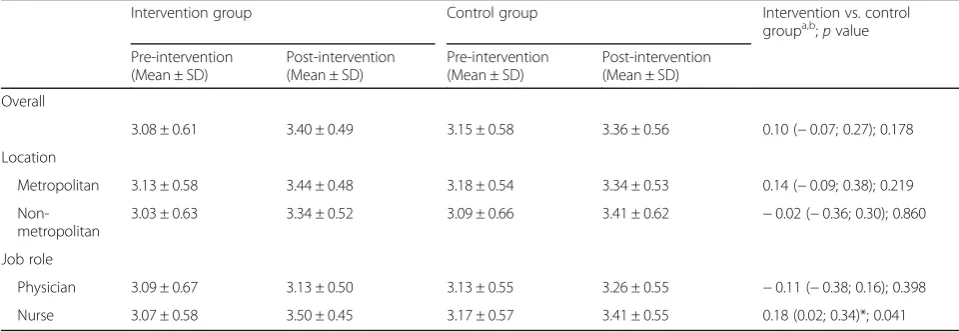
The between-group differences for domains 3 and 4 were not significant indicating no change in staff percep-tions relating to the individual’s level of stroke care skills, the hospital’s stroke care policies, and/or the emergency and ambulance procedures (Tables5and6).
When comparing results between physicians and nurses, the domain 1, 2, and 4 mean scores in nurses showed a significant mean increase of 0.25 (95% CI 0.06; 0.44; p< 0.05), 0.18 (95% CI 0.01; 0.36; p < 0.05), and 0.18 (95% CI 0.02; 0.34) respectively. This indicated a change in nurses’ perceptions toward hospital perform-ance indicators, feedback and training, thrombolysis evi-dence base, and its implementation along with emergency and ambulance service procedure, which was not present in physicians. Moreover, the sub-group ana-lysis based on emergency and stroke care physicians was also no longer significant.
When comparing results between metropolitan and non-metropolitan hospitals, the domain 1 mean score in the non-metropolitan hospitals showed a significant mean increase of 0.26 (95% CI 0.17; 0.35;p< 0.001) indi-cating a change in staff perception related to hospital performance indicators, feedback, and training. In do-main 2, the mean score in the metropolitan hospitals showed a significant mean increase of 0.25 (95% CI 0.04; 0.46;p< 0.05), indicating a change in staff perception re-lated to the evidence supporting thrombolysis and its implementation. There were no significant differences in domains 3 and 4.
Discussion
This is the first study to evaluate the effect of an imple-mentation intervention aimed at increasing rates of intravenous thrombolysis on physicians’and nurses’ per-ceptions utilizing a psychometrically tested tool for as-sessment on self-reported behavior. The asas-sessment of the validity of the survey tool indicated that a four-factor structure with items loading on only one factor ≥0.4, minimal cross-loadings between items, and a structure that makes conceptual sense. Thus, the content validity of structure was supported. Moreover, all the domains had satisfactory internal consistency reliability, measured through Cronbach’s alpha; ranged 0.79–0.90. Therefore, the survey was considered an appropriate tool for asses-sing physicians’and nurses’perceptions. The TIPS inter-vention appeared to have some influence as would be expected according to the BCW framework, via strat-egies such as education and training. The intervention appeared to be effective in changing the perceptions of clinical staff in relation to their hospitals’ performance indicators, feedback and training, and their individual perceptions about the evidence base supporting post-stroke thrombolysis and its implementation. However, this appeared to be the case only for nurses.
Table 2Difference in participants’distribution and
characteristics between intervention and control hospitals for both pre-intervention and post-intervention survey
Pre-intervention 503 (55%)
Post-intervention 414 (45%)
Intervention 260 (52%)
Control 240 (48%)
Intervention 192 (49%)
Control 202 (51%)
Characteristics
Age,n(%)
≤25 years 24 (10) 17 (8) 17 (10) 13 (7)
> 25–45 years 149 (62) 117 (54) 101 (57) 109 (59)
> 45–60 years 60 (25) 76 (35) 50 (28) 58 (31)
> 60 years 9 (4) 5 (2) 8 (5) 6 (3)
Sex,n(%)
Male 84 (34) 75 (32) 54 (29) 70 (36)
Female 164 (66) 160 (68) 130 (71) 125 (64)
Work experience in emergency/stroke,n(%)
≤5 years 90 (35) 79 (34) 49 (27) 62 (32) > 5–10 years 74 (29) 68 (30) 62 (34) 64 (33)
> 10–15 years 38 (15) 34 (15) 26 (14) 35 (18)
> 15 years 53 (21) 48 (21) 45 (25) 34 (17)
Staff type,n(%)
Physician 74 (29) 69 (30) 47 (26) 67 (34)
Nurse 181 (71) 163 (70) 137 (74) 129 (66)
Distribution
Location,n(%)
Metropolitan 124 (48) 170 (71) 119 (62) 152 (75)
Regional 136 (52) 70 (29) 73 (38) 50 (25)
Baseline thrombolysis rate,n(%)
Strata 1 106 (41) 134 (56) 82 (43) 123 (61)
Strata 2 127 (49) 76 (32) 83 (43) 63 (31)
Several studies have highlighted the use of constructive monitoring and feedback as a strategy for achieving posi-tive changes in hospital-level performance [33, 34]. Moreover, identifying strategic goals is widely used as a means of enhancing organizational motivation, adher-ence, and autonomy, and in turn, improving processes of care [35, 36]. Hospital performance indicators such as those assessed in the survey can facilitate patient choice, can promote accountability, and finally can increase the quality of patient care [37]. In addition, stroke survivors are known to have complex needs and therefore, require the presence of a multidisciplinary team with specialized knowledge, skills, and experience in stroke [38]. The
development and delivery of stroke-specific education are therefore of vital importance to the provision of high-quality stroke care and to improve outcomes for people who have experienced stroke. TIPS intervention, utilized a“monitoring-evaluation-feedback” strategy that involved site-based leaders where the primary change agents provided regular feedback and conducted moni-toring to site champions at each hospital via phone calls throughout the intervention phase, and a knowledge translation strategy that provided web-based training modules, case monitoring, and problem-solving activities [17]. Such knowledge translation strategies have been demonstrated to improve health professionals’perceptions Table 3Effect of intervention on domain 1 score = performance indicator, feedback and training
Intervention group Control group Intervention vs. control
groupa,b;pvalue
Pre-intervention (Mean ± SD)
Post-intervention (Mean ± SD)
Pre-intervention (Mean ± SD)
Post-intervention (Mean ± SD)
Overall
2.95 ± 0.48 3.17 ± 0.47 3.03 ± 0.50 3.02 ± 0.46 0.21 (0.09; 0.34)**; 0.001
Location
Metropolitan 3.07 ± 0.52 3.21 ± 0.47 3.04 ± 0.50 3.03 ± 0.49 0.15 (−0.07; 0.37); 0.175
Non-metropolitan
2.83 ± 0.40 3.11 ± 0.47 2.99 ± 0.51 2.99 ± 0.41 0.26 (0.17; 0.35)***; 0.000
Job role
Physician 2.94 ± 0.41 3.05 ± 0.45 2.99 ± 0.51 2.96 ± 0.41 0.12 (−0.08; 0.31); 0.243
Nurse 2.95 ± 0.50 3.19 ± 0.47 3.07 ± 0.48 3.05 ± 0.46 0.25 (0.06; 0.44)*; 0.010
*pvalue < 0.05 considered as significant **pvalue < 0.01 considered as significant ***pvalue < 0.001 considered as significant a
Change from pre-intervention to post-intervention survey b
Linear mixed model controlled for category based on baseline thrombolysis rate
Table 4Effect of intervention on domain 2 score = perceptions about the evidence base for intravenous thrombolysis and its implementation
Intervention group Control group Intervention vs. control
groupa,b;pvalue
Pre-intervention (Mean ± SD)
Post-intervention (Mean ± SD)
Pre-intervention (Mean ± SD)
Post-intervention (Mean ± SD)
Overall
3.18 ± 0.47 3.29 ± 0.41 3.24 ± 0.43 3.14 ± 0.49 0.21 (0.06; 0.36)*; 0.007
Location
Metropolitan 3.20 ± 0.49 3.33 ± 0.38 3.25 ± 0.43 3.12 ± 0.51 0.25 (0.04; 0.46)*; 0.021
Non-metropolitan
3.16 ± 0.46 3.22 ± 0.44 3.23 ± 0.43 3.19 ± 0.46 0.09 (−0.20; 0.38); 0.523
Job role
Physician 3.18 ± 0.48 3.10 ± 0.50 3.17 ± 0.40 2.90 ± 0.57 0.19 (−0.10; 0.48); 0.206
Nurse 3.19 ± 0.47 3.36 ± 0.34 3.28 ± 0.44 3.27 ± 0.39 0.18 (0.01; 0.36)*; 0.039
*pvalue < 0.05 considered as significant **pvalue < 0.01 considered as significant ***pvalue < 0.001 considered as significant a
Change from pre-intervention to post-intervention survey b
of evidence-based approaches and their implementation [39,40]. However, why this was more effective in nurses, as opposed to physicians, in our study is uncertain.
Failure of the TIPS intervention to change the perceptions of physicians may be due to limited stat-istical power (n= 74 physicians). However, the evi-dence does indicate that it can be challenging to change physicians’ perceptions about their clinical practice because they are long-standing and widely held [41, 42]. It is possible that physicians are more cautious in these potentially high-risk circumstances, given their level of responsibility for decision-making. Finally, an additional explanation may be that more nurses than physicians were engaged with
the TIPS online learning modules made available to participants [17].
Hospital policies are often difficult to change as they involve complex systems [37, 38]. Given this complexity and a very limited focus on policy in the TIPS interven-tion, it is perhaps unsurprising that no change was found for the domain scores related to hospital policy and indi-vidual skills. While skills may be more amenable to change than policies, a ceiling effect may have been evi-dent in relation to skills: According to results from the pre-intervention survey [26], most participants in the TIPS were skilled in post-stroke thrombolysis. For example, 98% could correctly assess stroke and 83% could correctly identify patients eligible for intravenous Table 5Effect of intervention on domain 3 score = personal stroke skills and hospital stroke care policies
Intervention group Control group Intervention vs. control
groupa,b;pvalue
Pre-intervention (Mean ± SD)
Post-intervention (Mean ± SD)
Pre-intervention (Mean ± SD)
Post-intervention (Mean ± SD)
Overall
3.48 ± 0.45 3.60 ± 0.39 3.48 ± 0.47 3.55 ± 0.43 0.04 (−0.10; 0.18); 0.597
Location
Metropolitan 3.52 ± 0.45 3.65 ± 0.36 3.48 ± 0.47 3.59 ± 0.39 0.01 (−0.10; 0.13); 0.828
Non-metropolitan
3.44 ± 0.45 3.52 ± 0.43 3.46 ± 0.47 3.46 ± 0.51 0.09 (−v0.14; 0.22); 0.601
Job role
Physician 3.49 ± 0.43 3.63 ± 0.40 3.48 ± 0.48 3.57 ± 0.40 0.04 (−0.14; 0.22); 0.696
Nurse 3.49 ± 0.45 3.59 ± 0.39 3.48 ± 0.47 3.54 ± 0.46 0.04 (−0.13; 0.21); 0.670
*pvalue < 0.05 considered as significant **pvalue < 0.01 considered as significant ***pvalue < 0.001 considered as significant a
Change from pre-intervention to post-intervention survey b
Linear mixed model controlled for category based on baseline thrombolysis rate
Table 6Effect of intervention on domain 4 score = perceptions toward emergency service
Intervention group Control group Intervention vs. control
groupa,b;pvalue
Pre-intervention (Mean ± SD)
Post-intervention (Mean ± SD)
Pre-intervention (Mean ± SD)
Post-intervention (Mean ± SD)
Overall
3.08 ± 0.61 3.40 ± 0.49 3.15 ± 0.58 3.36 ± 0.56 0.10 (−0.07; 0.27); 0.178
Location
Metropolitan 3.13 ± 0.58 3.44 ± 0.48 3.18 ± 0.54 3.34 ± 0.53 0.14 (−0.09; 0.38); 0.219
Non-metropolitan
3.03 ± 0.63 3.34 ± 0.52 3.09 ± 0.66 3.41 ± 0.62 −0.02 (−0.36; 0.30); 0.860
Job role
Physician 3.09 ± 0.67 3.13 ± 0.50 3.13 ± 0.55 3.26 ± 0.55 −0.11 (−0.38; 0.16); 0.398
Nurse 3.07 ± 0.58 3.50 ± 0.45 3.17 ± 0.57 3.41 ± 0.55 0.18 (0.02; 0.34)*; 0.041
*pvalue < 0.05 considered as significant **pvalue < 0.01 considered as significant ***pvalue < 0.001 considered as significant a
Change from pre-intervention to post-intervention survey b
thrombolysis. The result from Grady et al. [25] was very similar, i.e., 98% of emergency physicians reported they could identify a stroke patient clearly, and 76% could identify patients eligible for intravenous thrombolysis. Finally, perceptions related to emergency services were not part of the TIPS intervention which accords with the null finding in relation to the domain score regarding perception toward emergency care.
Unfortunately, the study struggled with several limita-tions. As mentioned before, the number of participating physicians was low, which may have limited the study’s statistical power in relation to physician data, and the data were self-reported. The study was also not powered to evaluate the effect of the changes in perception at an individual site level. Therefore, the study suggests a need to explore in more depth (e.g., via more comprehensive mixed methods) the experience of the staff involved in implementation interventions and intervention uptake/ adherence to developing better and sustainable interven-tion for the future.
Conclusion
The TIPS intervention appeared to have more impact on changing the perception of nurses than physicians, par-ticularly in the domains of hospitals’ performance, and feedback and training and perceptions about the thrombolysis evidence and its implementation. This fur-ther reinforces evidence about how challenging it is to change clinical practice and to effectively and efficiently bridge the evidence-practice gap.
Supplementary information
Supplementary informationaccompanies this paper athttps://doi.org/10. 1186/s13012-019-0940-0.
Additional file 1.STROBE Statement.
Additional file 2.Supplement 1. Domains selected by factor analysis. Supplement 2. Domains selected by factor analysis. Supplement 3. Conceptual sense for the Factor structure.
Abbreviations
AIS:Acute ischemic stroke; ASGC: Australian Standard Geographical
Classification; NHMRC: National Health and Medical Research Council; NSW: New South Wales; TIPS: Thrombolysis ImPlementation in Stroke
Acknowledgments
We are thankful to all staffs and patients from the participating hospitals for their kind participation and support during the study period.
Authors’contributions
MGH, CLP, and CRL designed and prepared the study concept. MGH and AH analyzed the data with advice from CLP and CO. MGH drafted the manuscript with advice from CLP, JRA, AR, AG, AJ, AH, CO, IH, and CRL on the method of data analysis and presentation of results. CLP, JRA, AR, AG, AJ, AH, CO, IH, and CRL were involved in critical revision of the manuscript. All authors read and approved the final manuscript.
Funding
This study was funded by the National Health and Medical Research Council (NHMRC) partnership grant (569328), part-funded by an NHMRC Practitioner Fellowship (1043913) and NHMRC Translating Research Into Practice fellow-ship, and included partnership grant contribution funding from Boehringer Ingelheim, in-kind support from Agency for Clinical Innovation Stroke Care Network/Stroke Services New South Wales (NSW), Stroke Foundation and NSW Cardiovascular Research Network-National Heart Foundation, with a cash contribution from the Victorian Stroke Clinical Network and infrastruc-ture funding from the Hunter Medical Research Institute and The University of Newcastle.
Availability of data and materials
The datasets used and/or analyzed during the current study are available from the corresponding author on reasonable request.
Ethics approval and consent to participate
Ethical approval was obtained from the Hunter New England Human Research Ethics Committee and from the University of Newcastle, Human Research Ethics Committee. Written informed consent was taken from all the participants.
Consent for publication
Not applicable.
Competing interests
The authors declare that they have no competing interests.
Author details 1
School of Medicine and Public Health (SMPH), University of Newcastle (UoN), Callaghan, NSW, Australia.2The Sydney Partnership for Health,
Education, Research & Enterprise (SPHERE), Liverpool, NSW, Australia.3Hunter Medical Research Institute (HMRI), New Lambton Heights, NSW, Australia.
4
Hunter New England Local Health District, Population Health, Wallsend, NSW, Australia.5Priority Research Centre for Health Behaviour, University of
Newcastle, Callaghan, NSW, Australia.6John Hunter Hospital, New Lambton Heights, NSW, Australia.
Received: 23 May 2019 Accepted: 23 September 2019
References
1. Grol R. Successes and failures in the implementation of evidence-based
guidelines for clinical practice. Med Care. 2001;39(8 suppl 2):II46–54.
2. Carey M, Buchan H, Sanson-Fisher R. The cycle of change: implementing
best-evidence clinical practice. Int J Qual Health Care. 2009;21:37–43.
3. Kuklina EV, Tong X, George MG, Bansil P. Epidemiology and prevention of
stroke: a worldwide perspective. Expert Rev Neurother. 2012;12(2):199–208.
4. Stroke Foundation. Interim response to ACEM thrombolysis review.
Published on: 24 2016 Published on: Aug 7, 2014 cited on: may 10, 2017.
Available on:
https://strokefoundation.org.au/News/2016/03/24/Interim-Response-to-ACEM-review-of-tPA
5. Lees KR, Bluhmki E, von Kummer R, et al. ECASS, ATLANTIS, NINDS and
EPITHET rt-PA study group. Time to treatment with intravenous alteplase and outcome in stroke: an updated pooled analysis of ECASS, ATLANTIS,
NINDS, and EPITHET trials. Lancet 2010;375(9727):1695–1703.
6. Stroke Foundation. Clinical guidelines for stroke management 2017.
Available on:
https://informme.org.au/Guidelines/Clinical-Guidelines-for-Stroke-Management-2017. Accessed on: 4 January, 2019.
7. Eissa A, Krass I, Bajorekt BV. Barriers to the utilization of thrombolysis in
acute ischemic stroke. J Clin Pharm Ther, 2012, 37, 399–409.
8. Shiffman RN, Dixon J, Brandt C, Essaihi A, Hsiao A, Michel G,et al. The
guideline implementability appraisal (GLIA): development of an instrument to identify obstacles to guideline implementation. BMC Med Inform Decis Mak 2005; 5:23.
9. Asch SM, Baker DW, Keesey JW, Broder M, Schonlau M, et al. Does the
collaborative model improve care for chronic heart failure? Med Care 2005;
43(7):667–675.
10. Grol R, Dalhuijsen J, Thomas S, Veld C. Attributes of clinical guidelines that
influence use of guidelines in general practice: observational study. BMJ
11. Meurer WJ, Majersik JJ, Frederiksen SM, Kade AM, Sandretto AM, Scott PA. Provider perceptions of barriers to the emergency use of tPA for acute ischemic stroke: a qualitative study. BMC emerg. 2011;11:5.
12. Kwan J, Hand P, Sandercock P. Improving the efficiency of delivery of
thrombolysis for acute stroke: a systematic review. QJM. 2004;97:273–9.
13. Ehlers L, Groth L, Bech M, Andersen G, Kjølby M. Organisational barriers to
thrombolysis treatment of acute ischaemic stroke. Curr Med Res Opin. 2002;
23:2833–9.
14. Morgenstern LB, Bartholomew LK, Grotta JC, Staub L, King M, Chan W.
Sustained benefit of a community and professional intervention to increase
acute stroke therapy. Arch Intern Med. 2003 Oct 13;163(18):2198–202.
15. Scott PA, Meurer WJ, Frederiksen SM, et al. A multilevel intervention to
increase community hospital use of alteplase for acute stroke (INSTINCT): a
cluster-randomised controlled trial. Lancet Neurol 2012; 12(2):139–148.
16. Paul CL, Levi CR, D'Este CA, Parsons MW, Bladin CF, Lindley RI, et al.
Thrombolysis ImPlementation in stroke (TIPS): evaluating the effectiveness
of a strategy to increase the adoption of best evidence practice—protocol
for a cluster randomised controlled trial in acute stroke care. Implement Sci. 2014;9:38.
17. Levi CR, Attia JR, D’Este C, et al. A cluster randomised trial of thrombolysis
implementation support in metropolitan and regional Australian stroke centres; lessons for individual and systems behaviour change (Unpublished).
18. Baatiema L, Otim ME, Mnatzaganian G,de-Graft Aikins A, Coombes J,
Somerset S. Health professionals' views on the barriers and enablers to evidence-based practice for acute stroke care: a systematic review. Implement Sci. 2017; 12(1):74.
19. Huang CH, Wu HH, Lee YC. The perceptions of patient safety culture: a
difference between physicians and nurses in Taiwan. Appl Nurs Res. 2018;
40:39–44.
20. Australian Bureau of Statistics (ABS) 2017. Health service usage and health
related actions, Australia 2014–15. ABS cat. No. 4364.0.55.002. Canberra: ABS.
21. Gorsuch RL. Exploratory factor analysis: its role in item analysis. J Pers Assess.
1997;68(3):532–60.
22. Australian Government Department of Health. Remoteness classification
systems. Available on:http://www.health.gov.au/internet/publications/
publishing.nsf/Content/work-res-ruraud-toc~work-res-ruraud-lis~work-res-ruraud-lis-eAcessed on: 7 January, 2019.
23. Sullivan GM, Artino AR. Analyzing and interpreting data from likert-type
scales. J Grad Med Educ 2013;5(4):541–542.
24. Grady A, Bryant J, Carey M, Paul C, Sanson-Fisher R. Enablers of the
implementation of tissue plasminogen activator in acute stroke care: a cross-sectional survey. 2014; PLoS ONE 9(12): e114778.
25. Grady AM, Bryant J, Carey ML, Paul CL, Sanson-Fisher RW, Levi CR.
Agreement with evidence for tissue plasminogen activator use among emergency physicians: a cross-sectional survey. BMC Res Notes. 2015;8:267.
26. Paul CL, D’Este CA, Ryan A, Attia JR, Oldmeadow C, Kerr E, Henskens F,
Grady A, Levi CR. Staff perspectives from Australian hospitals seeking to improve implementation of thrombolysis Care for Acute Stroke. SAGE Open Med 2019; 7: 2050312119865656.
27. Schmitt N. Uses and abuses of coefficient alpha. Psychol Assess. 1996;8(4):
350–3.
28. Brunius Enlund K, Brunius C, Hanson J, Hagman R, Höglund OV, Gustås P,
et al. Development and validation of two questionnaires: dental home care and dental health in Swedish dogs. PLoS One. 2019;14(1):e0204581.
29. Asún RA, Rdz-Navarro K, Alvarado JM. Developing multidimensional Likert
scales using item factor analysis: the case of four-point items. Sociol
Methods Res. 2016;45(1):109–33.
30. Costello AB, Osborne JW. Best practices in exploratory factor analysis: four
recommendations for getting the most from your analysis. Practical Assessment Research & Evaluation. 2005;10(7)
31. Floyd FJ, Widaman KF. Factor analysis in the development and refinement
of clinical assessment instruments. Psychol Assess. 1995;7(3):286–99.
32. Trockel M, Bohman B, Lesure E, Hamidi MS, Walle D, Roberts L, et al. A brief
instrument to assess both burnout and professional fulfillment in physicians: reliability and validity, including correlation with self-reported medical errors, in a sample of resident and practicing physicians. Acad Psychiatry
2017;42(1):11–24.
33. Majeed A, Lester H, Bindman A. Improving the quality of care with
performance indicators. BMJ. 2007;335:916–8.
34. Marrshall M, Campbell S, Hacker J, Roland M. Quality indicators for general
practice. London: Royal Society of Medicine; 2002.
35. Wade DT. Goal planning in stroke rehabilitation: why? Top Stroke Rehabil
1999; 6:1–7.
36. Levack WM, Dean SG, Siegert RJ, McPherson KM. Purposes and mechanisms
of goal planning in rehabilitation: the need for a critical distinction. Disabil
Rehabil. 2006;28:741–9.
37. Botje D, Ten Asbroek G, Plochg T, Anema H, Kringos DS, Fischer C, Wagner C,
Klazinga NS. Are performance indicators used for hospital quality
management: a qualitative interview study amongst health professionals and quality managers in the Netherlands. BMC Health Serv Res. 2016;16(1):574.
38. Jones SP, Miller C, Gibson JME, Cook J, Price C, Watkins CL. The impact of
education and training interventions for nurses and other health care staff involved in the delivery of stroke care: an integrative review. Nurse Educ
Today. 2018;61:249–57.
39. Brownson RC, Fielding JE, Maylahn CM. Evidence-based public health: a
fundamental concept for public health practice. Annu Rev Public Health.
2009;30:175–201.
40. Nutley S, Walter I, Davies H. From knowing to doing: a framework for
understanding the evidence into practice agenda. Eval Program Plann.
2003;9:125–48.
41. Mostofian F, Ruban C, Simunovic N, Bhandari M. Changing physician
behavior: what works? Am J Manag Care. 2015;21(1):75–84.
42. Alvanzo AAH, Cohen GM, Nettleman M. Changing physician behavior:
half-empty or half-full? Clinical Governance. 2003;8(1):69–78.
Publisher’s Note