R E S E A R C H A R T I C L E
Open Access
Turkish version of the Yale Food Addiction
Scale: preliminary results of factorial
structure, reliability, and construct validity
Zehra Buyuktuncer
1*, Asl
ı
Akyol
1, Aylin Ayaz
1, Reyhan Nergiz-Unal
1, Burcu Aksoy
1, Erdal Cosgun
2, P
ı
nar Ozdemir
3,
Gulden Pekcan
1and Halit Tanju Besler
1Abstract
Background:Yale Food Addiction Scale (YFAS) was established to identify individuals exhibiting signs of addiction towards certain types of food. This study aimed to develop a Turkish version of the Yale Food Addiction Scale and test its psychometric properties.
Methods:The backward translation techniques were used to develop Turkish versions of the YFAS, and its reproducibility was assessed. Turkish version of the YFAS was administered to a total of 1033 participants (439 men and 594 women), aged 19–65 years. Exploratory factor analysis and confirmatory factor analysis were used to examine the factorial structure of the tool. Construct validity was assessed by principal component factor analysis with varimax rotation. Reliabilities were estimated with Cronbach’s alpha coefficient. The criterion-related validity was tested by the administration of Eating Attitude Test-26 (EAT-26) to all participants.
Results:The primary factor loadings for seven items were ranged between 0.45 and 0.79, and no items cross-loaded onto other factors. The fit indices showed that eight items of the YFAS were a good representation of the item responses and each item loaded significantly on the specified factor (p< 0.001 for each). YFAS subscales had a high internal consistency and test–retest reliability. The criterion-related validity of the tool showed a positive relationship with scales of the EAT-26.
Conclusion:Current study suggested that the Turkish version of the YFAS is a reliable, valid, and useful tool for assessing the signs of food addiction in a non-clinical sample.
Keywords:Food addiction, Yale Food Addiction Scale, Psychometric properties, Validation, Turkish population
Background
The prevalence of obesity and overweight continues to increase dramatically [1]. It has been estimated that 60% of men and 50% of women could be clinically obese by the year 2050 [2]. The determinative effect of environ-mental factors such as eating habits and nutrition on the development of obesity has been well established [3–5]. However, recent reports suggest that lifestyle-related prevention and treatment strategies do not result in complete success over the long term [6, 7]. One of the main reasons for this outcome has been attributed to
individual food preferences [8,9]. According to this the-ory, palatable foods that are rich in sugar, fat, and energy may create an addictive response and lead individuals to consume more [10]. Thus, lifestyle modifications toward healthy choices become difficult to maintain. A limited number of studies indicated that food addiction preva-lence was found to be high in individuals who were obese and had binge-eating disorders [11–14]. This may explain the relationship between food addiction and a continuous drive to eat in obesity [15].
A biological basis for food addiction has been shown in several studies [16–18]. Interestingly, these studies re-vealed that food addiction mechanisms exhibited path-ways similar to those seen in drug addiction [19]. Hedonic nutrition, which can be described as consumption of food
© The Author(s). 2019Open AccessThis article is distributed under the terms of the Creative Commons Attribution 4.0 International License (http://creativecommons.org/licenses/by/4.0/), which permits unrestricted use, distribution, and reproduction in any medium, provided you give appropriate credit to the original author(s) and the source, provide a link to the Creative Commons license, and indicate if changes were made. The Creative Commons Public Domain Dedication waiver (http://creativecommons.org/publicdomain/zero/1.0/) applies to the data made available in this article, unless otherwise stated.
* Correspondence:[email protected]
1Department of Nutrition and Dietetics, Faculty of Health Sciences,
Hacettepe University, 06230 Ankara, Turkey
principally because of its palatability, rather than its nutri-tional value, was shown to be associated with the food re-ward system in the brain [20]. Mounting evidence substantiates that neurotransmitters such as dopamine, opioid peptides, and related pathways play important roles in hedonic nutrition and food addiction [21–24]. The main findings of these studies imply that in some cases, the drive to eat palatable foods increases with these acti-vated neuronal circuits, and these biological mechanisms may lead to addiction through learned experiences over a period of time.
Taste is a significant factor in food intake [25]. Although many other factors such as nutritional value, cost, and availability are also important in food intake, the deterministic effect of sensory appeal in food prefer-ence was reported [26]. In addition to a biological inter-action between taste and addiction, behavioral outcomes were also observed in both human and animal models. In a rat model, postponed acetylcholine satiation re-sponse, greater sucrose intake, and increased dopamine secretion were reported after following a 10% sucrose solution and chow diet for 21 days [27]. Similar results were obtained in various studies, suggesting that in ani-mal models, sugar bingeing could be related to addiction [28,29]. Food addiction was also shown to have evolved from excessive intake of varied nutrients; thus, it may be subtyped [30]. Although human studies are very limited in this field of research, the evidence that sugar may exert even bigger effects than addictive drugs [31] makes the topic crucial in terms of public health and the health status of future generations.
The implication and translation of food addiction the-ory in humans is an important area of research. Despite the lack of a consensus opinion on diagnostic criteria for food addiction [32]. Gearhardt et al. suggested that food addiction be classed with drug addiction in the Diagnos-tic and StatisDiagnos-tical Manual of Mental Disorders-IV (DSM-IV) [13]. The Yale Food Addiction Scale (YFAS), which is based upon DSM-IV, was developed to deter-mine the presence of food addiction in those with at least three addiction symptoms for at least 1 year [33]. Basically, the YFAS quantifies the inability to limit con-sumption of specific foods despite repeated attempts, the nutritional behaviors that conflict with social and profes-sional activities, and the degree of deprivation signs when specific foods were kept away [32].
To date, the YFAS has been validated in a non-clinical sample of children [34] and those obtaining weight-loss surgery [35] in French [36] and in Chinese [37]. Because cultural and socio-demographic features of populations vary largely, language validation of such tools is import-ant for defining eating behaviors in various populations. Currently, a tool defining food addiction exists in Turkish [38]. However, this tool has been developed and
validated on a smaller sample size with a limited age range. Therefore, the aim of this study was to test the Turkish version of the YFAS in a non-clinical and a lar-ger sample that represents the public more extensively.
Methods
Participants and recruitment
A total of 1033 Turkish adults who were students or em-ployees at Hacettepe University voluntarily participated in this study. The study sample consisted of 439 men and 594 women aged 19 to 65 years. Mean age was of 31.1 ± 11.78 years. The sample consisted of 41.8% were university students and 58.2% were employees; more than half (57.8%) graduated from high school, 30.9% graduated from college, and 11.3% graduated from secondary school or had less education. Students or em-ployees in the Department of Nutrition and Dietetics were excluded from the study because their awareness of eating behavior might be different than in the general population. Pregnant or lactating women were also excluded because eating behaviors might change during that time of life. No other particular inclusion or exclusion criteria were used. The study protocol was ap-proved by the Ethics Committee of Hacettepe University, and written informed consent was obtained from all participants.
Participants were recruited via email and announce-ments posted in several locations, such as the cafeteria, sport hall, library, and classrooms. An appointment was provided for each volunteer at the Nutrition Education and Research Unit in the Department of Nutrition and Dietetics. Researchers provided verbal and visual infor-mation on how to respond to items in each question-naire. The participants spent about 30 min taking questionnaires (YFAS, Eating Attitudes Test-26 [EAT-26], and a demographics questionnaire). Reproducibility of the Turkish version of the YFAS was assessed by ap-plying it twice within a 3-week interval to a sample of 1018 participants.
Instruments
Yale Food Addiction Scale
food caused clinically significant impairment was assessed separately. A continuous “symptom count,” indicating the number of dependence symptoms, and a dichotomous “diagnostic” score, indicating that an indi-vidual met the criteria for food addiction if he or she presented three or more symptoms and reported clinic-ally significant impairment and/or distress were calcu-lated. A total symptom count score was calculated for those meeting the criteria for the seven symptoms. Meeting the criteria for three or more of these domains was considered to indicate food addiction [33].
After the English version of the YFAS was obtained from researchers at Yale University (Dr. Ashley Gearhardt, Yale University, New Haven, USA), it was translated into Turkish by two bilingual researchers. Backward translation techniques were used to develop language-specific versions of the YFAS. Discrepancies between the original and translation were resolved by a professional English translator. The English and Turkish versions were given 3 weeks apart to a group of final year students from the Department of American Culture and Literature (n= 52), who had fluent English language skills. The total scores of both versions were similar to the total score from the original YFAS (p> 0.05) validat-ing the tool.
Eating Attitudes Test-26
The EAT-26, widely used to measure symptoms of dis-ordered eating of both the anorexic and bulimic variants, was developed by Garner et al. in 1982 [39]. It is based on the Eating Attitudes Test (EAT-40), validated in Turkish by Savasir and Erol in 1989 [40]. It includes 26 items in which the frequencies of attitudes and beliefs are rated using a 6-point scale. Participants scoring 20 or greater are considered at high risk for an eating dis-order. In the current study, the Turkish version of the EAT-26, piloted by Başet al. in 2004, was used. Evidence of its internal consistency reliability (Cronbach’s alpha = 0.70) and test–retest reliability over a 3-week period (0.98) was garnered in a community sample of Turkish adults [41]. EAT-26 was also administered along with the YFAS to test criterion-related validity.
Demographics questionnaire
Information about age, sex, health status, education, oc-cupation, smoking habits, alcohol consumption pattern, and physical activity level were obtained.
Data analysis Internal structure
The factorial structure of the Turkish version of the YFAS was examined by exploratory factor analysis, con-ducted using IBM SPSS Statistics Version 21. The prin-cipal component factor analysis with varimax rotation
was conducted. This means that the final component will be at right angles with each other. With this conver-sion, we can assume that the information explained by one component is independent of the information in the other component. Data suitability for exploratory factor analysis was assessed using the Kaiser–Meyer–Olkin measure of sampling adequacy and Bartlett’s test of sphericity. Criteria for factor loadings included item values ≥0.40 on the primary factor and values no more than ≤0.20 on other factors. The model obtained in the exploratory factor analysis was tested on the study sample (n = 1033) using confirmatory factor analysis. The chi-square test (χ2), comparative fit index (CFI), normed fit index (NFI), goodness of fit index (GFI), and root mean square error of approximation (RMSEA) were calculated using LISREL version 8.7 [42–45].
Reliability
Descriptive statistics of the total score and eight item subscale scores for the YFAS were calculated. Internal consistency reliability of the Turkish version of the YFAS was tested using Cronbach’s alpha. The Pearson product-moment correlation analysis was used to estab-lish its temporal stability, allowing test–retest reliability to be explored. The criterion-related validity of the total YFAS score and total EAT-26 score was examined by the chi-square distribution of participants with normal/ abnormal eating behaviors and food addiction/none-food addiction [44,45].
Results
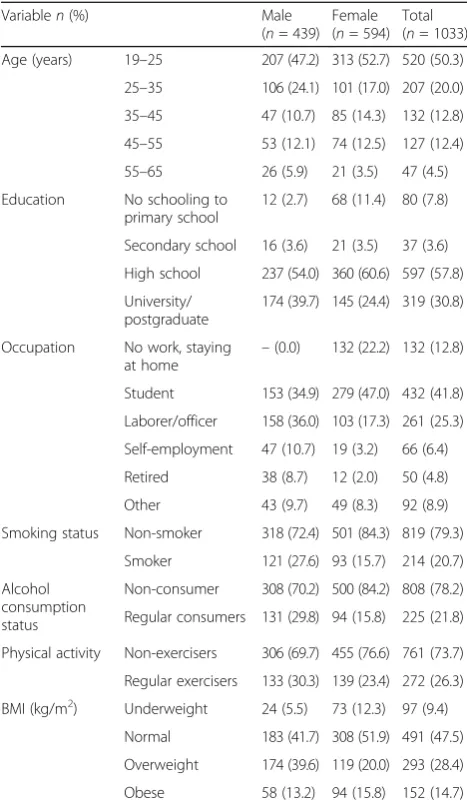
General characteristics of the study sample are given in Table 1. The mean age of participants was 31.07 ± 11.77 years with a range of 19–65 years. Majority of the participants (88.6%) had high school or university diploma. Non-smoker (79.3%), non-alcohol consumer (78.2%), and non-exercisers (73.7%) comprised the majority of the study population. The mean BMI of participants was 24.73 ± 5.05 kg/m2, and respectively 28.4% and 14.7% of the study population were over-weight and obese (Table 1).
Factor analysis of YFAS items
The Kaiser–Meyer Olkin statistics was 0.909, showing that sample adequacy was high enough for factor ana-lysis. Bartlett’s test (χ2value) of sphericity was 8540.98 (p< 0.001), indicating the data was suitable for explora-tory factor analysis. All factors with eigenvalues greater than 1 were identified.
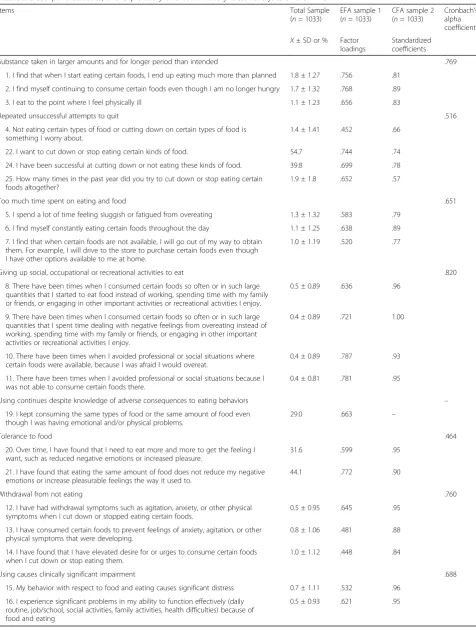
eating and food; giving up social, occupational, or recre-ational activities to eat; using continues despite know-ledge of adverse consequences to eating behaviors; tolerance to food; and withdrawal from not eating. As shown in Table2, all the primary factor loadings were at least 0.45, and no items cross-loaded onto other factors. Factor loadings ranged between 0.45 and 0.79 (Table2). The analysis revealed that together, the seven factors explain 69.8% of the variance in the scale items.
Confirmatory factor analysis on the entire sample (n = 1033) tested the model obtained in the exploratory factor analysis. Table 2 presents the standardized coeffi-cients as well as the descriptive statistics obtained for the total sample. Fit indices indicated that eight items of the YFAS represented the item responses in Turkish adults: S–Bχ2= 676.27, df = 168,p< 0.001, CFI = 0.950, RMSEA = 0.054, NFI = 0.94, and GFI = 0.98. Each item loaded significantly on the specified factor (p< 0.001 for each).
Internal consistency
Descriptive statistics (means and standard deviations) and internal consistency values of the YFAS items are given in Table2.
Reliability
Results showed that the YFAS subscales have high test– retest reliabilities over a 3-week period (n= 1018, statis-tical power = 0.813). The test–retest reliability among all participants was 0.77 for substance taken in larger amounts and for longer periods than intended; 0.52 for repeated unsuccessful attempts to quit; 0.65 for too much time spent on eating and food; 0.82 for giving up social, occupational, or recreational activities to eat; 0.46 for tolerance to food; 0.76 for withdrawal from not eat-ing; and 0.69 for using causes clinically significant im-pairment. The reliability for using continues despite knowledge of adverse consequences to eating behaviors was not calculated because it had only one component (Table2).
Criterion-related validity
The Pearson product-moment correlation coefficients were calculated for the YFAS scores and EAT-26 scores for all participants to test criterion reliability (n= 1033). The bivariate and partial correlation coefficients between total YFAS score and total EAT-26 score for diagnosis in the entire study population were 0.230 (p < 0.001). It was 0.189 for the number of symptoms (p< 0.001). The chi-square distribution of participants with normal/ab-normal eating behaviors diagnosed by EAT-26 and food addiction/none-food addiction is given at Table3. It was shown that 41.8% of the participants with food addiction also had eating disorder, whereas only 11.1% of the participants without food addiction had eating disorder (chi-square = 80.892,p= 0.001).
Discussion
In this study, we investigated the psychometric features of the Turkish version of the YFAS in a non-clinical sample of adults. This scale had moderately good in-ternal consistency and construct validity in its diagnosis and symptom count. As with the original version, nearly all items were significantly correlated with their total score. Hence, it can be suggested that the Turkish ver-sion of the YFAS is a useful tool in a non-clinical setting for defining food addiction.
Despite good internal consistency and construct validity, a few items (item 4: not eating certain types of food or cut-ting down on certain types of food is something I worry about; Item13: I have consumed certain foods to prevent feelings of anxiety, agitation, or other physical symptoms that were developing; item 14: I have found that I have ele-vated desire for or urges to consume certain foods when I
Table 1General characteristics of the participants
Variablen(%) Male
(n= 439) Female (n= 594)
Total (n= 1033)
Age (years) 19–25 207 (47.2) 313 (52.7) 520 (50.3)
25–35 106 (24.1) 101 (17.0) 207 (20.0)
35–45 47 (10.7) 85 (14.3) 132 (12.8)
45–55 53 (12.1) 74 (12.5) 127 (12.4)
55–65 26 (5.9) 21 (3.5) 47 (4.5)
Education No schooling to
primary school
12 (2.7) 68 (11.4) 80 (7.8)
Secondary school 16 (3.6) 21 (3.5) 37 (3.6)
High school 237 (54.0) 360 (60.6) 597 (57.8)
University/ postgraduate
174 (39.7) 145 (24.4) 319 (30.8)
Occupation No work, staying at home
–(0.0) 132 (22.2) 132 (12.8)
Student 153 (34.9) 279 (47.0) 432 (41.8)
Laborer/officer 158 (36.0) 103 (17.3) 261 (25.3)
Self-employment 47 (10.7) 19 (3.2) 66 (6.4)
Retired 38 (8.7) 12 (2.0) 50 (4.8)
Other 43 (9.7) 49 (8.3) 92 (8.9)
Smoking status Non-smoker 318 (72.4) 501 (84.3) 819 (79.3)
Smoker 121 (27.6) 93 (15.7) 214 (20.7)
Alcohol consumption status
Non-consumer 308 (70.2) 500 (84.2) 808 (78.2)
Regular consumers 131 (29.8) 94 (15.8) 225 (21.8)
Physical activity Non-exercisers 306 (69.7) 455 (76.6) 761 (73.7)
Regular exercisers 133 (30.3) 139 (23.4) 272 (26.3)
BMI (kg/m2) Underweight 24 (5.5) 73 (12.3) 97 (9.4)
Normal 183 (41.7) 308 (51.9) 491 (47.5)
Overweight 174 (39.6) 119 (20.0) 293 (28.4)
Table 2Descriptive statistics, and exploratory and confirmatory factor analyses of the YFAS
Items Total Sample
(n= 1033)
EFA sample 1 (n= 1033)
CFA sample 2 (n= 1033)
Cronbach’s alpha coefficients
X± SD or % Factor loadings
Standardized coefficients
Substance taken in larger amounts and for longer period than intended .769
1. I find that when I start eating certain foods, I end up eating much more than planned 1.8 ± 1.27 .756 .81
2. I find myself continuing to consume certain foods even though I am no longer hungry 1.7 ± 1.32 .768 .89
3. I eat to the point where I feel physically ill 1.1 ± 1.23 .656 .83
Repeated unsuccessful attempts to quit .516
4. Not eating certain types of food or cutting down on certain types of food is something I worry about.
1.4 ± 1.41 .452 .66
22. I want to cut down or stop eating certain kinds of food. 54.7 .744 .74
24. I have been successful at cutting down or not eating these kinds of food. 39.8 .699 .78
25. How many times in the past year did you try to cut down or stop eating certain foods altogether?
1.9 ± 1.8 .652 .57
Too much time spent on eating and food .651
5. I spend a lot of time feeling sluggish or fatigued from overeating 1.3 ± 1.32 .583 .79
6. I find myself constantly eating certain foods throughout the day 1.1 ± 1.25 .638 .89
7. I find that when certain foods are not available, I will go out of my way to obtain them. For example, I will drive to the store to purchase certain foods even though I have other options available to me at home.
1.0 ± 1.19 .520 .77
Giving up social, occupational or recreational activities to eat .820
8. There have been times when I consumed certain foods so often or in such large quantities that I started to eat food instead of working, spending time with my family or friends, or engaging in other important activities or recreational activities I enjoy.
0.5 ± 0.89 .636 .96
9. There have been times when I consumed certain foods so often or in such large quantities that I spent time dealing with negative feelings from overeating instead of working, spending time with my family or friends, or engaging in other important activities or recreational activities I enjoy.
0.4 ± 0.89 .721 1.00
10. There have been times when I avoided professional or social situations where certain foods were available, because I was afraid I would overeat.
0.4 ± 0.89 .787 .93
11. There have been times when I avoided professional or social situations because I was not able to consume certain foods there.
0.4 ± 0.81 .781 .95
Using continues despite knowledge of adverse consequences to eating behaviors –
19. I kept consuming the same types of food or the same amount of food even though I was having emotional and/or physical problems.
29.0 .663 –
Tolerance to food .464
20. Over time, I have found that I need to eat more and more to get the feeling I want, such as reduced negative emotions or increased pleasure.
31.6 .599 .95
21. I have found that eating the same amount of food does not reduce my negative emotions or increase pleasurable feelings the way it used to.
44.1 .772 .90
Withdrawal from not eating .760
12. I have had withdrawal symptoms such as agitation, anxiety, or other physical symptoms when I cut down or stopped eating certain foods.
0.5 ± 0.95 .645 .95
13. I have consumed certain foods to prevent feelings of anxiety, agitation, or other physical symptoms that were developing.
0.8 ± 1.06 .481 .88
14. I have found that I have elevated desire for or urges to consume certain foods when I cut down or stop eating them.
1.0 ± 1.12 .448 .84
Using causes clinically significant impairment .688
15. My behavior with respect to food and eating causes significant distress 0.7 ± 1.11 .532 .96
16. I experience significant problems in my ability to function effectively (daily routine, job/school, social activities, family activities, health difficulties) because of food and eating
cut down or stop eating them) exhibited relatively lower ex-ploratory factors than other items. Of these, the first as-sesses the food addiction criterion named “repeated unsuccessful attempts to quit.” In other versions of the YFAS, item 22 (I want to cut down or stop eating certain kinds of food), item 24 (I have been successful at cutting down or not eating these kinds of food), and item 25 (How many times in the past year did you try to cut down or stop eating certain foods altogether?) which were also included in the criterion “repeated unsuccessful attempts to quit” had low factor loadings [36, 37,46]. Although we showed that these three items had more powerful outcomes than item 4, it appears that under the criterion“repeated unsuc-cessful attempts to quit,”they may have slightly lower sensi-tivity when distinguishing food addiction [46]. Because previous studies suggested reserve scoring these items, we also reserved item 4. In addition, “repeated unsuccessful attempts to quit”can be a repetitive attitude in constituting healthy eating habits or weight loss attempts [46]. More-over,“worry about not eating certain types of food or cut-ting down on certain types of food”might not be a familiar concept in Turkish eating culture. Therefore, future studies may focus on developing and improving this criterion in the Turkish version of the YFAS.
Unlike other validation studies, current study exhibited a relatively moderate Cronbach’s alpha for the criterion
“tolerance to food” although all factor analysis for item 20 (over time, I have found that I need to eat more and more to get the feeling I want, such as reduced negative emotions or increased pleasure) and item 21 (I have found that eating the same amount of food does not re-duce my negative emotions or increase pleasurable feel-ings the way it used to) showed strong correlations. Similarly, item 13 (I have consumed certain foods to prevent feelings of anxiety, agitation, or other physical symptoms that were developing) and item 14 (I have found that I have elevated desire for or urges to con-sume certain foods when I cut down or stop eating them) exhibited relatively moderate explanatory factors. Because our level of significance was not observed in other language validation studies for the “tolerance to food” criterion and items 13 and 14, these can be attri-butable to socio-cultural and socio-economic differences in the Turkish population. The influence of cross-cultural or host culture experiences on eating behaviors
and nutritional status is well documented [47, 48]. In addition, our study design relied on self-reporting in all cases. Hence, nutrition-related cultural differences or possible deviations related to subject differences may have contributed to these outcomes.
A slight positive correlation was obtained between EAT-26 and the Turkish version of the YFAS in this study. However, the frequency of food addiction was sig-nificantly higher than the frequency of eating disorder as expected. This was based on the distinct structures of eating behaviors that these tools examine or sample dif-ferences. The EAT-26 measures mainly symptoms and concerns of eating disorders, whereas YFAS measures mainly symptoms of addicted behavior. Moreover, other language validation studies exhibited high correlations between YFAS and EAT-26 or other eating behavior scales, but not all of these scales appeared to be consist-ently correlated with YFAS [37].
The prevalence of food addiction was 11.8% in this study sample. This was comparable with that seen in other studies conducted in the USA (11.4%) [11], Germany (8.8%) [12], and France (8.7%) [36]. These out-comes suggest that the Turkish version of the YFAS ex-erts similar psychometric features to previously validated versions in non-clinical settings. In addition, the hetero-geneous structure of the study sample in terms of age, sex, body mass index, and socioeconomic characteristics made the tool useful for different groups.
In conclusion, we demonstrated that the Turkish version of the YFAS is an efficient tool that can be used in food ad-diction investigations. Because a non-clinical sample was used in this study, subsequent studies may consider asses-sing clinical subjects to better elucidate the psychopatho-logic and psychiatric factors associated with food addiction.
Abbreviations
CFI:Comparative fit index; DSM-IV: Diagnostic and Statistical Manual of Mental Disorders-IV; EAT-26: Eating Attitude Test-26; GFI: Goodness of fit index; NFI: Normed fit index; RMSEA: Root mean square error of approximation; YFAS: Yale Food Addiction Scale
Acknowledgements
The authors thank Dr. Ashley Gearhardt, researcher from Yale University, New Haven, USA, for sharing the original version of the Yale Food Addiction Scale.
Authors’contributions
ZB and AAy designed the study and wrote the protocol. GP and HTB conducted literature searches and provided summaries of previous research
Table 3Presence of food addiction and eating disorder in the study population [n(%)]
Food addition
Yes No Total p
Eating disorder Yes 51 (41.8%) 101 (11.1%) 152 (14.7%) 0.001
No 71 (58.2%) 810 (88.9%) 881 (85.3%)
Total 122 (100.0%) 911 (100.0%) 1033 (100.0%)
studies. AAk, RNU and BA were responsible for data collection. EC and PO conducted the statistical analysis. ZB and AAk wrote the first draft of the manuscript. All authors critically reviewed the manuscript and approved the final version submitted for publication.
Funding
The authors received no financial support for the research.
Availability of data and materials
The datasets used and/or analyzed during the current study are available from the corresponding author on reasonable request.
Ethics approval and consent to participate
The study protocol was approved by the Ethics Committee of Hacettepe University with a reference number of GO 14 / 122-21, and written informed consent was obtained from all participants.
Consent for publication Not applicable
Competing interests
The authors declare that they have no competing interests.
Author details 1
Department of Nutrition and Dietetics, Faculty of Health Sciences, Hacettepe University, 06230 Ankara, Turkey.2Department of Biostatistics and
Medical Informatics, Faculty of Medicine, Acıbadem University, Atasehir, Istanbul, Turkey.3Department of Biostatistics and Medical Informatics, School
of Medicine, Hacettepe University, 06230 Ankara, Turkey.
Received: 15 December 2016 Accepted: 5 November 2019
References
1. King D. The future challenge of obesity. Lancet. 2011;378(9793):743–4. 2. Popkin BM, Adair LS, Ng SW. Global nutrition transition and the pandemic
of obesity in developing countries. Nutr Rev. 2012;70(1):3–21.
3. Brandhagen M, Forslund HB, Lissner L, Winkvist A, Lindroos AK, Carlsson LM, et al. Alcohol and macronutrient intake patterns are related to general and central adiposity. Eur J Clin Nutr. 2012;66(3):305–13.
4. Poti JM, Duffey KJ, Popkin BM. The association of fast food consumption with poor dietary outcomes and obesity among children: is it the fast food or the remainder of the diet? Am J Clin Nutr. 2014;99(1):162–71. 5. Duffey KJ, Gordon-Larsen P, Jacobs DR Jr, Williams OD, Popkin BM.
Differential associations of fast food and restaurant food consumption with 3-y change in body mass index: the Coronary Artery Risk Development in Young Adults Study. Am J Clin Nutr. 2007;85(1):201–8.
6. Sarwer DB, von Sydow GA, Vetter ML, Wadden TA. Behavior therapy for
obesity: where are we now? Curr Opin Endocrinol Diabetes Obes. 2009; 16(5):347–52.
7. Dalle Grave R, Calugi S, El Ghoch M. Lifestyle modification in the management of obesity: achievements and challenges. Eat Weight Disord. 2013;18(4):339–49.
8. Drewnowski A, Mennella JA, Johnson SL, Bellisle F. Sweetness and food preference. J Nutr. 2012;142(6):1142s–8s.
9. Lanfer A, Knof K, Barba G, Veidebaum T, Papoutsou S, de Henauw S, et al. Taste preferences in association with dietary habits and weight status in European children: results from the IDEFICS study. Int J Obes. (Lond). 2012;36(1):27–34.
10. Gearhardt AN, Grilo CM, DiLeone RJ, Brownell KD, Potenza MN. Can food be addictive? Public health and policy implications. Addiction. 2011;106(7): 1208–12.
11. Gearhardt AN, Corbin WR, Brownell KD. Preliminary validation of the Yale Food Addiction Scale. Appetite. 2009;52(2):430–6.
12. Meule A. How prevalent is "food addiction"? Front Psychiatry. 2011;2:61.
13. Gearhardt AN, White MA, Masheb RM, Morgan PT, Crosby RD, Grilo CM. An
examination of the food addiction construct in obese patients with binge eating disorder. Int J Eat Disord. 2012;45(5):657–63.
14. Meule A, Kubler A. Food cravings in food addiction: the distinct role of positive reinforcement. Eat Behav. 2012;13(3):252–5.
15. Ziauddeen H, Farooqi IS, Fletcher PC. Obesity and the brain: how convincing is the addiction model? Nat Rev Neurosci. 2012;13(4):279–86. 16. Engel JA, Jerlhag E. Role of appetite-regulating peptides in the
pathophysiology of addiction: implications for pharmacotherapy. CNS Drugs. 2014;28(10):875–86.
17. Furlong TM, Jayaweera HK, Balleine BW, Corbit LH. Binge-like consumption of a palatable food accelerates habitual control of behavior and is dependent on activation of the dorsolateral striatum. J Neurosci. 2014;34(14):5012–22. 18. Thorgeirsson TE, Gudbjartsson DF, Sulem P, Besenbacher S, Styrkarsdottir U,
Thorleifsson G, et al. A common biological basis of obesity and nicotine addiction. Transl Psychiatry. 2013;3:e308.
19. Hone-Blanchet A, Fecteau S. Overlap of food addiction and substance use disorders definitions: analysis of animal and human studies.
Neuropharmacology. 2014;85:81–90.
20. Berthoud HR. Metabolic and hedonic drives in the neural control of appetite: who is the boss? Curr Opin Neurobiol. 2011;21(6):888–96. 21. Carpenter CL, Wong AM, Li Z, Noble EP, Heber D. Association of dopamine
D2 receptor and leptin receptor genes with clinically severe obesity. Obesity (Silver Spring). 2013;21(9):E467–73.
22. Markianos M, Evangelopoulos ME, Koutsis G, Sfagos C. Elevated CSF serotonin and dopamine metabolite levels in overweight subjects. Obesity (Silver Spring). 2013;21(6):1139–42.
23. Giuliano C, Robbins TW, Nathan PJ, Bullmore ET, Everitt BJ. Inhibition of opioid transmission at the mu-opioid receptor prevents both food seeking and binge-like eating. Neuropsychopharmacology. 2012;37(12):2643–52. 24. Katsuura Y, Taha SA. Mu opioid receptor antagonism in the nucleus
accumbens shell blocks consumption of a preferred sucrose solution in an anticipatory contrast paradigm. Neuroscience. 2014;261:144–52. 25. Spetter MS, Mars M, Viergever MA, de Graaf C, Smeets PA. Taste matters
-effects of bypassing oral stimulation on hormone and appetite responses. Physiol Behav. 2014;137:9–17.
26. Jauregui-Lobera I, Bolanos RP. What motivates the consumer’s food choice? Nutr Hosp. 2011;26(6):1313–21.
27. Rada P, Avena NM, Hoebel BG. Daily bingeing on sugar repeatedly releases dopamine in the accumbens shell. Neuroscience. 2005;134(3):737–44. 28. Avena NM, Rada P, Hoebel BG. Sugar bingeing in rats. Curr Protoc Neurosci.
2006;Chapter 9:Unit9.23C.
29. Avena NM, Long KA, Hoebel BG. Sugar-dependent rats show enhanced
responding for sugar after abstinence: evidence of a sugar deprivation effect. Physiol Behav. 2005;84(3):359–62.
30. Bocarsly ME, Berner LA, Hoebel BG, Avena NM. Rats that binge eat fat-rich food do not show somatic signs or anxiety associated with opiate-like withdrawal: implications for nutrient-specific food addiction behaviors. Physiol Behav. 2011;104(5):865–72.
31. Ahmed SH, Guillem K, Vandaele Y. Sugar addiction: pushing the drug-sugar analogy to the limit. Curr Opin Clin Nutr Metab Care. 2013;16(4):434–9. 32. Parylak SL, Koob GF, Zorrilla EP. The dark side of food addiction. Physiol
Behav. 2011;104(1):149–56.
33. Gearhardt AN, Corbin WR, Brownell KD. Food addiction: an examination of the diagnostic criteria for dependence. J Addict Med. 2009;3(1):1–7.
34. Gearhardt AN, Roberto CA, Seamans MJ, Corbin WR, Brownell KD.
Preliminary validation of the Yale Food Addiction Scale for children. Eat Behav. 2013;14(4):508–12.
35. Clark SM, Saules KK. Validation of the Yale Food Addiction Scale among a weight-loss surgery population. Eat Behav. 2013;14(2):216–9.
36. Brunault P, Ballon N, Gaillard P, Reveillere C, Courtois R. Validation of the French version of the Yale Food Addiction Scale: an examination of its factor structure, reliability, and construct validity in a nonclinical sample. Can J Psychiatry. 2014;59(5):276–84.
37. Chen G, Tang Z, Guo G, Liu X, Xiao S. The Chinese version of the Yale Food Addiction Scale: an examination of its validation in a sample of female adolescents. Eat Behav. 2015;18:97–102.
38. Bayraktar F, Erkman F, KurtuluşE. Adaptation study of Yale Food Addiction Scale. Klinik Psikofarmakol Bulteni. 2012;22(1):S38.
39. Garner DM, Olmsted MP, Bohr Y, Garfinkel PE. The eating attitudes test: psychometric features and clinical correlates. Psychol Med. 1982;12(4):871–8. 40. Savasir I, Erol N. Eating Attitude Test: an index of anorexia nervosa
symptoms. Turkish Journal of Psychology. 1989;7:19–25. 41. Bas M, Asçi FH, Karabudak E, Kiziltan G. Eating attitudes and their
42. Li CH. Confirmatory factor analysis with ordinal data: comparing robust maximum likelihood and diagonally weighted least squares. Behav Res Methods. 2016;48(3):936–49.
43. Gatignon H. Confirmatory factor analysis. In: Statistical analysis of management data. New York: Springer; 2010. p. 59–122. 44. Asparouhov T, Muthén B. Exploratory structural equation modeling.
Structural Equation Modeling. 2009;16:397–438.
45. Kline RB. Measurement models and confirmatory factor analysis. In: Principles and practice of structural equation modeling (3rd ed.). New York: Guilford Press; 2011. p. 230–62.
46. Meule A, Heckel D, Kübler A. Factor structure and item analysis of the Yale Food Addiction Scale in obese candidates for bariatric surgery. Eur Eat Disord Rev. 2012;20(5):419–22.
47. Cho W, Takeda W, Oh Y, Aiba N, Lee Y. Perceptions and practices of commensality and solo-eating among Korean and Japanese university students: a cross-cultural analysis. Nutr Res Pract. 2015;9(5):523–9. 48. Akbulut G, Yildirim M, Sanlier N, van Stralen MM, Acar-Tek N, Bilici S, et al.
Comparison of energy balance-related behaviours and measures of body composition between Turkish adolescents in Turkey and Turkish immigrant adolescents in the Netherlands. Public Health Nutr. 2014;17(12):2692–9.
Publisher’s Note
![Table 3 Presence of food addiction and eating disorder in the study population [n(%)]](https://thumb-us.123doks.com/thumbv2/123dok_us/687761.1564996/6.595.59.537.101.169/table-presence-food-addiction-eating-disorder-study-population.webp)