R E S E A R C H
Open Access
The effects of fatty fish intake on
adolescents
’
nutritional status and
associations with attention performance:
results from the FINS-TEENS randomized
controlled trial
Katina Handeland
1,2*, Siv Skotheim
3, Valborg Baste
4, Ingvild E. Graff
1,4, Livar Frøyland
1, Øyvind Lie
1,5,
Marian Kjellevold
1, Maria W. Markhus
1, Kjell M. Stormark
3,6, Jannike Øyen
1and Lisbeth Dahl
1Abstract:
Background:Adolescence involves changes in dietary habits that may induce imbalances in the intake of different nutrients. Fish is an important dietary source of omega-3 (n-3) long-chain polyunsaturated fatty acids (LCPUFAs), vitamin D, several minerals and high-quality protein. By using secondary outcomes and exploratory analyses, the aims of this paper were to evaluate if nutritional biomarkers (red blood cell fatty acids, serum (s)-25(OH)D, s-ferritin and urinary iodine concentration (UIC)) were altered during a dietary intervention, and if they mediated previously reported changes in attention performance. In addition, to examine the status of the biomarkers and explore associations between dietary pattern, biomarkers and attention performance cross-sectionally at baseline.
Methods:The Fish Intervention Studies-TEENS (FINS-TEENS) was a three-armed intervention trial, including adolescents from eight secondary schools (n= 415; age: 14–15y) in Bergen, Norway. Participants were individually randomized to receive either fish meals, meat meals or n-3 LCPUFA supplements, three times a week for a total of 12 weeks. Blood and urine samples were collected pre and post intervention and attention performance was assessed with the d2 test of attention. Analyses of covariance (ANCOVA) assessed differences between groups in changes of biomarkers and linear mixed models were applied in analyses of attention performance and biomarkers. The trial is registered in ClinicalTrials.gov(NCT02350322).
Results:At baseline, the mean omega-3 index was 5.8 ± 1.3% and deficient status were identified for s-25(OH)D (54%), s-ferritin (10%) and UIC (40%). The intervention resulted in an increase in DHA and the omega-3 index which was larger in the supplement group compared to the fish and meat group (P< 0.01), and in the fish group compared to the meat group (P< 0.01). No differences between the groups were observed for changes in 25(OH)D, s-ferritin or UIC. None of the biomarkers mediated performance in the d2 test. The intake of fatty fish and a healthy dietary pattern was associated with scores in processing speed at baseline.
Conclusions:These results show that Norwegian adolescents have insufficient status of important nutrients, which may be improved with fatty fish consumption or n-3 LCPUFA supplements. However, nutritional status was not associated with scores in the d2 test of attention.
Keywords:N-3 LCPUFA, Vitamin D, Iron, Iodine, Fatty fish, Dietary intervention, Healthy adolescents
* Correspondence:[email protected]
1Institute of Marine Research (IMR), P.O. Box 1870 Nordnes, 5817 Bergen, Norway 2Department of Clinical Medicine, Faculty of Medicine and Dentistry, University of Bergen, P.O. Box 7800, 5020 Bergen, Norway Full list of author information is available at the end of the article
Background
Seafood is a component of dietary patterns associated with good health, and food based dietary guidelines in almost all European countries include recommendations on fish consumption. One purpose of these recommenda-tions is to ensure the provision of key nutrients, since fish is the main dietary source of the omega-3 (n-3) long-chain polyunsaturated fatty acids (LCPUFAs) and vitamin D, in
addition to minerals and high-quality protein [1,2].
Ado-lescence is a critical period involving major physiological changes, and thus, suboptimal dietary habits leading to nutritional imbalances may be of special concern in this
group [3]. The cross-sectional Healthy Lifestyle in Europe
by Nutrition in Adolescence (HELENA) study found that 42% had a serum 25-hydroxyvitamin D (25(OH)D) concentration < 50 nmol/L [4], which is regarded as insuffi-cient [5]. No official cut-off for the nutritional status of n-3 LCPUFAs currently exists, but a commonly used marker for dietary intake and cardiovascular disease risk is the omega-3 index, which is the percentage of eicosapentaenoic acid (EPA) and docosahexaenoic acid (DHA) in red blood
cell (RBC) fatty acids [6]. The proposed omega-3 index risk
categories for cardiovascular disease in adults are: high risk, < 4%; intermediate risk, 4–8%; and low risk, > 8% [7]. Based on these cut-offs, a cross-sectional study reported that only 0.4% of 1300 Australian adolescents had an omega-3 index
of > 8%, 84% had an index of 4–8%, and 15.6% had an index
of < 4% [8]. The food based dietary guidelines for fish con-sumption generally range from 100 to 300 g per week and the European food safety authority (EFSA) recommends
that the dietary advice for children aged 2–18 years should
be 250 mg/d of EPA and DHA [9]. In Norway, the
recom-mendation is 2–3 dinner portions/week, which should
correspond to 300–450 g/week, of which 200 g should
be fatty fish. However, data from Norway and other Western populations suggest that these recommendations are not met [1,10].
Although the brain reaches approximately 90% of its adult size at age six, it continues to undergo changes throughout adolescence, involving e.g. myelination of axons, synaptic pruning and increased communication
between the brain regions [11]. Nutrition is a key
environ-mental factor to consider in terms of brain development and function, because it can be manipulated relatively
eas-ily [12]. To our knowledge, no previous randomized
con-trolled trials (RCT) have provided fish to adolescents and measured nutritional status and/or cognitive performance. Two observational studies have been conducted, showing that fish consumption was positively associated with
ado-lescents’performance at school [13] and in cognitive tests
[14, 15]. Given its nutritional properties, and because
in-creased consumption potentially could replace other foods with putative adverse health effects, it is plausible that an increased intake of fish could be more beneficial than
consuming supplements. Thus, we performed a RCT to assess the effect of a 3-month dietary intervention with fatty fish meals in typically developing adolescents. Previ-ously reported results from this study suggest that the fish meals could have led to improvements in outcomes of attention performance, although the results were
diffi-cult to interpret due to low dietary compliance [16]. By
using secondary outcomes and exploratory analyses, the aims of this paper were to evaluate if nutritional biomarkers (RBC fatty acids, serum (s)-25(OH)D, s-ferritin and urinary iodine concentration (UIC)) were altered during the intervention, and if they mediated attention performance. In addition, to examine the status of nutritional biomarkers and explore associations between dietary pattern, bio-markers, and attention performance cross-sectionally at baseline.
Methods
Study design and ethics
Fish Intervention Studies-TEENS (FINS-TEENS) was con-ducted at eight lower secondary schools in Bergen, Norway, between February and May 2015. The three-armed trial used a RCT design to investigate the cognitive and nu-tritional effects of providing meals with fatty fish, or similar meals with meat/cheese, or fish oil supplements to adolescents.
The trial was conducted according to the declaration of Helsinki. Ethical approval was obtained from the Norwegian Data Protection Official for Research (pro-ject number: 41,030). Written informed consent was collected from all participants and one legal caregiver, and participants could withdraw from the trial without
giving any reason. The trial is registered in Clinical
Trials.gov (NCT02350322). The design and methods
are described in detail previously [17].
Participants and randomization
Eligible adolescents were girls and boys attending 9th
grade (14–15 years-old) at the participating schools, who
knew the Norwegian language orally and written. Exclu-sion criteria were allergy or intolerance to the study foods or supplements. The random allocation was performed in-dividually stratified by gender, by two researchers. One researcher went through the list of participants stating
only the participants’ gender (boy/girl), while another
(blinded from the list) drew lots marked with one of the three intervention groups from the correct box labeled either“boy”or“girl”.
Study meals and n-3 supplements
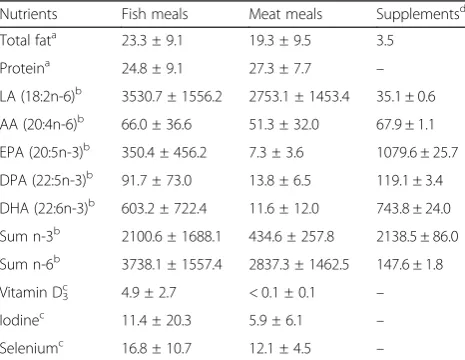
the meat group contained chicken, turkey, beef, lamb and cheese. In addition, the meals comprised vegetables and/or salad and mainly wholegrain pasta-, focaccia-, ba-guette- or tortilla and sometimes dressing. Halal meat and gluten free products were provided on request. The meals had a mean weight of 230 g/portion, and the amount of fish/meat was requested to be between 80 and 100 g/por-tion. The number of capsules was calculated to match the weekly intake of EPA and DHA in the fish group, and was seven per serving. Capsules were Nycoplus® Omega-3, 500 mg, produced by Takeda Nycomed, Asker, Norway, bought at a public pharmacy in Bergen, Norway. Fatty acids and nutrient content in the meals and supplements were
analyzed and results are summarized in Table1.
Procedure
The meals and supplements were delivered three times a week for a total of 12 weeks. Participants received the meals or supplements from a study worker at their school, during the lunch break (usually between 11:00 a.m. and noon). Participants in the different intervention groups ate together in their respective class-rooms. The fish and
meat meals replaced the participants’usual lunch, whereas
the supplement group continued to eat their habitual lunch in addition to taking the supplements. The school lunch of Norwegian adolescents is usually a packed lunch from home, containing medium dark or dark bread or crispbread with meat, cheese or liver pate as spread, and
sometimes a fruit or vegetable [10, 18]. The participants
were asked not to change any procedures they had besides the intervention, e.g. use of fish-oil supplements or their habitual dietary intake of fish at home. Dietary compliance was monitored throughout the trial by study staff who registered the remaining number of capsules and the amount of fish/meat eaten for each participant. The amount of fish/meat eaten was estimated by eye and
registered on a scale from zero to four: ‘0 = nothing
eaten’,‘1 = 1/4 eaten’,‘2 = 2/4 eaten’,‘3 = 3/4 eaten’ and
‘4 = all eaten’.
Questionnaire
General information about participants (age, weight, height, and gender) and their background diet (habitual dietary in-take besides the intervention) were obtained with a revised and extended version of a validated web-based food fre-quency questionnaire (FFQ) at pre and post intervention
[19,20]. Height and weight were not measured directly in
order to prioritize the cognitive tests and blood and urine sampling. The FFQ included questions about the
consump-tion of different fish species for dinner (never–≥4 times/
week) and in the analyses, continuous indices were made from the reported intake of salmon, herring and mackerel according to the methodology by Markhus and colleagues
[19], and summarized into one continuous variable
reflecting fatty fish intake (range 0.0–6.0). The
ques-tionnaire included one question about physical activity
(≤30 min –4 h or more/week) and questions regarding
the frequency of using solarium (never–2 times/week)
and duration of being abroad to high-UV radiation
areas (range: zero – ≥4 weeks) the past three months.
The reported use of solarium was dichotomized into
less than once per month or≥once per month, and the
duration of being abroad to high-UV radiation areas
was dichotomized into less than one week or ≥one week.
These variables were combined into solarium/high-UV
exposure yes/no (categorical variable). A diet score (0–8
points) which evaluates the adherence to the current Norwegian dietary recommendations by scoring the re-ported intake of fruits, vegetables, wholegrain, fish, red meat, dairy products, added sugar, water and physical activity has been developed and applied to the FFQ
[21]. The diet score was used in the cross-sectional
analyses in the present paper.
A questionnaire sent to the caregivers by e-mail assessed parental educational level (elementary/lower
secondary school – college/university ≥4 years), total
household income (< 200,000 NOK–> 2000,000 NOK
(100 NOK = approximately 10€/11$) and origin
(par-ticipant and both parents born outside or in Norway).
The mean parental educational level ((mothers’level +
fathers’level)/2) (continuous variable) was used in the
statistical analyses.
Table 1Fatty acid profile and nutrient content in each portion of fish and meat meals (mean weight 230 g) and n-3 supplements
Nutrients Fish meals Meat meals Supplementsd
Total fata 23.3 ± 9.1 19.3 ± 9.5 3.5
Proteina 24.8 ± 9.1 27.3 ± 7.7
– LA (18:2n-6)b 3530.7 ± 1556.2 2753.1 ± 1453.4 35.1 ± 0.6
AA (20:4n-6)b
66.0 ± 36.6 51.3 ± 32.0 67.9 ± 1.1
EPA (20:5n-3)b 350.4 ± 456.2 7.3 ± 3.6 1079.6 ± 25.7
DPA (22:5n-3)b 91.7 ± 73.0 13.8 ± 6.5 119.1 ± 3.4
DHA (22:6n-3)b 603.2 ± 722.4 11.6 ± 12.0 743.8 ± 24.0
Sum n-3b 2100.6 ± 1688.1 434.6 ± 257.8 2138.5 ± 86.0
Sum n-6b 3738.1 ± 1557.4 2837.3 ± 1462.5 147.6 ± 1.8
Vitamin D3c 4.9 ± 2.7 < 0.1 ± 0.1 –
Iodinec 11.4 ± 20.3 5.9 ± 6.1
– Seleniumc 16.8 ± 10.7 12.1 ± 4.5
–
Abbreviations:AAarachidonic acid,LAlinoleic acid,EPAeicosapentaenoic acid, DPADocosapentaenoic acid,DHAdocosahexaenoic acid,n-3omega-3, n-6omega-6
a
g/portion
b
mg/portion
c
μg/portion
d
Outcomes
Blood and urine samples, and biochemical analyses
Authorized biomedical laboratory scientists obtained non-fasting blood samples from the elbow cavity of the partici-pants. For preparation of RBC, venous blood was collected in BD Vacutainer® vials and centrifuged (10 min, 1000 g, 20 °C) within 30 min. RBCs were adequately separated to ensure a clean blood fraction. Venous blood for serum preparation was collected in BD Vacutainer® vials and set to coagulate for minimum 30 min before centrifuged (10 min, 1000G, 20 °C,) within 60 min. Blood samples were temporarily stored and transported on dry ice before
storage in a−80 °C freezer until analysis.
For analyzation of fatty acids, blood samples were thawed on a shaker (Nutating shaker) and prepared by the Hamilton Microlab Star Line robot. The samples were homogenized and internal standard (0.4 mg/ml Methyl Nonadecanoate in methanol) and 2% sulfuric acid in methanol were added. Samples were shaken and boiled at 105 °C for 40 min before cooled. Extraction of fatty acids was performed by adding water and heptane, and the fatty acid composition was determined on a Trace GC Ultra gas chromathograph (Thermo Corporation). The samples were analyzed on a UltraFast UFC-WAX Column (5 m × 0.1 mm × 0.1um), ThermoFischer Scientific. Helium was used as mobile phase at 0.5 ml/min constant flow. Certi-fied reference materials were analyzed to assess the accur-acy and precision of the method. A 10% difference was
accepted in contents of 0.6–100% and all RBC fatty acids
are expressed as weight percentage of total fatty acids. The omega-3 index was calculated as the content of EPA
and DHA expressed as percent of total fatty acids [6].
S-25(OH)D concentration was determined by standard-ized procedures at IMR, using a liquid chromatographic-tandem mass spectrometric (LC-MS/MS) assay adding
acetonitrile and internal standard (2
H 25(OH)D3) to the
samples [22]. S-ferritin was analyzed at Haraldsplass
Diakonale Hospital Bergen, Norway, by an automated electrochemiluminescence immunoassay (ECLIA) on Cobas e601 (Roche). The urine samples was taken at home in the morning or at school and iodine status was determined as UIC in spot samples by Inductive Coupled Plasma Mass
Spectrometry (ICP-MS) at IMR [23].
Cognitive tests
The primary outcome of the study was performance on
the d2 test of attention [24]. In addition, participants
completed a Norwegian reading and spelling test named
“Kartleggeren” and the Strengths and Difficulties
Ques-tionnaire (SDQ), which assesses mental health status, at
pre and post intervention. Results from“Kartleggeren”are
not reported, due to considerable ceiling effects in nearly all outcomes both pre and post intervention. Effects of the
intervention on SDQ are reported in Skotheim et al. [25].
Consequently, results from the d2 test of attention only are used in the present paper, and these have also
previ-ously been presented in more detail [16].
The d2 test of attention is a pen and paper cancellation test, measuring abilities in visual scanning, processing speed and degree of accuracy, regardless of intelligence level
[24,26]. The test comprises 47 interspersed target- and
distraction characters× 14 rows, and the respondents’
task is to cancel out as many target characters as possible, while ignoring distraction characters. Standard outcomes
of the test were included in the trial, which are:‘
process-ing speed’(TN; total number of characters processed) and
two overall measures of performance: ‘total performance’
(TN-E; total number of characters processed minus total
errors made) and ‘concentration performance’ (CP; total
number of correctly cancelled out target characters minus commission errors). In addition, there are two types of
error-outcomes: ‘omission errors’ (E1; unmarked target
characters) and ‘commission errors’ (E2; incorrectly
can-celled distraction characters), and ‘total errors’ (E total;
the sum of E1 and E2).
The same trained study staff administered the test ac-cording to standard instructions pre and post interven-tion. Testing was performed in classrooms between 9 and 11 a.m. Environmental factors such as noise were con-trolled for rigorously by the study crew and the teachers.
Sample size
The sample size calculation was based on the design with a three armed-intervention, and pre and post inter-vention measurements with an assumed correlation of 0.5. The primary outcome of the trial was the d2 test of attention. To be able to reveal a meanigful effect of the intervention on the primary outcome, a small to moder-ate effect size (0.35) was applied. The calculmoder-ated sample size was 119 participants in each group based on a
power of 80% and a significance level ofα= 0.05. When
taking a 20% drop out rate into account, the aim was to enroll a sample of 446 participants in the trial.
Statistical analyses
Data are presented as either means and standard devia-tions (SD) or as numbers (n) and percentages (%). At baseline, differences between intervention groups were assessed with one-way ANOVA for continuous variables and Chi-square test for categorical variables.
Paired-samplest-tests were used for analysis of changes
pre intervention. A second model was further adjusted for dietary compliance (amount of fish, meat or n-3 supple-ments eaten during the trial). Pairwise comparisons with Bonferroni correction between intervention groups were
performed if the overallP-value was significant.
To investigate if biomarkers could mediate the assosia-tion between intervenassosia-tion and TN, TN-E and E1, which as previously reported were the significant outcomes from
the d2 test of attention [16], standard mediation approach
was used [27] within linear mixed effects models. The
as-sociation between the nutritional biomarkers at post inter-vention (independent variable) and the relevant d2 test outcome measured at post intervention (dependent vari-able) was assessed, one at a time. School class was in-cluded as random intercept and the models were adjusted for the relevant pre intervention d2 test score and pre intervention values of the relevant nutritonal biomarker.
Association with intervention groups and reported use of solarium and being abroad to high-UV radiation areas was assessed with chi-square test.
Baseline analyses assessing the associations between d2 test-scores (dependent) and nutritional biomarkers, or the reported intake of fatty fish, or the diet score from the FFQ (independent), were performed with linear mixed effects models with school class as random intercept. Unadjusted models and models adjusted for age, sex, parental educa-tional level and physical activity were performed for the d2 test scores.
Two-tailedP-values < 0.05 were considered statistically
significant. The analyses were performed using the Stat-istical Package for the Social Sciences (SPSS® Statistics version 24, IBM Corporation, US), except for the linear mixed effect models which were performed using Stata Statistical Software: Release 14. College Station, TX: (STATACorp LP®).
Results
Study population
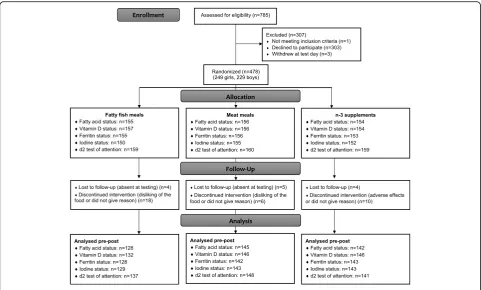
Of the 785 children who were attending 9th grade at the time of recruitment and received invitation, 481 (61%) agreed to participate. Three participants withdrew from the trial at the day of baseline testing, before randomization. Thus, 478 participants were randomly allocated to interven-tion groups. 47 participants were lost to follow up or
discon-tinued the intervention (n= 22 in the fish group,n= 11 in
the meat group, andn= 14 in the supplement group) (Fig.1).
A total of 370 questionnaires (78%) were completed by the caregivers.
Participants had a mean age of 14.6 ± 0.3 years, and a
mean BMI of 19.8 ± 2.9 kg/m2. Most were non-immigrants,
defined as the participant and both of the parents were born in Norway. The participants had a mean omega-3 index of 5.8 ± 1.3% and 95% of the sample had an index
≤8%. A total of 92%, 10% and 40% had deficient levels of
s-25(OH)D, s-ferritin and UIC, respectively [5, 28, 29]. The
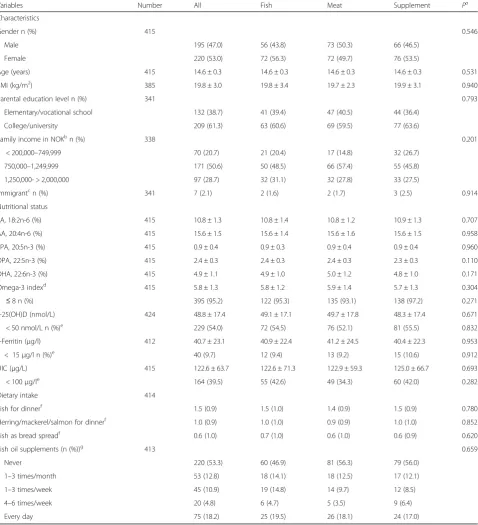
reported baseline dietary intake of fish for dinner was on average 1.5 meals/week, of which 1 of these were fatty fish. The proportion who reported to use fish oil or other types of omega-3 supplements daily was 18%, whereas 53% re-ported to never use this. There were no differences between the intervention groups in baseline characteristics, nutri-tional status or dietary intake (Table2).
A mean of 30 ± 6 meals were served to each participant
during the intervention. As reported previously [17], the
total intake (dietary compliance) was higher in the supple-ment group than in the meal groups, and the total intake of meat in the meat group was higher than the total intake of fish in the fish group. The proportion of participants who consumed at least half of the fish/meat/capsules during the trial was 38%, 66% and 87% in the fish, meat and
supple-ment group, respectively [17]. There was not observed any
differences between intervention groups in changes of the
background diet from pre to post intervention [16].
Change in nutritional status during the intervention
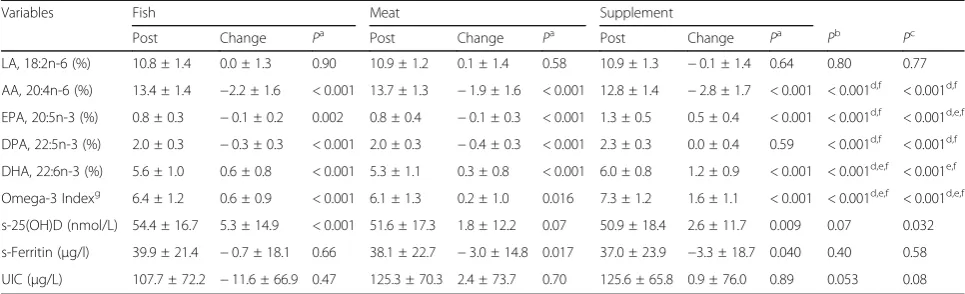
As shown in Table 3, the pairwise comparisons (with
Bonferroni correction) showed that the omega-3 index and DHA increased in the supplement group compared to the fish and meat group, and that these markers also increased more in the fish group compared to the meat group. When adjusting for dietary compliance, these dif-ferences between groups were still significant for the omega-3 index, but the increase in DHA was no longer different between the supplement and fish group. The supplement group showed a decrease in AA during the intervention, compared to the two other groups. The fish group showed a mean increase in s-25(OH)D con-centration of 5.3 nmol/L, whereas the increase in the meat and supplement group was 1.8 and 2.6 nmol/L re-spectively, and the initial analyses showed no differences between the groups. When adusting for dietary compliance, an overall difference was observed between the groups
(P= 0.032), and the pairwise comparisons between the
fish and meat group and the fish and supplement group
gave P= 0.056 and P= 0.060, respectively. There were
no associations between the intervention groups and the reported use of solarium and stays abroad in high-UV radiation areas during the trial. No differences between intervention groups were observed for changes in iron or iodine status from pre to post intervention.
Associations between biomarkers of nutritional status and attention performance
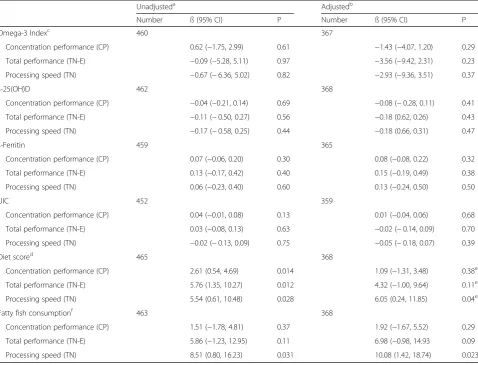
Neither the unadjusted nor the adjusted cross-sectional analyses at baseline measurements showed associations between the nutritional biomarkers and performance in d2
test outcomes. An association between the participants’diet
score (0–8 points reflecting low-high adherence to dietary
recommendations) and CP, TN-E and TN was found in the unadjusted analyses. This association remained significant for TN after adjusting for potential confounders. An associ-ation between the reported consumption of salmon, mack-erel and herring and TN was observed in the unadjusted
and the adjusted analyses (Table4).
Discussion
This trial among school-aged adolescents showed that a 3-month dietary intervention with n-3 LCPUFA supple-ments or fatty fish meals increased RBC concentrations of DHA and the omega-3 index more than meat meals. No differences between groups were observed in changes of s-25(OH)D, s-ferritin or UIC concentrations from pre to post intervention. No associations between changes in nutritional biomarkers and attention performance was ob-served, but the cross-sectional analyses showed an
associ-ation between the participants’ healthy diet score and
processing speed (TN) at baseline, and between the re-ported intake of fatty fish (salmon mackerel and herring) and TN at baseline. The proportion of participants with
deficient levels were 54% for s-25(OH)D, 10% for s-ferritin and 40% for UIC.
The average omega-3 index at baseline was 5.8% in this sample of adolescents, which is slightly higher than the mean index of 4.9% found in 1300 Australian
adoles-cents [8]. However, when compared with the categories for
cardiovascular disease risk for adults [7], a larger proportion in our sample had an omega-3 index < 4% (5% in our sam-ple compared to 0.4% in the Australian samsam-ple) and a smaller proportion had an omega-3 index > 8% (5% in our sample compared to 15.6% in the Australian sample). The mean increases in the omega-3 index of 0.6% and 1.6% in the fish and supplement group respectively, is comparable
to the findings by Stonehouse et al.,who reported increases
between 0.8–1.8% with salmon meals (710 mg/d EPA +
DHA) or salmon oil supplements (210–600 mg/d EPA+
DHA) to healthy adults for 8 weeks [30]. The proportion
with vitamin D deficiency is slightly higher in this study than among European adolescents in the HELENA study
[4]. This is probably because this trial started in February,
which is when s-25(OH)D concentrations are almost at their lowest in high latitudes such as Bergen, Norway,
(60.4°N) due to absent UV-B radiation [31]. The mean
in-crease of 5.3 nmol/L in the fish group is nearly comparable with the results from a meta-analysis of RCTs in adults (> 18 years), showing that the average increase in fish groups relative to placebo was 4.4 nmol/L, and when only fatty fish
Table 2Baseline characteristics of all participants and by randomly assigned intervention groups
Variables Number All Fish Meat Supplement Pa
Characteristics
Gender n (%) 415 0.546
Male 195 (47.0) 56 (43.8) 73 (50.3) 66 (46.5)
Female 220 (53.0) 72 (56.3) 72 (49.7) 76 (53.5)
Age (years) 415 14.6 ± 0.3 14.6 ± 0.3 14.6 ± 0.3 14.6 ± 0.3 0.531
BMI (kg/m2) 385 19.8 ± 3.0 19.8 ± 3.4 19.7 ± 2.3 19.9 ± 3.1 0.940
Parental education level n (%) 341 0.793
Elementary/vocational school 132 (38.7) 41 (39.4) 47 (40.5) 44 (36.4)
College/university 209 (61.3) 63 (60.6) 69 (59.5) 77 (63.6)
Family income in NOKbn (%) 338 0.201
< 200,000–749,999 70 (20.7) 21 (20.4) 17 (14.8) 32 (26.7)
750,000–1,249,999 171 (50.6) 50 (48.5) 66 (57.4) 55 (45.8)
1,250,000- > 2,000,000 97 (28.7) 32 (31.1) 32 (27.8) 33 (27.5)
Immigrantcn (%) 341 7 (2.1) 2 (1.6) 2 (1.7) 3 (2.5) 0.914
Nutritional status
LA, 18:2n-6 (%) 415 10.8 ± 1.3 10.8 ± 1.4 10.8 ± 1.2 10.9 ± 1.3 0.707
AA, 20:4n-6 (%) 415 15.6 ± 1.5 15.6 ± 1.4 15.6 ± 1.6 15.6 ± 1.5 0.958
EPA, 20:5n-3 (%) 415 0.9 ± 0.4 0.9 ± 0.3 0.9 ± 0.4 0.9 ± 0.4 0.960
DPA, 22:5n-3 (%) 415 2.4 ± 0.3 2.4 ± 0.3 2.4 ± 0.3 2.3 ± 0.3 0.110
DHA, 22:6n-3 (%) 415 4.9 ± 1.1 4.9 ± 1.0 5.0 ± 1.2 4.8 ± 1.0 0.171
Omega-3 indexd 415 5.8 ± 1.3 5.8 ± 1.2 5.9 ± 1.4 5.7 ± 1.3 0.304
≤8 n (%) 395 (95.2) 122 (95.3) 135 (93.1) 138 (97.2) 0.271
s-25(OH)D (nmol/L) 424 48.8 ± 17.4 49.1 ± 17.1 49.7 ± 17.8 48.3 ± 17.4 0.671
< 50 nmol/L n (%)e 229 (54.0) 72 (54.5) 76 (52.1) 81 (55.5) 0.832
s-Ferritin (μg/l) 412 40.7 ± 23.1 40.9 ± 22.4 41.2 ± 24.5 40.4 ± 22.3 0.953
< 15μg/l n (%)e 40 (9.7) 12 (9.4) 13 (9.2) 15 (10.6) 0.912
UIC (μg/L) 415 122.6 ± 63.7 122.6 ± 71.3 122.9 ± 59.3 125.0 ± 66.7 0.693
< 100μg/le 164 (39.5) 55 (42.6) 49 (34.3) 60 (42.0) 0.282
Dietary intake 414
Fish for dinnerf 1.5 (0.9) 1.5 (1.0) 1.4 (0.9) 1.5 (0.9) 0.780
Herring/mackerel/salmon for dinnerf 1.0 (0.9) 1.0 (1.0) 0.9 (0.9) 1.0 (1.0) 0.852
Fish as bread spreadf 0.6 (1.0) 0.7 (1.0) 0.6 (1.0) 0.6 (0.9) 0.620
Fish oil supplements (n (%))g 413 0.659
Never 220 (53.3) 60 (46.9) 81 (56.3) 79 (56.0)
1–3 times/month 53 (12.8) 18 (14.1) 18 (12.5) 17 (12.1)
1–3 times/week 45 (10.9) 19 (14.8) 14 (9.7) 12 (8.5)
4–6 times/week 20 (4.8) 6 (4.7) 5 (3.5) 9 (6.4)
Every day 75 (18.2) 25 (19.5) 26 (18.1) 24 (17.0)
Abbreviations:AAarachidonic acid,LAlinoleic acid,EPAeicosapentaenoic acid,DPADocosapentaenoic acid,DHAdocosahexaenoic acid,25(OH)D 25-hydroxyvitamin D,s-Ferritinserum ferritin,UICurinary iodine concentration,NOKNorwegian kroner
aOne-way ANOVA test (continuous variables) and Pearson’s Chi-square test (X2) (categorical variables) for comparison between treatment groups b
100 NOK = approximately 10€/11$ c
Immigrant was defined as participants who’s both parents and themselves were born outside Norway dThe content of EPA and DHA expressed as percent of total fatty acids [6]
eAdolescents were classified with vitamin D deficiency if s-25(OH)D < 50 nmol/L [5], with depleted iron stores if s-ferritin < 15μg/L [29] and as iodine deficient if UIC < 100μg/L [28]
f
Reported meals per week (besides the intervention)
gN (%) of participants reporting to consume fish oil as dietary supplements
interventions was considered, the difference increased to
6.8 nmol/L [32]. Mostly white meat was served to the meat
group, which may explain the decreased level of s-ferritin in this group, although no differences between groups were evident. We did not measure puberty stage, but it is un-likely that the onset of menarche should have affected s-ferritin levels during the relatively short duration of 12 weeks. The median UIC in this sample of adolescents
was 111.8μg/L, which is just above the epidemiologic
cri-teria for sufficient iodine status in populations given by
WHO [28]. However, it is considerably lower than the
median of 200μg/L found in Icelandic adolescent girls
(n= 112, 16–20 y) [33]. This could be because Iceland
in the past has been known for its high iodine status due to a high intake of fish and milk. The large
percent-age with UIC below 100 μg/L in the present trial give
cause for concern, and some of the explanation might be that iodized salt is not commonly used in households, and not used at all in the Norwegian food industry. The reason why no change in UIC was observed in the fish group from pre to post intervention is possibly because we used fatty fish, whereas lean fish is usually higher in iodine contents [34].
As mentioned, this is to our knowledge the first study that has provided fish to adolescents to measure the effect on attention performance. Associations between the d2 test of attention and RBC fatty acid status (the omega-3 index) have been investigated in two other studies, one RCT in
healthy school children [35] and one cross-sectional study
in healthy adolescents [36]. They reported contradictory (a
positive [35] and a negative [36]) associations between the
omega-3 index and errors of omission (E1 errors). The RCT also found associations between the omega-3 index and scores in concentration performance (CP) and total performance (TN-E) at baseline, but not in the correlation analyses between the intervention-induced changes. Thus, the results from previous studies using the d2 test of atten-tion are inconclusive, which brings into quesatten-tion whether the test assesses performance in brain areas affected by n-3 LCPUFA status. The cross-sectional analyses in the present study suggesting that there is an association between TN and fatty fish intake, and a healthier dietary pattern is inter-esting. Other studies in healthy young participants have reported associations between cognitive outcomes and fish
intake [13, 15] and between a healthy diet or intake of
healthy foods [37–40]. However, because the present results
are based on cross-sectional analyses, we cannot make statements on causality; although it is tempting to make the interpretation that TN was driven by the diet mea-sures, the opposite may be true, such that higher scores in TN may implicate better dietary choices. In future studies, a more sensitive measure of processing speed e.g. response times in milliseconds may be useful to as-sess the potential association between fish or dietary in-take and processing speed.
Given a 100% dietary compliance rate, the consumption of three portions/week of the fatty fish meals would have provided the participants in this trial with a weekly mean dose of approximately 1050 mg EPA and 1800 mg DHA. Divided by seven this corresponds to a daily mean dose of
Table 3Changes in the adolescents’fatty acids levels (% of total fatty acids), serum 25(OH)D, serum ferritin and urinary iodine concentration during the intervention
Variables Fish Meat Supplement
Post Change Pa Post Change Pa Post Change Pa Pb Pc
LA, 18:2n-6 (%) 10.8 ± 1.4 0.0 ± 1.3 0.90 10.9 ± 1.2 0.1 ± 1.4 0.58 10.9 ± 1.3 −0.1 ± 1.4 0.64 0.80 0.77
AA, 20:4n-6 (%) 13.4 ± 1.4 −2.2 ± 1.6 < 0.001 13.7 ± 1.3 −1.9 ± 1.6 < 0.001 12.8 ± 1.4 −2.8 ± 1.7 < 0.001 < 0.001d,f < 0.001d,f
EPA, 20:5n-3 (%) 0.8 ± 0.3 −0.1 ± 0.2 0.002 0.8 ± 0.4 −0.1 ± 0.3 < 0.001 1.3 ± 0.5 0.5 ± 0.4 < 0.001 < 0.001d,f < 0.001d,e,f
DPA, 22:5n-3 (%) 2.0 ± 0.3 −0.3 ± 0.3 < 0.001 2.0 ± 0.3 −0.4 ± 0.3 < 0.001 2.3 ± 0.3 0.0 ± 0.4 0.59 < 0.001d,f < 0.001d,f
DHA, 22:6n-3 (%) 5.6 ± 1.0 0.6 ± 0.8 < 0.001 5.3 ± 1.1 0.3 ± 0.8 < 0.001 6.0 ± 0.8 1.2 ± 0.9 < 0.001 < 0.001d,e,f < 0.001e,f
Omega-3 Indexg 6.4 ± 1.2 0.6 ± 0.9 < 0.001 6.1 ± 1.3 0.2 ± 1.0 0.016 7.3 ± 1.2 1.6 ± 1.1 < 0.001 < 0.001d,e,f < 0.001d,e,f
s-25(OH)D (nmol/L) 54.4 ± 16.7 5.3 ± 14.9 < 0.001 51.6 ± 17.3 1.8 ± 12.2 0.07 50.9 ± 18.4 2.6 ± 11.7 0.009 0.07 0.032
s-Ferritin (μg/l) 39.9 ± 21.4 −0.7 ± 18.1 0.66 38.1 ± 22.7 −3.0 ± 14.8 0.017 37.0 ± 23.9 −3.3 ± 18.7 0.040 0.40 0.58
UIC (μg/L) 107.7 ± 72.2 −11.6 ± 66.9 0.47 125.3 ± 70.3 2.4 ± 73.7 0.70 125.6 ± 65.8 0.9 ± 76.0 0.89 0.053 0.08
Abbreviations:AAarachidonic acid,LAlinoleic acid,EPAeicosapentaenoic acid,DPADocosapentaenoic acid,DHAdocosahexaenoic acid,s-25(OH)D serum 25-hydroxyvitamin D,s-Ferritinserum ferritin,UIC; urinary iodine concentration
Total numbers may vary between variables due to varying numbers of missing data aP-value for comparison within intervention groups, paired samplest-test bP
-value for comparison between intervention groups. ANCOVA (adjusted for the current outcome at baseline) cP
-value for comparison between intervention groups. ANCOVA (adjusted for the current outcome at baseline and dietary compliance (i.e. the total intake of fish, meat or supplements)) during the trial
dp< 0.01 fish - supplement,ep< 0.01 fish - meat,fp< 0.01 supplement - meat (Bonferroni correction for post-hoc comparison between
intervention groups) e
150 mg EPA and 257 mg DHA. This dose is lower
com-pared to other RCTs that used supplements [41–43], but
slightly higher than the daily recommendation of 250 mg/d
EPA and DHA advised by EFSA [9]. However, the relatively
low dietary compliance in the fish group means that these participants were exposed to a lower dose, which is prob-ably why we observed a greater mean increase of DHA and the omega-3 index in the supplement group than in the fish group. It is possible that the dose of n-3 LCPUFAs used in the present trial was too low and the duration too short for the intervention to result in brain modifications measurable with a cognitive test. However, a RCT in healthy boys found that supplementing with both 400 mg/d DHA (which is comparable to the dose used in our study) and 1200 mg/d DHA for only eight weeks increased the amount of DHA
in RBC, and that this correlated with prefrontal cortex
acti-vation as measured with fMRI [44]. The low proportion of
participants found to be iron deficient may explain why we did not see any association between iron and performance in the d2 test of attention.
Strengths and limitations
Strengths of this trial include the use of RBC fatty acids as biomarker, since this has shown to be a valid and ob-jective indicator of fatty acid intake the prior weeks,
and it is not altered in the fed state [45, 46].
Further-more, the use of LC-MS/MS method for determination of s-25(OH)D and ICP-MS for determination of UIC is a strength because these are considered methods of high
trueness and precision [47, 48]. The fact that the whole
Table 4Associations between adolescents’cognitive test-performances and nutritional variables or FFQ data at baseline
Unadjusteda Adjustedb
Number ß (95% CI) P Number ß (95% CI) P
Omega-3 Indexc 460 367
Concentration performance (CP) 0.62 (−1.75, 2.99) 0.61 −1.43 (−4.07, 1.20) 0.29
Total performance (TN-E) −0.09 (−5.28, 5.11) 0.97 −3.56 (−9.42, 2.31) 0.23
Processing speed (TN) −0.67 (−6.36, 5.02) 0.82 −2.93 (−9.36, 3.51) 0.37
s-25(OH)D 462 368
Concentration performance (CP) −0.04 (−0.21, 0.14) 0.69 −0.08 (−0.28, 0.11) 0.41
Total performance (TN-E) −0.11 (−0.50, 0.27) 0.56 −0.18 (0.62, 0.26) 0.43
Processing speed (TN) −0.17 (−0.58, 0.25) 0.44 −0.18 (0.66, 0.31) 0.47
s-Ferritin 459 365
Concentration performance (CP) 0.07 (−0.06, 0.20) 0.30 0.08 (−0.08, 0.22) 0.32
Total performance (TN-E) 0.13 (−0.17, 0.42) 0.40 0.15 (−0.19, 0.49) 0.38
Processing speed (TN) 0.06 (−0.23, 0.40) 0.60 0.13 (−0.24, 0.50) 0.50
UIC 452 359
Concentration performance (CP) 0.04 (−0.01, 0.08) 0.13 0.01 (−0.04, 0.06) 0.68
Total performance (TN-E) 0.03 (−0.08, 0.13) 0.63 −0.02 (−0.14, 0.09) 0.70
Processing speed (TN) −0.02 (−0.13, 0.09) 0.75 −0.05 (−0.18, 0.07) 0.39
Diet scored 465 368
Concentration performance (CP) 2.61 (0.54, 4.69) 0.014 1.09 (−1.31, 3.48) 0.38e
Total performance (TN-E) 5.76 (1.35, 10.27) 0.012 4.32 (−1.00, 9.64) 0.11e
Processing speed (TN) 5.54 (0.61, 10.48) 0.028 6.05 (0.24, 11.85) 0.04e
Fatty fish consumptionf 463 368
Concentration performance (CP) 1.51 (−1.78, 4.81) 0.37 1.92 (−1.67, 5.52) 0.29
Total performance (TN-E) 5.86 (−1.23, 12.95) 0.11 6.98 (−0.98, 14.93 0.09
Processing speed (TN) 8.51 (0.80, 16.23) 0.031 10.08 (1.42, 18.74) 0.023
Abbreviations:FFQfood frequency questionnaire,25(OH)D25-hydroxyvitamin D,s-Ferritinserum ferritin,UICurinary iodine concentration
a
Linear mixed effects model with school class as random intercept
b
Linear mixed effects model with school class as random intercept, adjusted for age, sex, parental educational level and physical activity level
c
The content of EPA and DHA expressed as percent of total fatty acids [6]
d
A score including the reported intake of fruits, vegetables, wholegrain, fish, red meat, dairy products, added sugar, water and physical activity according to the Norwegian dietary recommendations. Range: 0–8 points [21]
e
Not adjusted for physical activity
f
meal was homogenized and analyzed for its nutrients content after cooking gives a more accurate assessment of actual nutrient intakes by the participants compared to analyses of the plain or raw filet. In addition, the close follow-up of the participants throughout the dietary inter-vention provided us with useful data on dietary compliance. An important limitation of this trial was the low study diet-ary compliance particularly observed in the fish group. One of the main reasons for this is perhaps that we had to serve the meals cold due to practical reasons. Thus, future studies should emphasize that meals have high quality and tastiness in order to achieve acceptable compliance. Another limita-tion is the ceiling effect in the reading and writing test that left us with only one test on cognitive performance. A test-battery measuring other cognitive functions than just atten-tion could have potentially revealed associaatten-tions that were undetected in this trial. Furthermore, the EPA and DHA content was not equal between the fish and supplement group, although that was the aim. Paradoxically, the fish meals also had a slightly higher total content of n-6 PUFAs compared to meat, which was mainly due to a high content of LA in the farmed salmon. It could be argued that a 12 weeks duration was not sufficient, since RBC n-3
fatty acids do not plateau until around 6 months [49].
However, it has been noticed in supplementation stud-ies that the greatest increase is achieved within the first
4–8 weeks [49,50]. Still, it is questionable whether the
duration was sufficient to achieve a clinically meaning-ful change in the brain that could be meaning-fully translated into performance in a cognitive test.
Conclusions
In conclusion, the intake of n-3 supplements and fatty fish meals increased RBC levels of DHA and the omega-3 index more than meat meals, but n-3 supplements also in-creased more in these parameters than the fish meals, pos-sibly due to differences in dietary compliance. None of the nutritional biomarkers were found to be associated with performance in the d2 test of attention. Baseline measure-ments showed deficient levels of s-25(OH)D and UIC in addition to suboptimal levels of EPA + DHA in RBC (based on adult cut-offs) in a considerable number of par-ticipants. The longer-term implications for the suboptimal nutritional status found in these adolescents is unknown, however, they give cause for concern and should be given increased attention in future studies.
Abbreviations
25(OH)D:Serum 25-hydroxyvitamin D; AA: Arachidonic acid; CP: Concentration performance; DHA: Docosahexaenoic acid; DPA: Docosapentaenoic acid; E total: Total errors; E1: Errors of omission; E2: Errors of commission; EPA: Eicosapentaenoic acid; FFQ: Food frequency questionnaire; FINS: Fish intervention studies; LA: Linoleic acid; LCPUFA: Long-chain polyunsaturated fatty acids; n-3: Omega-3; RBC: Red blood cells; RCT: Randomized controlled trial; s-Ferritin: Serum ferritin; TN: Processing speed; TN-E: Total performance; UIC: Urinary iodine concentration
Acknowledgements
We thank the participants and their parents for their participation in the trial. We are also grateful for the support and assistance from fieldworkers, teachers and principals of the schools. A special thanks to Runa Borgund Barnung, Nina Wollertsen, Annie Fürstenberg and Elisabeth Rasmussen Ødegård for technical contribution during data collection.
Funding
This trial was financially supported by The Norwegian Seafood Research Fund (FHF) (grant number: 900842) after consideration by the Research Council of Norway (grant number 222648). This study is a part of the FINS project supported by FHF. Marine Harvest A/S (MH) and Pelagia A/S supported FINS with fish used in the diets. FHF, MH and Pelagia A/S had no role in the design of the study, in the collection, analyses, or interpretation of data, in the manuscript writing, or in the decision to publish the results.
Availability of data and materials
The datasets generated and analyzed during the current study are not publicly available due to privacy restrictions from ethical committee, but are available from the corresponding author on reasonable request.
Authors’contributions
IEG, ØL, LF, LD, KMS, MWM, MK, KH, SS and JØ designed the research; LD, KH and SS conducted the research; VB, JØ and KH performed the statistical analyses; KH wrote the paper; all authors read and critically revised the manuscript and approved the final manuscript, and had primary responsibility for final content.
Ethics approval and consent to participate
Norwegian Data Protection Official for Research project number: 41,030.
ClinicalTrials.govregistration number: NCT02350322.
Written informed consent to participate in the trial was collected from all participants and one legal parent/caregiver before study start.
Consent for publication
Not applicable
Competing interests
The authors declare that they have no competing interests.
Publisher’s Note
Springer Nature remains neutral with regard to jurisdictional claims in published maps and institutional affiliations.
Author details
1Institute of Marine Research (IMR), P.O. Box 1870 Nordnes, 5817 Bergen, Norway.2Department of Clinical Medicine, Faculty of Medicine and Dentistry, University of Bergen, P.O. Box 7800, 5020 Bergen, Norway.3Regional Centre for Child and Youth Mental Health, Uni Research Health, P.O. Box 7810, 5020 Bergen, Norway.4Present Address: Uni Research Health, P.O. Box 7810, 5020 Bergen, Norway.5Present Address: Directorate of Fisheries, P.O. Box 185 Sentrum, 5804 Bergen, Norway.6Department of Health Promotion and Development, University of Bergen, P.O. Box 7807, N-5020 Bergen, Norway.
Received: 14 August 2017 Accepted: 19 January 2018
References
1. EFSA: Scientific Opinion on health benefits of seafood (fish and shellfish) consumption in relation to health risks associated with exposure to methylmercury. 2014. [https://www.efsa.europa.eu/en/efsajournal/pub/3761]. Accessed 24 Jan 2018.
2. Dahl L, Bjorkkjaer T, Graff IE, Malde MK, Klementsen B. Fish-more than just omega 3. Tidsskr Nor Laegeforen. 2006;126:309–11.
3. Moreno LA, Gottrand F, Huybrechts I, Ruiz JR, González-Gross M, DeHenauw S. Nutrition and lifestyle in european adolescents: the HELENA (healthy lifestyle in Europe by nutrition in adolescence) study. Adv Nutr. 2014;5:615S–23S. 4. González-Gross M, Valtueña J, Breidenassel C, Moreno LA, Ferrari M, Kersting
5. Braegger C, Campoy C, Colomb V, Decsi T, Domellof M, Fewtrell M, Hojsak I, Mihatsch W, Molgaard C, Shamir R, et al. Vitamin D in the healthy European paediatric population. J Pediatr Gastroenterol Nutr. 2013;56:692–701. 6. Harris WS, Von Schacky C. The Omega-3 index: a new risk factor for death
from coronary heart disease? Prev Med. 2004;39:212–20.
7. Harris WS. The omega-3 index as a risk factor for coronary heart disease. Am J Clin Nutr. 2008;87:1997S–2002S.
8. O’Sullivan TA, Ambrosini GL, Mori TA, Beilin LJ, Oddy WH. Omega-3 index correlates with healthier food consumption in adolescents and with reduced cardiovascular disease risk factors in adolescent boys. Lipids. 2011;46:59–67. 9. EFSA: Scientific Opinion on Dietary Reference Values for fats, including
saturated fatty acids, polyunsaturated fatty acids, monounsaturated fatty acids, trans fatty acids, and cholesterol. 2010. [https://www.efsa.europa.eu/ en/efsajournal/pub/1461]. Accessed 11 Apr 2017.
10. Hansen LB, Myhre JB, Johansen AMW, Paulsen MM, Andersen LF: UNGKOST 3 Landsomfattende kostholdsundersøkelse blant elever i 4. -og 8. klasse i Norge, 2015 [UNGKOST 3 Nationwide dietary survey among pupils in 4th -and 8th grade in Norway, 2015]. 2016. [https://www.fhi.no/globalassets/dokumenterfiler/ rapporter/ungkost-rapport-24.06.16.pdf]. Accessed 16 Dec 2016.
11. Casey B, Jones RM, Hare TA. The adolescent brain. Ann N Y Acad Sci. 2008;1124:111–26.
12. Isaacs E, Oates J. Nutrition and cognition: assessing cognitive abilities in children and young people. Eur J Nutr. 2008;47:4–24.
13. Jl K, Winkvist A, Åberg MA, Åberg N, Sundberg R, Torén K, Brisman J. Fish consumption and school grades in Swedish adolescents: a study of the large general population. Acta Paediatr. 2010;99:72–7.
14. Åberg MA, Åberg N, Brisman J, Sundberg R, Winkvist A, Torén K. Fish intake of Swedish male adolescents is a predictor of cognitive performance. Acta Paediatr. 2009;98:555–60.
15. de Groot RHM, Ouwehand C, Jolles J. Eating the right amount of fish: inverted U-shape association between fish consumption and cognitive performance and academic achievement in Dutch adolescents. Prostaglandins Leukot Essent Fatty Acids. 2012;86:113–7.
16. Handeland K, Oyen J, Skotheim S, Graff IE, Baste V, Kjellevold M, Froyland L, Lie O, Dahl L, Stormark KM. Fatty fish intake and attention performance in 14-15 year old adolescents: FINS-TEENS - a randomized controlled trial. Nutr J. 2017;16:64.
17. Skotheim S, Dahl L, Handeland K, Frøyland L, Lie Ø, Øyen J, Kjellevold M, Stormark KM, Graff IE. Design of the FINS-TEENS study: a randomized controlled trial assessing the impact of fatty fish on cognitive performance in adolescents. Scand J Public Health. 2017;45:621–9.
18. Norges forskningsråd [Norwegian Research Council]: Hva spiser elevene på skolen? [What do students eat at school?]. 2011. [http://arrangor.forsknings dagene.no/binfil/download.php?tid=884034]. Accessed 23 Mar 2017. 19. Markhus MW, Graff IE, Dahl L, Seldal CF, Skotheim S, Braarud HC, Stormark
KM, Malde MK. Establishment of a seafood index to assess the seafood consumption in pregnant women. Food Nutr Res. 2013;57
20. Dahl L, Maeland CA, Bjorkkjaer T. A short food frequency questionnaire to assess intake of seafood and n-3 supplements: validation with biomarkers. Nutr J. 2011;10:127.
21. Handeland K, Kjellevold M, Wik Markhus M, Eide Graff I, Frøyland L, Lie Ø, Skotheim S, Stormark KM, Dahl L, Øyen J. A diet score assessing Norwegian Adolescents' adherence to dietary recommendations-development and test-retest reproducibility of the score. Nutrients. 2016;8
22. Kissmeyer A-M, Sonne K, Binderup E. Determination of the vitamin D analog EB 1089 (seocalcitol) in human and pig serum using liquid chromatography–tandem mass spectrometry. J Chromatogr B Biomed Sci Appl. 2000;740:117–28.
23. Dahl L, Meltzer HM, Opsahl JA, Julshamn K. Iodine intake and status in two groups of Norwegians. Food Nutr Res. 2003;47
24. Brickenkamp R, Zillmer E. d2 test of attention manual. Göttingen: Hogrefe & Huber Publishers; 2003.
25. Skotheim S, Handeland K, Kjellevold M, Oyen J, Froyland L, Lie O, Eide Graff I, Baste V, Stormark KM, Dahl L. The effect of school meals with fatty fish on adolescents' self-reported symptoms for mental health: FINS-TEENS - a randomized controlled intervention trial. Food Nutr Res. 2017;61:1383818. 26. Bates ME, Lemay EP. The d2 test of attention: construct validity and
extensions in scoring techniques. J Inter Neuropsych Soc. 2004;10:392–400. 27. Baron RM, Kenny DA. The moderator-mediator distinction in social
psychological research: conceptual, strategic, and statistical considerations. J Pers Soc Psychol. 1986;51:1173–82.
28. WHO: Urinary iodine concentrations for determining iodine status deficiency in populations. 2013. [http://apps.who.int/iris/bitstream/10665/ 85972/1/WHO_NMH_NHD_EPG_13.1_eng.pdf]. Accessed 14 Mar 2017. 29. WHO: Serum ferritin concentrations for the assessment of iron status and
iron deficiency in populations. 2011. [http://www.who.int/vmnis/indicators/ serum_ferritin.pdf]. Accessed 31 Mar 2017.
30. Stonehouse W, Pauga MR, Kruger R, Thomson CD, Wong M, Kruger MC. Consumption of salmon v. Salmon oil capsules: effects on n−3 PUFA and selenium status. Br J Nutr. 2011;106:1231–9.
31. Christensen MH, Lien EA, Hustad S, Almas B. Seasonal and age-related differences in serum 25-hydroxyvitamin D, 1,25-dihydroxyvitamin D and parathyroid hormone in patients from western Norway. Scand J Clin Lab Invest. 2010;70:281–6.
32. Lehmann U, Gjessing HR, Hirche F, Mueller-Belecke A, Gudbrandsen OA, Ueland PM, Mellgren G, Lauritzen L, Lindqvist H, Hansen AL, et al. Efficacy of fish intake on vitamin D status: a meta-analysis of randomized controlled trials. Am J Clin Nutr. 2015;102:837.
33. Gunnarsdottir I, Gunnarsdottir BE, Steingrimsdottir L, Maage A, Johannesson AJ, Thorsdottir I. Iodine status of adolescent girls in a population changing from high to lower fish consumption. Eur J Clin Nutr. 2010;64:958–64. 34. NIFES: Seafood data. [https://sjomatdata.nifes.no/#search/]. Accessed 29 June 2017. 35. Sørensen LB, Damsgaard CT, Dalskov SM, Petersen RA, Egelund N,
Dyssegaard CB, Stark KD, Andersen R, Tetens I, Astrup A. Diet-induced changes in iron and n-3 fatty acid status and associations with cognitive performance in 8–11-year-old Danish children: secondary analyses of the optimal well-being, development and health for Danish children through a healthy new Nordic diet school meal study. Br J Nutr. 2015;114:1623–37.
36. van der Wurff IS, von Schacky C, Berge K, Zeegers MP, Kirschner PA, de Groot RH. Association between blood Omega-3 index and cognition in typically developing Dutch adolescents. Nutrients. 2016;8.https://doi.org/10.3390/nu8010013
37. Cohen JFW, Gorski MT, Gruber SA, Kurdziel LBF, Rimm EB. The effect of healthy dietary consumption on executive cognitive functioning in children and adolescents: a systematic review. Br J Nutr. 2016;116:989–1000. 38. Haapala EA, Eloranta AM, Venäläinen T, Schwab U, Lindi V, Lakka TA.
Associations of diet quality with cognition in children–the physical activity and nutrition in children study. Br J Nutr. 2015;114:1080–7.
39. Khan NA, Raine LB, Drollette ES, Scudder MR, Kramer AF, Hillman CH. Dietary fiber is positively associated with cognitive control among prepubertal children. J Nutr. 2015;145:143–9.
40. Nyaradi A, Foster JK, Hickling S, Li J, Ambrosini GL, Jacques A, Oddy WH. Prospective associations between dietary patterns and cognitive performance during adolescence. J Child Psychol Psychiatry. 2014;55:1017–24.
41. Kirby A, Woodward A, Jackson S, Wang Y, Crawford MA. A double-blind, placebo-controlled study investigating the effects of omega-3 supplementation in children aged 8-10 years from a mainstream school population. Res Dev Disabil. 2010;31:718–30.
42. Stonehouse W, Conlon CA, Podd J, Hill SR, Minihane AM, Haskell C, Kennedy D. DHA supplementation improved both memory and reaction time in healthy young adults: a randomized controlled trial. Am J Clin Nutr. 2013;97:1134–43.
43. Kennedy DO, Jackson PA, Elliott JM, Scholey AB, Robertson BC, Greer J, Tiplady B, Buchanan T, Haskell CF. Cognitive and mood effects of 8 weeks' supplementation with 400 mg or 1000 mg of the omega-3 essential fatty acid docosahexaenoic acid (DHA) in healthy children aged 10-12 years. Nutr Neurosci. 2009;12:48–56.
44. McNamara RK, Able J, Jandacek R, Rider T, Tso P, Eliassen JC, Alfieri D, Weber W, Jarvis K, DelBello MP. Docosahexaenoic acid supplementation increases prefrontal cortex activation during sustained attention in healthy boys: a placebo-controlled, dose-ranging, functional magnetic resonance imaging study. Am J Clin Nutr. 2010;91:1060–7.
45. Harris WS, Thomas RM. Biological variability of blood omega-3 biomarkers. Clin Biochem. 2010;43:338–40.
46. Harris WS, Varvel SA, Pottala JV, Warnick GR, McConnell JP. Comparative effects of an acute dose of fish oil on omega-3 fatty acid levels in red blood cells versus plasma: implications for clinical utility. J Clin Lipidol. 2013;7:433–40.
48. Julshamn K, Dahl L, Eckhoff K. Determination of iodine in seafood by inductively coupled plasma/mass spectrometry. J AOAC Int. 2001;84: 1976–83.
49. Katan MB, Deslypere JP, van Birgelen AP, Penders M, Zegwaard M. Kinetics of the incorporation of dietary fatty acids into serum cholesteryl esters, erythrocyte membranes, and adipose tissue: an 18-month controlled study. J Lipid Res. 1997;38:2012–22.
50. Cao J, Schwichtenberg KA, Hanson NQ, Tsai MY. Incorporation and clearance of omega-3 fatty acids in erythrocyte membranes and plasma phospholipids.(Lipis, Lipoproteins and Cardiovascular Risk Factors). Clin Chem. 2006;52:2265.
• We accept pre-submission inquiries
• Our selector tool helps you to find the most relevant journal • We provide round the clock customer support
• Convenient online submission • Thorough peer review
• Inclusion in PubMed and all major indexing services • Maximum visibility for your research
Submit your manuscript at www.biomedcentral.com/submit