http://www.sciencepublishinggroup.com/j/ijsge doi: 10.11648/j.ijrse.20190803.11
ISSN: 2575-2189 (Print); ISSN: 2575-1549 (Online)
Investigation of Thermal Sensation of Occupants in
Domestic Buildings Located in Different Regions of China
Zhen Peng, Wu Deng
*, Yuanda Hong
Department of Architecture and Built Environment, University of Nottingham, Ningbo, China
Email address:
*Corresponding author
To cite this article:
Zhen Peng, Wu Deng, Yuanda Hong. Investigation of Thermal Sensation of Occupants in Domestic Buildings Located in Different Regions of China. International Journal of Sustainable and Green Energy. Vol. 8, No. 3, 2019, pp. 45-55. doi: 10.11648/j.ijrse.20190803.11
Received: June 8, 2019; Accepted: July 15, 2019; Published: July 30, 2019
Abstract: Thermal comfort sensation is different among people. Different climatic areas, such as the tropics and cold regions,
may require different thermal parameters. This study analyses the thermal sensation of occupants in domestic buildings in three regions of China (Jinan, Xining, and Guangzhou). Filed measurements were conducted in selected domestic buildings located in Jinan, Xining and Guangzhou. The studied parameters include ambient air temperature, indoor air temperature, indoor radiation temperature, airflow velocity, predicted mean vote (PMV) and actual mean vote (AMV). In addition, a survey to investigate the actual comfort levels of occupants was completed by the occupants. The main aim is to identify the differences in thermal sensation of occupants living in different regions and in different types of buildings. Moreover, this study further analyses the effects of the ambient environment on indoor thermal comfort. The correlation between the actual thermal sensation and the predicted thermal sensation is discussed. Results show that the ambient environment has a greater effect on the thermal comfort level of naturally ventilated houses than those ventilated by air conditioners. Moreover, Fanger’s predicted mean vote (PMV) model is good at predicting the thermal sensation of occupants living in air-conditioned houses; however, the model is not a good predictor for occupants living in naturally ventilated houses. Occupants in naturally ventilated houses have a wider range of thermal acceptance than those living in air-conditioned houses.Keywords: Thermal Sensation, PMV Model, Neutral Temperature, AMV, Climate Zones
1. Introduction
Thermal comfort is defined as “the condition of the mind in which satisfaction is expressed with the thermal environment” [1]. It is crucial for occupants’ health and well-being as well as productivity [2-3]. It also has significant effects on the energy consumption by a building’s heating, cooling and ventilation systems. This energy often is provided by fossil fuels, contributing to greenhouse gas emissions and climate change. Therefore, thermal comfort plays a vital role in building sustainability [4].
Thermal comfort sensation is different among people. Different climatic areas, such as the tropics and cold regions, may require different thermal parameters [5]. People commonly want variations in thermal environment, and the changes of the air properties are pleasurable [6]. To define the standards of thermal comfort, people have done extensive
research work during the past decades, covering many aspects related to thermal comfort in an indoor environment. Some of them established models [7-8] and indices [9]; some carried out experiments in lab chambers [7, 10] and field surveys [11-12]; and some built thermal standards and evaluation methods [8, 13]. These works make significant contributions to the establishment of thermal evaluating standards, i.e., Ergonomics of Thermal Environment and American Society of Heating, Refrigerating and Air-Conditioning Engineers Handbook-thermal comfort (ASHRAE) [14-15]. The standards focus on the correlation between thermal comfort criteria and occupants’ satisfaction or health issues and determine appropriate thermal conditions to achieve a thermal satisfaction for at least 80% of occupants in an indoor environment [16].
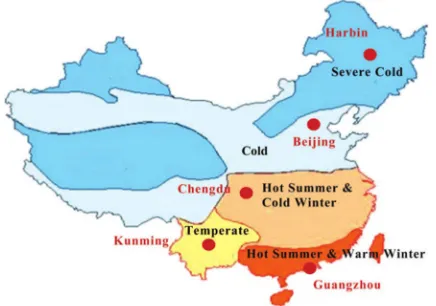
divided into five climatic zones, namely severe cold, hot summer and cold winter, temperate, and hot summer and warm winter (Figure 1). These five climate zones are defined based
on the coldest average monthly dry-bulb temperature and the hottest average monthly dry-bulb temperature (Table 1).
Table 1. Climate zones in China.
Climate zones The coldest mean monthly dry-bulb temperature The hottest mean monthly dry-bulb temperature
Severe cold climate zone <-10°C -
Cold climate zone -10°C-0°C -
Hot summer and Cold Winter 0°C-10°C 25°C-30°C
Hot summer and warm winter >10°C 25°C-29°C
Temperate zone 0°C–13°C 18°C–25°C
Figure 1. Five climate zones in China.
In China, domestic buildings occupy approximately 80% of the building sector [17], and the thermal comfort performance of domestic buildings has not been extensively investigated. Published studies have focused on indoor air temperature and relative humidity rather than evaluating thermal performance in a systematic way [18]. Moreover, the criteria of evaluating thermal comfort in China is uniform regardless of the variety of local climates. The differences in occupants’ thermal preferences remain unknown.
This study investigated domestic thermal comfort based on field studies carried out in three cities in China: Xining in the severe cold climate zone, Jinan in the cold climate zone and Guangzhou in the hot summer and warm winter climate zone. The main aim of this study was to analyze the thermal sensation of participants and identify differences of thermal comfort among the three areas, and between naturally ventilated and air-conditioned buildings. The main objectives were:
1.To conduct a comprehensive literature review on thermal comfort;
2.To compare the differences in thermal sensation in the three areas; and
3.To compare the predicted values of thermal comfort preferences of occupants in naturally ventilated and air-conditioned buildings in the three areas.
2. Thermal Sensation
The thermal comfort sensation is affected by the exchange between the human body and the surrounding environment
[19]. Typically, people prefer to associate thermal comfort directly with air temperature. However, many experiments [20] have found that six parameters have a significant influence on the sensation of thermal comfort, and thermal comfort only can be achieved when the six influential factors are in proper balance with each other. The six influential factors are as follows.
1.The indoor air temperature (IAT) (°C); 2.The mean radiant temperature (MRT) (°C); 3.The air speed (AS) (m/s);
4.The indoor relative humidity (RH);
5.The activity level of a person, commonly referred to as metabolic rate (MR).
6.Clothing insulation (Clo).
2.1. Air Temperature
Heat energy will flow from bodies at relatively higher temperature to bodies at lower temperature automatically without a driving force [21]. As a body loses heat energy, its temperature will decrease, and if heat energy flows to a body, its temperature will go up. Human body temperature will vary slightly depending on different times, environments, and activity levels. Under perfect conditions, humans can maintain a body temperature of 36-37°C. The surroundings also have an impact on body temperature. These are the person’s clothing, the air temperature, and the driving forces of heat transfer between the body and the surroundings. Among all the surrounding factors, air temperature influences human thermal sensation most, because a sudden drop or rise in air temperature will immediately cause people to feel cold or hot [22].
According to the book ‘Human Thermal Environments’ by Ken Parsons [21], air temperature can be defined as ‘the temperature of the air surrounding the human body which is representative of that aspect of the surroundings which determines heat flow between the human body and the air.’ Obviously, the air temperature will change naturally, and the air temperature relatively far from people may not determine the heat flow that people are interested in.
therefore, the mean radiant temperature, which is used to describe the average value of the overall heat exchange, has been defined by McIntyre [22] as ‘uniform temperature of an imaginary enclosure in which the radiant heat transfer from the human body is equal to the radiant heat transfer in the actual non-uniform enclosure.’ In field studies, mean radiant temperature can be calculated by using the following equation:
MRT = + 273 + 1.1 × 10 . ÷ × .
× − . − 273
where MRT is the mean radiant temperature (°C), GT is the global temperature (°C), νa is the air velocity at the level of
the globe (m/s), ε is the emissivity of the globe (for standard globe: 0.95), D is the diameter of the globe (for standard globe: 0.15m), and Ta is the air temperature (°C).
2.2. Air Velocity
Air movement across the surface of the human body will influence the heat flow from and to the body. Air flow is in three dimensions and will change with time and space, and it will influence the heat flow rate by taking warm air and vapor away from the body, thereby influencing the body temperature. Air movement can accelerate the evaporation of moisture from the skin by increasing convective heat exchange between the environment and the skin [23]. Therefore, increasing air speed is a method of cooling without changing the indoor temperature. Some naturally ventilated houses are fan assisted, and utilization of fans is based on this theory. However,
unwanted additional air movement, or draught [7], can cause a cool or even cold feeling when people have a neutral thermal sensation but can provide comfort when the temperature is high [23]. For convenience, air velocity can be regarded as the mean air velocity during a certain period and in all three dimensions [21].
2.3. Relative Humidity
Relative humidity is defined as “the ratio of the partial pressure of water vapor to the saturated vapor pressure at a given temperature.” Relative humidity plays a role in human thermal comfort, as the skin relies on the air to get rid of moisture. For example, sweating is a process that attempts to keep the body cool and maintain a normal temperature. The recommended range of indoor relative humidity is generally 30-60% [24]. Relative humidity in an indoor environment should be maintained at a comfortable range, i.e., low enough to be comfortable but high enough to avoid problems associated with dry air.
2.4. Metabolic Rate
Metabolic heat production is fundamental to maintain life. The human body can get energy from the outside environment such as light, food, and water to maintain itself and to perform external activities, e.g., physical work, sports, and daily tasks. ASHRAE standard 55 provides examples of metabolic rates that are used in evaluating thermal comfort performance (Table 2).
Table 2. Metabolic rates in thermal comfort evaluation.
Activity Met W/m2
Lying down 0.8 47
Seated quietly 1.0 58
Sedentary activity (office, home, laboratory, school) 1.2 70
Standing, relaxed 1.2 70
Light activity, standing (shopping, laboratory, light industry) 1.6 93
Medium activity, standing (shop assistant, domestic work, machine work 2.0 116
High activity (heavy machine work, garage work) 3.0 175
Table 3. Clothing insulation levels (Clo).
Clothing levels Clo W/m2K
Naked 0 0
Shorts 0.1 0.016
Typical tropical clothing outfit Briefs (underpants), shorts, open neck shirt with short sleeves, light socks and sandals 0.3 0.047
Light summer clothing Briefs, long lightweight trousers, open neck shirt with short sleeves, light socks and shoes 0.5 0.078
Working clothes Underwear, cotton working shirt with long sleeves, working trousers, woolen socks and shoes 0.8 0.124
Typical indoor winter clothing combination Underwear, shirt with long sleeves, trousers, sweater with long sleeves, heavy socks and shoes 1.0 0.155 Heavy traditional European business suit Cotton underwear with long legs and sleeves, shirt, suit comprising trousers, jacket and waistcoat
(US vest), woolen socks and heavy shoes 1.5 0.233
2.5. Clothing Insulation
Clothing acts as thermal resistance between the body and the environment in order to maintain an acceptable thermal state [21]. This function of clothing provides a dynamic response by the body to the environment. The clothing insulation level depends on how much a person is wearing. ASHRAE Standard 55 lists values of clothing insulation with
climate [25].
The human body has a continuous process of metabolic heat production, maintaining an equilibrium of heat flow to the skin, determining the skin temperature, and, through the insulation of clothing, maintaining the clothing temperature and finally the outside temperature. Therefore, the body temperature is higher than the skin temperature, and the skin temperature is higher than the clothing temperature, which in turn is higher than the environment temperature.
3. Thermal Comfort Model
Currently, two coexisting approaches are available to define thermal comfort: the heat-balance approach and the adaptive approach [26]. Usually, the heat-balance approach uses data from experimental chamber studies, while the adaptive approach uses data from field studies of occupants in indoor environments.
3.1. Heat-balance Approach
The heat-balance approach is based on the Fanger’s experiments in controlled climate chamber on 1296 young Danish students, using a steady-state heat transfer mode [7]. The 1296 students were exposed to different thermal environments, and the experiment recorded their feelings about how hot or how cold. The seven-point ASHRAE thermal sensation scale was used to present the participants’ feelings (Table 4).
Table 4. ASHRAE thermal sensation scale.
Value Sensation
+3 Hot
+2 Warm
+1 Slightly warm
0 Neutral
-1 Slightly cool
-2 Cool
-3 Cold
Fanger’s model combines the theories of heat balance with the physiology of thermoregulation and considers the six influential factors [7] to define a range of comfort temperature which occupants in indoor environment will find comfortable. To predict conditions where thermal neutrality will occur, Fanger created a comfort equation and further expanded it to the seven-point ASHRAE thermal sensation scale by using the data from 1296 participants [7]. Finally, the comfort equation became known as the “Predicted Mean Vote” (PMV) index. Fanger’s PMV model has been widely used and accepted for design and field assessment of thermal comfort [11].
The PMV index was established by Fanger’s model to predict the mean response of a large group of people based on the ASHRAE thermal sensation scale. Participants are exposed to climate chambers and asked to describe their feelings using ASHRAE seven-point scale of thermal sensation. Then, a mean vote, which represents the mean value of the occupants’
feeling under a given thermal condition, is obtained. Fanger’s equation is used to calculate the PMV for a particular combination of the six influential factors (air temperature, mean radiant temperature, relative humidity, airspeed, metabolic rate, and clothing insulation) [7].
PMV = 0.303e" . # $+ 0.028 L
Where M is the metabolic rate, L is the thermal load, defined as the differences between the internal heat production and the heat loss to the actual environment-for a person at comfort skin temperature and evaporative heat loss by sweating at the practical activity level.
Currently, PMV has been widely used to predict the thermal comfort of an indoor environment. However, the accurate prediction only can be achieved under homogenous conditions [27]. In non-homogenous conditions, such as vehicular cabins, PMV cannot provide accurate predictions. PMV commonly can be quantified by estimating the personal factors (human activity level and clothing insulation) and measuring the environmental factors (air temperature, air velocity, radiant temperature, and relative humidity). PMV also can be determined by using thermal simulation software, such as IES-VE and Energy-plus. The way of using thermal simulation software to calculate PMV has been widely accepted since it is cost effective and time-saving.
3.2. Adaptive Approach
The adaptive approach is developed based on the field studies to analyse the real comfort level of the thermal environment. It is affected significantly by the specific thermal context, the occupants’ behavior and the occupants’ expectations [5]. Adaptive approach normally could provide more reliable information about the actual comfort level of the indoor environment and more certain interacting parameters. Moreover, some factors which chamber studies cannot produce, such as occupants’ everyday habits, various clothing insulation levels, and unrestricted activities levels, can be analysed based on the data recorded in field studies [28]. Therefore, in recent years, many researchers have been encouraged to use an adaptive approach to evaluate thermal comfort of an indoor environment. However, the adaptative approach requires typically much more time-input, and human resources input since data are all obtained by field studies, such as survey, interview, field measurements, and questionnaires.
4. Research Methods
Question 1: How are you feeling at this precise moment?
-4 -3 -2 -1 0 1 2 3 4
Very cold Cold Cool Slightly cool Neutral Slightly warm Warm Hot Very hot
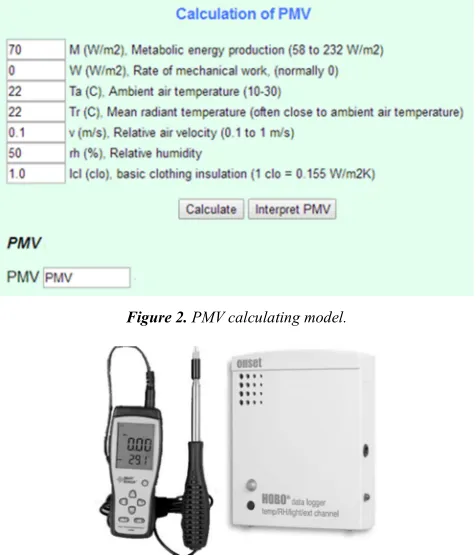
The heat-balance approach is mainly used to calculate the PMV of participants. Figure 2 shows the PMV calculator used in this study. The clothing level, indoor temperature, mean radiant temperature, metabolic rate of the participants, air speed, and indoor relative humidity should be entered in the blanks, and then the PMV values can be calculated. To measure the indoor air temperature and relative humidity, a device called a HOBO data logger was applied. A 38 mm ping-pong ball connected to the HOBO data logger during the survey was used to measure the global temperature. A hot-wire anemometer was used to measure the indoor air temperature and the air speed near the sensor (Figure 3).
Figure 2. PMV calculating model.
Figure 3. HOBO data logger and hot-wire anemometer.
5. Data Collection
Tables 5 to 7 summarize the estimation results of the three field studies. The Guangzhou field study was carried out between 10 and 14 May 2016. Guangzhou is a big city located in southern China with a hot and humid climate throughout the whole year, especially in summer. In total, 24 participants from 8 residential buildings were involved. Only building 1 was cooled by air conditioners, while buildings 2 to 8 were naturally ventilated with fans. The metabolic rate for participants was 1.2.
The field study in Jinan was conducted between 13 and 15 July 2016. Jinan is a city located in north-east of China, with a very hot summer. July is usually the hottest period, with the average air temperature over 30°C. In total, there were 8 residential buildings with 16 participants involved. Buildings 1 to 4 were naturally ventilated, while buildings 5 to 8 were air-conditioned. Additionally, the metabolic rate for participants was 1.1.
The filed study of Xining was conducted between 11 and 15 August 2016. Xining is located in north-west China, with a highland climate. It usually has low temperatures throughout the year. The field measurements involved 23 residential buildings with 23 participants, and all the buildings were naturally ventilated because the occupants do not require air conditioners in such a cool climate region. The metabolic rate for participants was 1.0.
In all three field studies, the measurements can be divided into subjective measurements, which were derived in the form of a questionnaire, and objective measurements, which were recorded during surveys. The basic objective information (e.g., clothing insulation, metabolic rate) was recorded when the measurements were being done, which can reduce errors due to time lag. Notably, the total clothing insulation is the sum of clothing insulation plus chair insulation, which is assumed to be 0.15.
Table 5. Data collection of Guangzhou (10 and 14 May 2016).
Buildings Cooling method Participants number PMV AMV
1 Air conditioned
1 -0.32 -0.5
2 -0.71 -0.8
3 -0.61 -0.8
2 Fan assisted NV 4 1.47 1.0
5 1.68 1.1
3 Fan assisted NV 6 1.95 2.2
7 1.99 1.3
4 Air conditioned 8 0.1 0.3
9 0.2 -0.3
5 Fan assisted NV
10 1.99 0.4
11 1.94 2.4
12 1.76 0.5
Buildings Cooling method Participants number PMV AMV
6 Fan assisted NV 14 1.5 1.1
15 1.44 0.8
7 Fan assisted NV
16 1.11 0.4
17 0.92 0.5
18 1.22 2.4
8 Fan assisted NV
19 0.23 0.5
20 0.49 1
21 0.26 0.6
22 -0.35 -1.7
23 0.14 -0.7
24 -0.63 -0.9
Table 6. Data collection of Jinan (13 and 15 July 2016).
Buildings Cooling method Participants number PMV AMV
1
Natural ventilated
1 -0.09 1.05
2 -0.26 0.15
2 3 -0.43 0.19
4 -0.34 0.35
3 5 0.15 0.67
6 0.13 -0.125
4 7 0.18 0.865
8 -0.01 0.67
5
Air-conditioned
1 1.26 0.95
2 1.2 0.7
6 3 -0.52 0.15
4 -0.17 -0.15
7 5 0.75 0.58
6 0.72 0.46
8 7 0.41 0.15
8 0.78 0.65
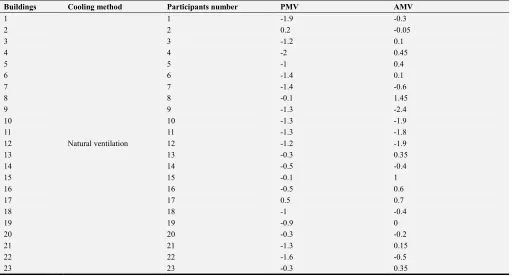
Table 7. Data collection of Xining (11 and 15 August 2016).
Buildings Cooling method Participants number PMV AMV
1
Natural ventilation
1 -1.9 -0.3
2 2 0.2 -0.05
3 3 -1.2 0.1
4 4 -2 0.45
5 5 -1 0.4
6 6 -1.4 0.1
7 7 -1.4 -0.6
8 8 -0.1 1.45
9 9 -1.3 -2.4
10 10 -1.3 -1.9
11 11 -1.3 -1.8
12 12 -1.2 -1.9
13 13 -0.3 0.35
14 14 -0.5 -0.4
15 15 -0.1 1
16 16 -0.5 0.6
17 17 0.5 0.7
18 18 -1 -0.4
19 19 -0.9 0
20 20 -0.3 -0.2
21 21 -1.3 0.15
22 22 -1.6 -0.5
6. Analysis of Results
6.1. Correlation Between Indoor and Outdoor Aisr Temperature
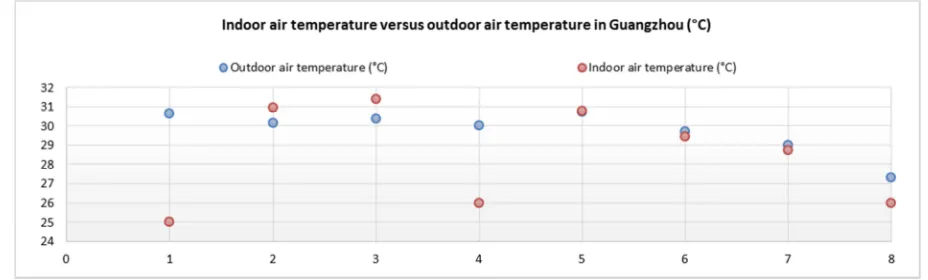
Figure 4 shows the combination of indoor and outdoor temperature of buildings investigated in Guangzhou. House-holds 1 and 4 are ventilated by air conditioners, while the others are all naturally ventilated. The indoor temperature in houses 1 and 4 is fully maintained by an air-conditioning system and can be controlled by occupants according to their thermal preference. It should be noted that the indoor air temperature in naturally ventilated buildings is quite close to the outdoor air temperature. Thus, it can be concluded that outdoor climate has a significant influence on indoor air temperature, and in hot and humid climate zones, overheating
and thermal discomfort might happen in those buildings. Although some naturally ventilated houses are fan assisted, the fans can only increase air movement, influencing the occupants’ thermal sensation. However, fans do not affect the indoor temperature at all. People who sit near fans may feel cooler than the actual environment, because the fans can help increase air movement inside the house, which can make the evaporation process faster to bring heat out of the body; thus, making people feel cooler without making the indoor temperature lower. In houses that are fully air-conditioned, there is no direct link between outdoor temperature and indoor temperature, which illustrates that the outdoor climate cannot have any influence on houses that are fully air-conditioned.
Figure 4. Indoor air temperature versus outdoor air temperature in Guangzhou.
Figure 5 indicates indoor air temperature versus outdoor air temperature in Jinan. The pattern of plots is similar to Jinan. In air-conditioned buildings, indoor air temperature is more stable than outdoor air temperature. In naturally ventilated buildings, there seems to be no regular pattern to show how outdoor temperature can influence the indoor living environment. For buildings 1, 3, and 4, the indoor temperature
is kept at around 28°C even though the outdoor temperature is only around 26°C. Therefore, overheating is more likely to happen when the outdoor air temperature goes above 30°C. Consequently, occupants of these houses may need air-conditioning units to avoid overheating during the hottest periods.
Figure 5. Indoor air temperature versus outdoor air temperature in Jinan.
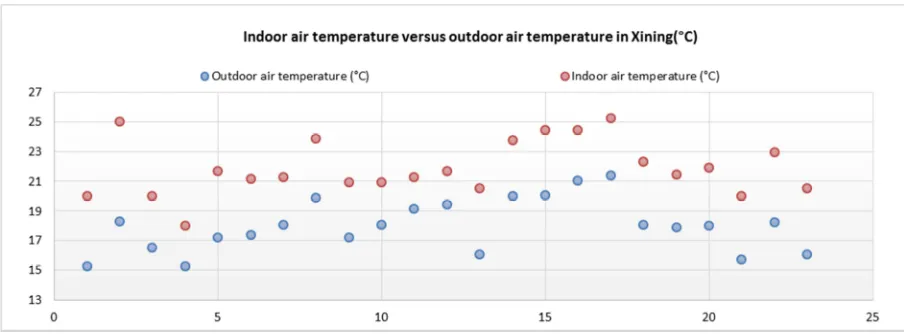
Figure 6 shows indoor air temperature versus outdoor air temperature in Xining. All the investigated buildings are naturally ventilated. The indoor air temperatures are higher than the outdoor air temperatures, and a consistent tendency is
Figure 6. Indoor air temperature versus outdoor air temperature in Xining.
Figure 7 indicates the correlation between AMV and indoor air temperature of domestic buildings in Guangzhou. Neutral temperature in Guangzhou is calculated to be 26.905°C. This means that most people in Guangzhou preferred to live in an environment with a temperature of 26.905°C during the period when the experiment was done. Figures 8 and 9 indicate the correlations between AMV and indoor air temperature in Jinan and Xining. The neutral air temperature of domestic buildings in Jinan and Xining are 25.276°C and 21.970°C, respectively.
Thus, it is noticed that people living in a hot climate zone (Guangzhou) have a higher neutral air temperature than people living in cold and severe cold climate zones. They have
adapted to tolerate higher body temperatures than people living in other areas. People in Xining have the lowest neutral air temperature, since they have a strong adaptation to the cold climate. Therefore, it can be concluded that neutral air temperature is largely determined by local climate conditions.
The red points in Figures 7, 8 and 9 show that participants felt warm when they stayed in an environment where the temperature was lower than the neutral air temperature. The reason might be that their clothing insulation level was higher than the average or there was no air movement around them, so there was no extra force to accelerate evaporation cooling; therefore, they felt warmer than in the neutral environment.
Figure 7. Correlations between AMV and indoor air temperature in Guangzhou.
Figure 9. Correlations between AMV and indoor air temperature in Xining.
6.3. Correlation Between PMV and AMV
The correlation between AMV and PMV is based on an ordinal linear regression, where R2 is usually used to describe whether the regression model is suitable for the actual data. R2 is a value ranging from 0 to 1. If the R2 value is closer to 1, it indicates that the model is better correlated with the actual data collected from the experiment [29].
Figure 10 illustrates the correlations between AMV and PMV in the three field studies. The total R2 is 0.4387, which shows a low level of correlation. Thus, the PMV model does not work accurately to reflect the real thermal sensation of
occupants. Figure 11 shows the correlation between AMV and PMV in air-conditioned buildings. The R2 is 0.8084, showing a strong level of correlation between AMV and PMV. That means the PMV model provides values close to the participants’ thermal preference. This is consistent with previous field studies showing that the PMV model is suitable to predict thermal sensation for occupants in air-conditioned buildings [30]. Figure 12 shows the correlation between AMV and PMV in naturally ventilated buildings. The R2 is 0.4311, indicating a low level of correlation.
Figure 10. Correlations between AMV and PMV of the three field studies.
Figure 12. Correlations between AMV and PMV in naturally ventilated buildings.
Thus, it can be noticed that predicting the thermal sensation of occupants in naturally ventilated buildings with the PMV model is not accurate to reflect the real thermal comfort sensation. A few reasons can explain this low level of correlation. For example, fan-assisted naturally ventilated buildings normally have a more complicated thermal environment than air-conditioned buildings. The indoor air speed varies in different places, and people sitting near or far away from fans may have different thermal sensations due to the air movement. In real practice, air infiltration through cracks also can lead to turbulence inside the room, causing changes in the thermal environment. Humidity can influence the properties of the air that people breathe and the evaporation rate from the skin to the air, resulting in different thermal sensations. In the PMV model, some parameters are not taken into consideration and changes in air speed and humidity will not give rise to a big difference in the thermal comfort value that the model predicts. This can significantly influence the actual mean thermal sensation of occupants, resulting in inaccuracy.
7. Conclusion, Limitations and Future
Work
The main aim of this study was to conduct surveys and analyse domestic thermal comfort in three areas: severe cold climate zone, cold climate zone and hot summer and warm winter zone. The raw data used in this field study were based on three field studies. In the three field studies, 63 participants were involved: 24 participants in Guangzhou, living in both naturally ventilated houses and air-conditioned houses; 16 participants in Jinan, in both naturally ventilated houses and air-conditioned buildings; and 23 participants in Xining, living only in naturally ventilated houses. Through the raw data from the field studies and the results in this study, some conclusions are as follows.
The outdoor climate can influence indoor temperature in naturally ventilated buildings, because occupants can change their thermal environment slightly by opening windows or doors. Therefore, the indoor air temperature may vary with
time and season. However, in fully air-conditioned houses, there is no direct relationship between indoor air temperature and outdoor climate. The indoor thermal environment in air-conditioned houses can be configured by occupants according to their thermal preference.
Fanger’s PMV model was good at predicting occupants’ thermal sensation in air-conditioned houses but failed at predicting thermal sensation in naturally ventilated houses. By comparing PMV and AMV in air-conditioned houses and naturally ventilated houses, it can be concluded that the correlation between the two in air-conditioned houses is high, but there is hardly a correlation between them in naturally ventilated houses. This proves that there is a very close relationship between AMV values and PMV values in air-conditioned houses, while there is a large discrepancy in naturally ventilated houses.
This research was based on data that collected from three field studies in three climate zones of China. To analyse human thermal comfort, a significant number of individuals need to be involved in the field studies. Due to some constraints, such as time and getting into participants’ houses, a large sample could not be achieved. Therefore, the samples here were relatively small, compared to Fanger’s PMV model, which had more than 1000 subjects.
This study analysed how well Fanger’s PMV model can predict occupants’ thermal sensation, and the results indicate that the model is good at predicting thermal sensation for occupants in air-conditioned houses. However, the model is not suitable for occupants in naturally ventilated houses. Therefore, in future work, researchers should aim to produce a model that is accurate at predicting thermal sensation for occupants in naturally ventilated houses.
All three field studies were carried out in summer so it will be interesting to see how thermal models can predict thermal sensation for occupants in these buildings in winter and how the participants will respond to their thermal environment.
Acknowledgements
study. The authors are extremely grateful for the undergraduate students who took the field measurements and did the data collection. They are Xiaoqian Yu, Zongquan Sun, Jinhao Zhang, Wanting Cheng, Na An, Zhongyu Shi and Da Xu.
References
[1] ASHRAE.org. Standard 55 – Thermal Environmental
Conditions for Human Occupancy
https://www.ashrae.org/technical-resources/bookstore/standard -55-thermal-environmental-conditions-for-human-occupancy (accessed Dec 31, 2018).
[2] Taylor, P.; Fuller, R.; Luther, M. Energy Use and Thermal Comfort in A Rammed Earth Office Building. Energy and Buildings 2008, 40, 793-800.
[3] Wagner, A.; Gossauer, E.; Moosmann, C.; Gropp, T.; Leonhart, R. Thermal Comfort and Workplace Occupant Satisfaction—Results of Field Studies in German Low Energy Office Buildings. Energy and Buildings 2007, 39, 758-769. [4] Yao, R.; Li, B.; Liu, J. A Theoretical Adaptive Model of
Thermal Comfort – Adaptive Predicted Mean Vote (Apmv). Building and Environment 2009, 44, 2089-2096.
[5] Djongyang, N.; Tchinda, R.; Njomo, D. Thermal Comfort: A Review Paper. Renewable and Sustainable Energy Reviews 2010, 14, 2626-2640.
[6] de Dear, R. The Theory of Thermal Comfort in Naturally Ventilated Indoor Environments - “The Pleasure Principle”. International Journal of Ventilation 2009, 8, 243-250. [7] Fanger, P. Thermal Comfort; 1st ed.; Copenhagen: Danish
Technical Press: Copenhagen, 1970; pp. 1-244.
[8] de Dear, R.; Brager, G. Thermal Comfort in Naturally Ventilated Buildings: Revisions to ASHRAE Standard 55. Energy and Buildings 2002, 34, 549-561.
[9] Gagge, A.; Fobelets, A.; Berglund, L. A standard predictive index of human response to the thermal environment https://www.aivc.org/sites/default/files/airbase_2522.pdf (accessed Dec 31, 2018).
[10] Nakano, J.; Tanabe, S.; Kimura, K. Differences in Perception of Indoor Environment Between Japanese And Non-Japanese Workers. Energy and Buildings 2002, 34, 615-621.
[11] Lin, Z.; Deng, S. A Study on The Thermal Comfort in Sleeping Environments in The Subtropics—Measuring the Total Insulation Values for The Bedding Systems Commonly Used in The Subtropics. Building and Environment 2008, 43, 905-916.
[12] Han, J.; Zhang, G.; Zhang, Q.; Zhang, J.; Liu, J.; Tian, L.; Zheng, C.; Hao, J.; Lin, J.; Liu, Y. et al. Field Study on Occupants’ Thermal Comfort and Residential Thermal Environment in A Hot-Humid Climate of China. Building and Environment 2007, 42, 4043-4050.
[13] Olesen, B.; Parsons, K. Introduction to Thermal Comfort Standards and to the Proposed New Version of EN ISO 7730. Energy and Buildings 2002, 34, 537-548.
[14] Malchaire, J. ISO 7933: 2004
https://www.iso.org/standard/37600.html (accessed Dec 31, 2018).
[15] Parsons, R.; Kuehn, T.; Couvillion, R.; Coleman, J.; Suryanarayana, N.; Ayub, A. 2005 ASHRAE Handbook; ASHRAE: Atlanta, GA, 2005.
[16] Charles, K. Fanger's Thermal Comfort and Draught Models https://nparc.nrc-cnrc.gc.ca/eng/view/fulltext/?id=7525d344-a 508-4fdc-9c04-d9d3a9767bdb (accessed Dec 31, 2018). [17] China National Statistical Bureau. China Statistic Yearbook
2018. Beijing: China Statistical Press. 2018 [Online] Available at: http://www.stats.gov.cn/tjsj/ndsj/2018/indexch.htm. (accessed Jan 22, 2019).
[18] Lan, L.; Lian, Z.; Liu, W.; Liu, Y. Investigation of Gender Difference in Thermal Comfort for Chinese People. European Journal of Applied Physiology 2008, 102, 471-480.
[19] Mariana, I.; Catalin, N.; Stefan, T.; Ion, T. THE HUMAN THERMAL COMFORT EVALUATION INSIDE THE
PASSENGER COMPARTMENT
https://www.theseus-fe.com/ths_content/publications/articles/ 2010_paper_uni-pitesti_the-human-thermal-comfort-evaluatio n-inside-the-passenger-compartment_en.pdf (accessed Dec 31, 2018).
[20] Berglund, L. Mathematical Models for Predicting the Thermal Comfort Response of Building Occupants. In 1978 ASHRAE Winter Conference; GA: Atlanta, 1978; pp. 1-15.
[21] Parsons, K. Human Thermal Environments: The Effects of Hot, Moderate, And Cold Environments on Human Health, Comfort, And Performance; 2nd ed.; CRC Press, 2002.
[22] McIntyre, D. A. Indoor Climate. Applied Science Publishers LTD, London, 1980.
[23] ISO 7730: 2005: 2005
https://www.iso.org/standard/39155.html (accessed Mar 7, 2019).
[24] Wolkoff, P.; Wilkins, C.; Clausen, P.; Nielsen, G. Organic Compounds in Office Environments - Sensory Irritation, Odor, Measurements and The Role of Reactive Chemistry. Indoor Air 2006, 16, 7-19.
[25] Hwang, R.; Cheng, M.; Lin, T.; Ho, M. Thermal Perceptions, General Adaptation Methods and Occupant's Idea About the Trade-Off Between Thermal Comfort and Energy Saving in Hot–Humid Regions. Building and Environment 2009, 44, 1128-1134.
[26] Doherty, T.; Edward, A. Evaluation of The Physiological Bases of Thermal Comfort Models. ASHRAE Transactions 1988, 94, 1-16.
[27] Alahmer, A. Effect of Relative Humidity and Temperature Control on In-Cabin Thermal Comfort State. Ph. D., Clemson University, 2011.
[28] Cena, K.; de Dear, R. Thermal Comfort and Behavioral Strategies in Office Buildings Located in A Hot-Arid Climate. Journal of Thermal Biology 2001, 26, 409-414.
[29] Skyes, A. An introduction to Regression Analysis https://pdfs.semanticscholar.org/7a07/5776db74495a03ca3875 0513f331b80f687e.pdf (accessed Mar 7, 2019).