http://www.sciencepublishinggroup.com/j/ijefm doi: 10.11648/j.ijefm.20200801.11
ISSN: 2326-9553 (Print); ISSN: 2326-9561 (Online)
Trade Openness for Developing Nations: A Charade or
Desideratum for Viable Commodity Export Performance
Edward Ogbonnia Eleje
1, Okechukwu Agha Eze
2, Ishiaku Irom Agabi
11
Department of Banking and Finance, Federal University, Wukari, Nigeria 2
Liquidity Management Unit, Treasury Department Keystone Bank Limited, Lagos, Nigeria
Email address:
To cite this article:
Edward Ogbonnia Eleje, Okechukwu Agha Eze, Ishiaku Irom Agabi. Trade Openness for Developing Nations: A Charade or Desideratum for Viable Commodity Export Performance. International Journal of Economics, Finance and Management Sciences.
Vol. 8, No. 1, 2020, pp. 1-8. doi: 10.11648/j.ijefm.20200801.11
Received: December 6, 2019; Accepted: December 23, 2019; Published: January 4, 2020
Abstract:
Openness to trade is one basic factor spotted as major determinant of whether a country is prone to sudden stops in capital inflow, product glut, or severe economic recession. To some researchers, trade openness raises vulnerability to sudden shocks and creates difficult economic scenario; to others, it makes adjustment to crises less painful and stimulates effective economic performance. It is on the premise of the foregoing arguments that this study sought to evaluate the effect of trade openness on primary commodity export trade. To achieve this, the study utilized disaggregated oil and nonoil primary commodity export data and Gross Domestic Product (GDP) from Nigeria for a period of 30 years (1989-2018). Data were first subjected to diagnostic tests aided by STATA econometric to check the presence of unit root, multicollinearity and autocorrelation. Cointegration analysis was performed using Johanson and Juselius maximum likelihood estimation. Diagnosed data were regressed to generate optimal multivariate estimators of the cointegrating parameters at 95% level of confidence. Trade openness was negative but not significant on nonoil export. It was however positive but not significant on oil export. The paper concludes that while trade openness could be permissible on oil export in Nigeria, it is a charade on nonoil export. The study therefore recommends among other things the adoption of partial openness policy in developing nations especially Nigeria such that will involve the employment of liberal trade in the oil export subsector and trade protection in the nonoil subsector respectively.Keywords:
Export Growth, Liberal Trade, Primary Commodity, Openness, Trade Barrier1. Introduction
By trade openness we epitomize, free market interplay by all economic agents involved in international trade. It suggests the removal of import quotas and other quantitative restrictions, abolition and dispersion of import tariff rates, elimination of non-tariff barriers, removal of export taxes, removal of protection for local industries, and, withdrawal of export subsidies among others [1-4]. The economic justifications for trade openness have over the years been debated extensively [5-9]. The positive rationale is often based on the view that it results in efficient allocation and utilization of resources through inter alia, the exposure of the domestic economy to world market disciplines and better access to state-of-the-art technologies. Again, the motivation for a more open economy is based on simple but powerful
Since the mid-1980s, developing countries have massively embarked on widespread trade openness. The decision however was not informed by multilateral trade negotiations; rather, it was in response to the International Monetary Fund (IMF)’s conditionalities attached to the Structural Adjustment Programmes (SAPs) which developing countries were wheedled to implement by the Bretton Woods Institutions. Research efforts on the preparedness of the developing nations to openness policy indicate that the process of liberal trade in the developing countries especially in Africa occurred without prior preparations to ensure that domestic industries were ready to face exposure to international competition. Hence, instead of the policy to achieve full industrialization and stabilization goals, evidence show that many of the developing countries became de-industrialized [11-15]. Obadan [7] asserts clearly that ‘a sudden roll back of trade protection, together with devaluations, demand restraint and removal of subsidies, as well as hikes in interest rates tended to lower capacity utilization in industry and gradually eroded the industrial base’.
Admittedly, it is argued that modern neoclassical economic theory of trade openness is based on perfectly competitive markets. As such, liberal trade openness policy often disregards the level of development, industrial base and special structural characteristics of individual countries [16-18]. Oftentimes, the policy is based on a general theoretical abstraction, that is; the Recardian theory of static comparative advantage. This theory involves unrealistic assumptions such as perfect functioning of markets in all countries, no externalities and no other causes of market failure, as well as constant returns to scale. From these assumptions, one wonders if trade openness can significantly improve social welfare in economies featured by market imperfections. It is therefore in the light of this research puzzle that this paper is built. By employing primary commodity export data and GDP figure from a prototype developing nation Nigeria for a period of 38 years, the paper empirically evaluated the implications of trade openness on primary commodity export trade performance in developing nations with particular emphasis on the Nigerian economy. Obviously, the study shall directly benefit governments of developing countries including Nigeria, oil and nonoil primary commodity exporters, global economic watchers, market regulators, policy analysts and the global public.
2. Literature Review
2.1. Conceptual Clarification
Over time, the definition of openness has evolved considerably from one extreme to another. Even today, it is still very vogue as to what describes ‘‘openness’’ in a given economy. Krueger, [19] for instance asserts that ‘‘a regime could be fully liberalized and yet employ exceedingly high tariffs in order to encourage import substitution.’’. What Krueger is saying is that one country can have an open economy by employing a favorable exchange rate policy
towards its export sector and at the same time, use trade barriers to protect its importing sector. To Harrison [20], the concept of openness as applied to trade policy could be synonymous with the idea of neutrality. Neutrality means that incentives are neutral between saving a unit of foreign exchange through import substitution and earning a unit of foreign exchange through exports. Clearly, a highly export oriented economy may not be neutral in this sense, particularly if it shifts incentives in favor of export production through instruments such as export subsidies. It is also possible for a regime to be neutral on average, and yet intervene in specific sectors. Thus, a good measure of trade policy would capture differences between neutral, inward-oriented, and export-promoting regimes [21-23].
Recently, the meaning of ‘‘openness’’ has become similar to the ideology of ‘‘free trade’’, that is a trade system where all trade distortions are eliminated. Therefore, it is crucial to understand this definition problem because various openness measures have different theoretical implications for growth and different linkages with growth. However, empirical studies are not usually clear on this issue as Edwards [23] stated, “the literature on the subject has not always been successful in dealing with precise definitions of trade regimes, nor has it been able to handle successfully the difficult issue of measuring the type of trade orientation followed by a particular country”. However, the most basic measure of openness of which is employed in this current research is the simple trade shares. This is exports plus imports divided by GDP [1, 3, 4, 21].
2.2. Theoretical and Empirical Justifications
The existence of a relationship between trade openness and export growth seems incontestable as many researchers have worked on the issue and confirmed it. What is debatable is the possible direction and magnitude of the relationship. Earlier neoclassical or exogenous growth theories and models were mute on the relationship between trade and growth. Theoretical debates on such linkage are rooted to the endogenous growth theory. This theory stipulates that growth is primarily the result of internal (endogenous) and not external force [24]. The theory is of the view that investment in human capital, knowledge; innovation and change are significant contributors to economic growth. Endogenous growth theory further holds that policy measures can have an impact on the long-run growth rate of an economy. One of the major implications of this growth theory is that policies which embrace openness, competition, change and innovation will promote growth [25]. Conversely, policies which have the effect of restricting or slowing change by protecting or favoring particular industries or economy are likely over time to slow growth to the disadvantage of the community. Another implication of the theory with respect to the assumption of positive correlation between size and growth is that trade liberalization may be growth enhanced. The initial endogenous growth research was based on the works of Arrow [26], Hirofumi [27], and Miguel [28].
including individual country-studies, time-series studies, panel studies, and broad cross-country comparisons all in attempt to demonstrate a link between trade and long-run economic growth. Precisely, a large number of empirical studies have made use of a variety of cross-country growth regressions to test endogenous growth theory and the importance of trade policies [29-31]. Probably due to the difficulty in measuring openness, different researchers have used many different measures to examine the effects of trade openness on growth. An ideal measure of a country’s openness would be an index that includes all the barriers that distort international trade such as average tariff rates and indices of non-tariff barriers [21, 32]. However, it is not always possible due to data insufficiency. Thus, some other studies have used available data to construct indices for measuring trade openness [4, 33-34].
In their study, Winters, et. al, [32] found that liberalized economies are less stable. They argue that in a liberalized system, government’s ceilings or floor prices are de-emphasized while market equilibrium are fixed by price mechanism. Bacchetta, et. al, [1] in agreement with Winters, et. al, [32] submit that open economies subject participating nations to external shocks. Earlier, Rodrik [35] offered explanation for such shock as he found positive correlation between openness and government size. He explained that more open economies have bigger governments; as such, government spending is used to cushion those external shocks. Meanwhile, output volatility as induced by trade openness can have serious implications. Aizenmann and Marion [36] have found that higher output volatility reduces private investment. There is also evidence that the adverse effects of output fluctuations are felt most strongly by the poorest households who lack the resources to smooth consumption. Research studies have also shown that if export markets display random, undiversifiable shocks, greater openness increases exposure. In their empirical tests covering 1980-88, however, Razin and Rose [37] found no significant correlations between openness and volatility mainly because many shocks appear to be common across countries. Easterly and Kraay [38], on the other hand, found that small states which are generally more open than larger states tend to have more volatile growth rates, albeit around higher averages. The reason is not that their terms of trade are more volatile but that a given terms of trade volatility has greater effects on output the more open the economy.
Furthermore, the Prebisch-Singer hypothesis suggests that if the supply of primary products is relatively price inelastic compared to that of manufactures, fluctuations in world demand will make primary commodity prices more volatile than those of manufactures [39]. The implication of this is that if trade policy encourages specialization towards primary commodities, it will increase the volatility of developing countries’ terms of trade. However, Lutz and Singer [40] found the very opposite; a mild tendency for openness to reduce volatility, while Easterly and Kraay [38] found no relationship between volatility and country size which, in turn, is correlated with openness. Bevan, Collier, and Gunning [41]
however suggest that the causality between the terms of trade and openness may operate in the opposite direction, with terms of trade shocks giving rise to trade reform. They cited the case of Kenya in which an increase in the world price of coffee raised government revenues and consequently public expenditure on infrastructure. When prices fell, the government liberalized in order to access foreign finance for their expenditure programmes. This is a plausible observation and one which could dominate any empirical relationship between trade liberalization and the terms of trade. However, it concerns a single specific change in the terms of trade, not volatility per se. Winters, et. al. [32] Opine that it is possible that a series of such episodes would suggest a connection between repeated terms of trade changes and increasing liberalization, but the case remains to be made.
3. Methodology
3.1. Empirical Design and Data
The paper employed ex-post facto research design. Analytical data employed were basically Nigeria primary commodity exports. For robustness sake, the data were decomposed into nonoil primary commodity exports, oil commodity exports, and total primary commodity exports respectively. Nigeria Gross Domestic Product (GDP) was used to determine the country’s degree of openness. Above data were observed over a 30-year (1989–2018) post SAP export liberalization period and covered other subsequent trade liberalization policies of the federal government of Nigeria.
3.2. Analytical Econometric and Justifications
The adopted model for the paper draws theoretical strength from endogenous growth models. Endogenous growth models among other things demonstrate the channel by which trade policies affect trade growth and economic development. Accordingly, the model chosen is consistent with numerous previous studies [1, 4, 42-43]. Along these lines, the model for the present study is as follows:
NIGxportg=β0+β1OPENvoli, t+β2 (CONTROL)+µit
Where:
NIGxportg=Growth rates of Nigeria’s commodity exports
discomposed into:
GRnoilpx=Growth rate of nonoil primary Commodity export in Nigeria
GRoilxp=Growth rate of oil primary Commodity export in Nigeria, and;
GRtpcx=Growth rate of total primary commodity exports in Nigeria.
OPEN=Openness Index
CONTROL=Nigeria’s share in world trade proxied by index of Integration
3.3. Augmented Dickey-Fuller (ADF) Unit Root Test
δ=0) is rejected, the time series is stationary. This implies that the time series is non-stationary if p=1 (δ=0). Conversely, the alternative hypothesis for ADF and MacKinnon test is that δ < 0 or p < 1. Accordingly, this paper tested to see if p=1 (δ=0); that is, if p is a unit root. Out of the five research variables measured, two were non-stationary in their levels but non-stationary at first difference, that is, the variables were integrated of order I (1); the remaining three variables were stationary in their levels, that is, the variables were integrated of order I (0). The summary results of the ADF econometrics are shown in table 1.
Table 1. Summary Results of Augmented Dickey-Fuller (ADF) Unit Root Test.
Variables ADF Decisions
Mackinnon Approx. P-value for Z (t)
In (grnoilpx) 0.3358 1 (0)
∆ In (grnoilpx) 0.0099* I (1)
In (groilxp) 0.0071* I (0)
In (grtpcx) 0.0084* I (0)
In (openness) 0.0420** I (0)
In (Integration) 0.1694 1 (0)
∆ In (Integration) 0.0046* I (1)
Note: (1)* & ** Indicate that the corresponding null hypothesis is rejected at 1% and 5% significance levels respectively. (2) The stochastic time series properties are integrated of order one, I (1) and; order zero I (0).
3.4. Autocorrelation Function (ACF) and Correllogram Test
Although ADF is frequently and widely used due to its ability to take into consideration the autocorrelation adjustments, it has the lapses of arbitrary choice of the proper order of autocorrelation. Based on this fact, this paper further employed the Yule-Walker ACF and Correllogram statistics which is robust to any form of autocorrelation. The ACF at lag k denoted by pk is the ratio of the covariance at lag k to its variance where pk lies between -1 and+1. Plotting pk
against k gave the population correllogram whose realization is the sample of the stochastic process. But a plot of k
against k gave the sample correllogram which is the determinant of stationarity. The above process was completed for the five variables using STATA econometrics. An examination of each of the five diagrams (available on
request) confirms that all the five correllograms are purely white noise. For a purely white noise stochastic process, the autocorrelation at various lags hovers around zero. This invariably is a picture of a correllogram of a stationary time series.
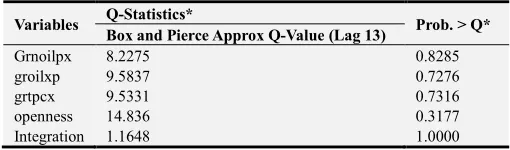
The Q-statistic is used as a test of whether a time series is white noise. The null hypothesis of Q is that the sum of the squared estimated autocorrelation coefficients is zero (0). Table 2 is a summary of the Q statistics of each of the five variables at lags 13 as well as their various probabilities. It is evident from the table that the probability of obtaining each of the Q values under the null hypothesis that the sum of 13 squared estimated autocorrelation coefficients is zero is practically not true for any of the five variables. Therefore, all the time series variables are stationary hence, reinforcing our hunch from the above ADF test.
Table 2. Summary Statistics of Yule-Walker Autocorrelation Function (ACF).
Variables Q-Statistics* Prob. > Q*
Box and Pierce Approx Q-Value (Lag 13)
Grnoilpx 8.2275 0.8285
groilxp 9.5837 0.7276
grtpcx 9.5331 0.7316
openness 14.836 0.3177
Integration 1.1648 1.0000
3.5. Cointegration Analysis
Again, the Johanson and Juselius (1990) maximum likelihood estimation test was conducted. Specifically, the approach was employed to verify whether a stable longrun equilibria relationship exists between the decomposed dependent primary commodity export variables and trade openness respectively. The test was based on the comparison of H0 (r=0) against the alternative H1 (r 0) where “r”
represents the number of cointegrating vectors. Table 3 reports the trace statistics from the cointegration result output. Evidence from the trace statistics suggest that the null hypothesis of no cointegration (r=0) can be rejected as 1 cointegrating vector is verified for each of the decomposed models. This implies the existence of steady state longrun equilibria relationship between the dependent and the independent variables of the study.
Table 3. Trace Statistics Summary for Johanson Tests of Cointegration.
Hypothesized No. Of CEs* Trace Statistics 5% Critical
Value Nonoil & Trade Openness Oil & Trade Openness TPricom. & Trade Openness
None _ _ _ 47.21
At Most 1 54.8267 53.3721 54.1643 29.68
At Most 2 11.4184* 12.1303* 11.5132* 15.41
At Most 3 2.2404 2.0120 1.0985 3.76
3.6. Multicollinearity Analysis
It was also important to check for the presence of multicollinearity among the Regressors. This is because serious multicollinearity leads to large standard errors as well as spurious regression result. Accordingly, two most widely used methods; pairwise correlations and eigenvalue/condition
indication of low multicollinearity.
Table 4. Summary Statistics of Pairwise Correlation among the Variables.
Primary Exports Openness Integration
Non-Oil -0.0289 0.0744
Oil 0.0060 0.2709
Total 0.0090 0.2740
Again, to substantiate the result of the above pairwise estimate, the eigenvalues and the condition index (CI) were used to further diagnose multicollinearity. Using eigenvalue, if k is between 100 and 1000, there is moderate to strong
multicollinearity and if it exceeds 1000, there is severe multicollinearity. Alternatively, if the CI is between 10 and 30, there is moderate to strong multicollinearity and if it exceeds 30, there is severe multicollinearity [45]. Table 5 represents the computed eigenvalues and condition index from the Johanson tests of cointegration estimated for the study. The summary statistics show that approximate eigenvalues were far below 100 while condition indexes were far below 10. This is a near linear tendency and an indication of low multicollinearity hence, reinforcing our hunch from the pairwise correlation estimate.
Table 5. Computed Eigenvalues (k) Vs Condition Index (CI).
Research Variables Approx. Eigenvalues (k) Condition Index (CI)
Noilprcom Vs. Trade Openness 2.62 1.62
Oilprcom Vs. Trade Openness 1.69 1.30
Totalprcom Vs. Trade Openness 1.71 1.31
Note: k=Maximum Eigenvalue/Minimum Eigenvalue.
CI=√k..
4. Regression Results and Implications
Figure A1 is the regression results on the impact of trade openness on primary commodity exports in Nigeria. Unarguably, the findings from the multiple linear regressions for trade openness against nonoil, oil, and total primary commodity exports were satisfactory. Trade openness was negative but insignificant for nonoil primary commodity exports indicating that trade openness has adverse effect on Nigeria’s nonoil primary commodity exports. One unit increase in trade openness decreased 0.35 times in nonoil primary commodity exports. On the contrary, a positive coefficient but insignificant P-value was found for both oil and total primary commodity exports. A unit increase in trade openness resulted in an insignificant increase of approximately 0.02 times in both oil and total primary commodity exports. While controlling for Integration, the outcomes have the expected coefficient signs in line with existing literature from developing countries. Global trade integration was positive but insignificant in explaining variations in the nonoil primary commodity exports. It was also positive but insignificant for oil and total primary commodity export trade. One unit increase in index of integration increased 0.87 times in Nigeria nonoil primary commodity exports. It increased by approximately 1.04 times in both Nigeria’s oil and total primary commodity exports respectively.
The above results have certain implications. First, trade openness can favour developing countries majorly in those commodity exports where they have comparative trade advantage. The above empirical evidence for Nigeria oil cum total commodity exports is informative. The positive results for Nigeria’s oil/total commodity exports imply that the more open the economy is to global trade, the better it is for her oil and total primary commodity trade. The comparative advantage position of oil commodity export in Nigeria is confirmed in recent literature [46-50]. Meanwhile, a similar
positive result for oil exports and total primary commodity exports indicates an overriding influence of oil primary commodity exports in Nigeria’s total exports.
But, the negative result of the nonoil sector also has certain useful implications. It simply sends signal to the need for developing countries to protect other emerging segments of their export market where they do not possess absolute trade advantage. For Nigeria, the nonoil is the emerging sector, but this could differ in other developing economies.
Lastly, the outcome of the control variable is also very informative. The positive results for nonoil, oil, and total primary commodity exports signal the relevance of integration for developing countries. For example, evidence from the above empirical analysis shows that in the longrun, Nigeria integration with the global market could translate into overall development of the aggregate primary export market including oil and the nonoil sectors. However, the insignificant results inform the need for more policy efforts on the side of all stakeholders to further deepen integration. This is necessary considering the fact that the degree of integration of the Nigerian economy as evident in the literature is still very low.
5. Conclusions
export subsectors and worsens economic scenario for their domestic entrepreneurial businesses.
6. Recommendations
In the light of the above foregoing therefore are major recommendations for fast tracking and optimizing the value-added impact of trade openness policy in developing countries: First, developing countries must learn to participate in the global economy on their own terms and pace and not one imposed on them by global markets and multilateral institutions.
Besides, they should not pursue trade openness automatically and rapidly as the final arbiter to trade success. Instead, important factors including timing, quality, sequencing and scope of trade openness must first be considered and handled.
Again, for a viable primary commodity export trade to be fully achieved in developing countries, there is need for them
to open markets majorly on those export products subsector where they have comparative trade advantage over their trading partners. For instance, the adoption of partial openness policy in Nigeria such that will involve the employment of liberal trade in the oil export subsector and trade protection in the nonoil subsector is a welcome idea.
Finally, to meet the subsisting openness challenges and accelerate their integration process with the world economy in a more appropriate way, developing countries must put in place, strong palliative measures to cushion any possible shocks that may arise in the process of implementation. They must develop a strong production base predicated on value added exports; diversify export structures, develop manufactured export capability, develop adequate human and institutional capacity, physical infrastructures, capital and technology necessary for integration.
Appendix
A. Nonoil Primary Commodity Exports Vs. Commodity Export Trade Openness.
B. Oil Primary Commodity Exports Vs. Commodity Export Trade Openness.
C. Total Primary Commodity Exports Vs. Commodity Export Trade Openness.
Figure A1. Regression Results for Export Trade Openness and Primary Commodity Exports in Nigeria.
Source: Regression Analysis using STATA Version 10.0.
_cons 123.2098 164.1934 0.75 0.460 -213.6871 460.1067 integration .8696917 2.236734 0.39 0.700 -3.719707 5.45909 openness -.3463022 2.260801 -0.15 0.879 -4.985083 4.292478 grnoilpx Coef. Std. Err. t P>|t| [95% Conf. Interval]
Total 2682295.84 29 92492.96 Root MSE = 314.18 Adj R-squared = -0.0672 Residual 2665132.74 27 98708.6198 R-squared = 0.0064 Model 17163.1044 2 8581.55218 Prob > F = 0.9170 F( 2, 27) = 0.09 Source SS df MS Number of obs = 30 . regress grnoilpx openness integration
_cons 45.21709 52.41536 0.86 0.396 -62.33035 152.7645 integration 1.044074 .7140314 1.46 0.155 -.4209978 2.509145 openness .0166705 .7217144 0.02 0.982 -1.464165 1.497506 groilxp Coef. Std. Err. t P>|t| [95% Conf. Interval]
Total 293115.061 29 10107.4159 Root MSE = 100.3 Adj R-squared = 0.0048 Residual 271596.912 27 10059.1449 R-squared = 0.0734 Model 21518.1494 2 10759.0747 Prob > F = 0.3572 F( 2, 27) = 1.07 Source SS df MS Number of obs = 30 . regress groilxp openness integration
_cons 45.07633 51.69836 0.87 0.391 -60.99994 151.1526 integration 1.042413 .7042639 1.48 0.150 -.4026169 2.487444 openness .0278319 .7118418 0.04 0.969 -1.432747 1.488411 grtpcx Coef. Std. Err. t P>|t| [95% Conf. Interval]
Note: (1) Regression significant @ 5% level of significance; the larger the value of t, the stronger the evidence that the coefficient is significant. The closer the value of R is to one (1), the stronger the agreement.
References
[1] Bacchetta, M., Marion J., Roberta P. and Alberto A. P. (2007), “Export Diversification as an Absorber of External Shocks”, World Trade Organization, Preliminary Draft Paper. [2] Eleje, E. O. (2015), “Trade Liberalization and Petroleum Price
Adjustments in Developing Nations: What Happens to Nigeria’s GDP?” International Journal of Development Research, IJDR 1001-075.
[3] Yaya, K. (2017), “The Impact of Trade Openness on Economic Growth: The Case of Cote D'ivoire”, Keho, Cogent Economics & Finance, 5: 1-14.
[4] Emrah, I. C. Erdal, A., & Turhan, K. (2019), “Trade Openness and Economic Growth in Turkey: A Rolling Frequency Domain Analysis”, Economies, 7 (41) 1-16.
[5] Rodriguez, F. and Rodrik, D. (2001), “Trade Policy and Economic Growth: A Skeptic’s Guide to the Cross-National Evidence”, NBER Macroeconomics Annual 2000, Cambridge, Mass., MIT Press, Pp. 261-324.
[6] Amegashie, J. A. (2006), “The Economics of Subsidies”, Crossroads 6 (2) 7-15.
[7] Obadan M. I. (2008), “Economic Globalization, Markets and National Development: How Sensibly do the Poor Countries (Nigeria included) Stand?” 98th Inaugural Lecture Series, University of Benin, September 18.
[8] Billmeier, A. and Nannicini, T. (2009), “Trade Openness and Growth: Pursuing Empirical Glasnost”, IMF Staff Paper (56) 447-475.
[9] Ijirshar, V. U. (2019), Impact of Trade Openness on Economic Growth among ECOWAS Countries: 1975-2017”, CBN Journal of Applied Statistics, 10 (1) 75-96.
[10] UNCTAD (1999) United Nations Conference on Trade and Development, Working Paper.
[11] Stein, H (1992), “Deindustrialization, Adjustment, the World Bank and the IMF in Africa”, World Development, (20), 1 January.
[12] Mkandawire, T (1998), “The Road to Crisis, Adjustment and De-industrialization: The African Case”, Africa Development, (XIII) 1.
[13] Mkandawire, T. (2005), “Maladjusted African Economies and Globalization”, Africa Development, Vol. (XXX) 1 & 2. [14] Nwaba, A. (1999), “Trade Liberalisation and Growth: Policy
Options for African Countries in a Global Economy”, African Development Bank Economic Research Paper No. 60. [15] UNCTAD (2004) United Nations Conference on Trade and
Development, Working Paper.
[16] Khor, M. (2000), “Globalization and the South: Some Critical Issues” Penang: Third World Network.
[17] Alwell, N., Mansi, N., & Owede, V. M.(2017) Trade Liberalization and Economic Growth in Nigeria, International
Journal of Social Science and Economics Invention (IJSSEI) 03 (01): 120-132.
[18] Yakubu, M. M., & Akanegbu, B. N. (2018), “Trade Openness and Economic Growth: Evidence from Nigeria”, European Journal of Business, Economics and Accountancy 6 (4): 30-44.
[19] Krueger, A. O. (1978), “Liberalization Attempts and Consequences, Liberalization, Direction of Bias and Economic Growth”, Chapter 12 in Foreign Trade Regimes and Economic Development, Volume (X) 277-300.
[20] Harrison, A. (1996), “Openness and Growth: A Time-Series, Cross-Country Analysis for Developing Countries”, Journal of Development Economics, 48 (2) 419-47.
[21] Yanikkaya, H. (2002), “Trade Openness and Economic Growth: a Cross-Country Empirical Investigation”, Journal of Development Economics 72 (2003) 57–89.
[22] Ejike, D. C., Anah, S. A., & Onwuchekwa, F. C. (2018), Trade Liberalization and Economic Growth in Nigeria: A Cointegration Analysis (1980-2015), IJRDO - Journal of Business Management, 4 (5): 81-94.
[23] Edwards, S., (1993), “Openness, Trade Liberalization, and Growth in Developing Countries” Journal of Economic Literature (31) 1358–1393.
[24] Romer, P. M. (1994) "The Origins of Endogenous Growth" The Journal of Economic Perspectives 8 (1): 3.
[25] Fadare, S. O. (2010), "Recent Banking Sector Reforms and Economic Growth in Nigeria", Middle Eastern Finance and Economics (8); Retrieved 11/10/2011 via; http://www.eurojournals.com/MEFE_8_12.
[26] Arrow, K. (1962), in Romer, P. M. (2011), "Monetary Growth Theory" Retrieved, 11/10/11 via; http://wxww.newschool.edu/nssr/het/essays/growth/moneygro wth.htm.
[27] Hirofumi, U. (1965), in Romer, P. M. (2011) "Monetary Growth Theory" Retrieved 11/10/2011 via http://www.newschool.edu/nssr/het/essays/
growth/moneygrowth.htm.
[28] Miguel Sidrauski (1967), in Romer, P. M. (2011) "Monetary Growth Theory" Retrieved 11/10/2011 via http://www.newschool.edu/nssr/het/essays/growth/moneygro wth.htm.
[29] Levine, R., and Renelt, D. (1992), “A Sensitivity Analysis of Cross-Country Growth Regressions”, American Economic Review, 82 (4) 942–63.
[30] Temple, J., (1999), “The New Growth Evidence”, Journal of Economic Literature XXXVII, 112–156.
[31] Tajudeen E. & Tomola M. O. (2018) Foreign Trade and Economic Growth: A Study of Nigeria and India, Acta Universitatis Danubius, 14 (7): 72-87.
BN1 9SN, UK.
[33] Dollar, D. (1992), “Outward-Oriented Developing Economies Really Do Grow More Rapidly: Evidence from 95 LDCs, 1976-1985”, Economic Development and Cultural Change, Vol. 40 (3) 523-44.
[34] Sachs, J. D. and Warner, A. M. (1995), “Natural Resource Abundance and Economic Growth” NBER Working Paper, No. 5398.
[35] Rodrik, D. (1998), “Why Do More Open Economies have Bigger Governments?” Journal of Political Economy, (106) 997-1032.
[36] Aizenmann, J. and Marion, N. (1999), “Volatility and Investment: Interpreting Evidence from Developing Countries, Econometrica, (66), 157-179.
[37] Razin, A. and Rose, K. A. (1992), “Business-Cycle Volatility and Openness: An Exploratory Cross-Sectional Analysis”, in Leiderman, L. and Razin, A. (eds) “Capital Mobility: The Impact on Consumption, Investment and Growth”, Cambridge, Cambridge University Press.
[38] Easterly, W. and Kraay, A. (2000), “Small States, Small Problems? Income, Growth, and Volatility in Small States”, World Development, 28 (11) 2013-27.
[39] Eleje, E. O. and Okafor, F. O. (2010) “Development of Commodity Derivatives Market in Nigeria: An Empirical Assessment”, African Journal of Contemporary Issues, Vol. 10 No. 1.
[40] Lutz, M. and Singer, H. W. (1994), “The Link between Increased Trade Openness and the Terms of Trade: An Empirical Investigation”, World Development, (22) 1697-1709. [41] Bevan, D., Collier, P. and Gunning J. W. (1990), “Economic
Policy in Countries Prone to Temporary Trade Shocks”, in Scott M. F. G. and Lal D. (eds) Public Policy and Economic Development, Oxford, Clarendon Press.
[42] Okoh, R. N. (2004), “The Global Market Place: How Far can Nigeria go With The Present Non-Oil Product Mix?” African Development and Poverty Reduction: The Macro-Micro Linkage, Forum Paper, 13-15 October.
[43] Onayemi S. O and Akintoye, I. R. (2009), “Diversifying the Productive Base of Nigeria, an Econometric Approach to the Assessment of Non-Oil Export Promotion Strategies”, International Research Journal of Finance and Economics ISSN 1450-2887 Issue 24.
[44] Belsley, D. A., Kuh, E. and Welsh, R. E. (1980), “Regression Diagnostics: Identifying Influential Data and Sources of Collinearity”, New York, John Wiley & Sons.
[45] David, G. K., Lawrence, L. K., and Keith, E. M. (1988), “Applied Regression Analysis and other Multivariate Methods”, 2nd ed., PWS-Kent, Boston, Mass.
[46] Genova, A. and Toyin F. (2003) “Oil in Nigeria: A Bibliographical Reconnaissance” History in Africa, (30) 133-156.
[47] Odularu, G. O. (2009), “Crude Oil and The Nigerian Economic Performance” Oil and Gas Business, 2008 http://www.ogbus.ru/eng/.
[48] Ogunleye, E. K. (2008) “Natural Resource Abundance in Nigeria: from Dependence to Development”. Resources Policy 56.
[49] Nwidobie, B. M. (2011) “An Impact Analysis of Foreign Exchange Rate Volatility on Nigeria’s Export Performance” European Journal of Economics, Finance and Administrative Sciences ISSN 1450-2275 Issue 37.