Abstract
Previous studies have suggested a trait-like association between neighbourhood deprivation and alcohol consumption. However, it is not known whether temporarily manipulating poverty and affluence states by exposure to stimuli signifying scarcity or resource-wealth would influence alcohol-seeking behaviour. Here we aimed to investigate whether implicit exposure to affluence and poverty-related pictures would influence beer
consumption. Participants in a ‘poverty’ group viewed pictures depicting impoverished environments, and participants in an ‘affluence’ group viewed images of wealthy
environments. After priming, participants were provided with non-alcoholic beer (which they were told was alcohol-containing beer) and orange juice under the guise of a bogus taste test, to measure their alcohol-seeking behaviour. Results showed that priming participants with a resource-scarce environment led to an increase in beer consumption (as a percentage of total fluid consumed), compared to priming with a resource-rich environment. The same pattern of results was obtained in both a Western European sample (Experiment 1) and a West Indian sample (Experiment 2). In Experiment 2 we also tested whether risk-taking behavior,
Keywords: Alcohol; environmental priming; poverty; affluence; risk-taking
Introduction
Harmful consumption of alcohol represents one of many negative outcomes associated with poverty. The relationship between poverty and problematic alcohol consumption is a well-established finding in the literature in both Western (Cerdá, Diez-Roux, Tchetgen, Gordon-Larsen & Kiefe, 2010; Fone, Farewell, White, Lyons, & Dunstan, 2013; Khan, Murray, & Barnes, 2002; for review, see Jones & Sumnall, 2016) and non-Western samples (Neufeld, Peters, Rani, Bonu, & Brooner, 2005; Pillai et al., 2013; Silveira et al., 2014). However the proximate psychological mechanisms between poverty and alcohol use are complex and not yet fully understood (Jones & Sumnall, 2016).
Higher levels of perceived disorder in a neighbourhood are associated with increased levels of alcoholism (Martin-Storey et al., 2013), and social causation models of
socioeconomic status and problematic drinking propose that the acute and chronic emotional distress generated by poverty and deprivation increases the likelihood of unhealthy alcohol use. Living in disorderly and impoverished environments is associated with psychological distress due to economic deprivation, increased levels of exposure to threat, and reduced sense of personal control (Piff, Kraus, Côté, Cheng, & Keltner, 2010; Wandersman & Nation, 1998; for review, see Haushofer & Fehr, 2014). These stresses may increase vulnerability to problematic drinking (Mulia, Schmidt, Bond, Jacobs, & Korcha, 2008) as, according to the tension reduction hypothesis, people may consume alcohol to reduce or regulate their response to stress (Conger, 1956). In line with the tension reduction hypothesis, the
chronically stressful environments often cope by engaging in unhealthy behaviours such as drinking alcohol (Jackson, Wright & Rafferty, 2010).
It is also known that living in harsh environments can make individuals more present-oriented, which could potentially be adaptive in terms of survival and reproduction (for review, see Frankenhuis, Panchanathan, & Nettle, 2016). But on the other hand, present-orientation, which can manifest as impulsivity, could lead to adverse health behaviours such as harmful levels of alcohol consumption (de Wit, 2009; Goudriaan, Oosterlaan, De Beurs, & Van Den Brink, 2006). Risk-taking, which is a component of impulsive decision-making (Reynolds, Ortengren, Richards, & de Wit, 2006), has been shown to be higher among those living in poverty (Mata, Josef, & Hertwig, 2016). Further, risk-taking behavior, as measured for example by performance on the Balloon Analogue Risk Task (BART; Lejuez et al., 2002), has been found to predict alcohol consumption in social drinkers (Fernie, Cole, Goudie, & Field, 2010), and is associated with a range of other potentially harmful behaviors such as cigarette smoking, drug use, gambling, theft, and unsafe sexual practices (Hunt, Hopko, Bare, Lejuez, & Robinson, 2005; Lejuez et al., 2003; Lejuez, Aklin, Zvolensky, & Pedulla, 2003; Lejuez et al., 2002). Together, these results suggest that risk-taking may be a potential mechanism to explain the association between poverty and increased levels of alcohol consumption.
Marcinkowska, Moisey, and Harrison, 2016; Roux, Goldsmith, & Bonezzi, 2015). For example, a recent experiment found that priming participants with images of poverty led to delay discounting i.e., participants showed a preference for smaller-sooner over larger-later financial rewards (Liu et al., 2012). To the best of our knowledge, though, there have thus far been no studies testing the effects of poverty-affluence states through exposure to pictures of poverty and affluence (i.e., ‘environmental priming’) on alcohol-seeking behaviour.
A number of different priming manipulations have been utilised in previous studies on alcohol-seeking behaviour; for example it was found that priming participants with a
disinhibited mental set using a stop-signal task led to greater beer consumption compared to priming with an inhibited mental set (Jones, Cole, Goudie, & Field, 2011; Jones, Guerrieri, Fernie, Cole, Goudie, & Field, 2011). Further, priming by negative affect cues (words) was shown to lead to increased beer consumption (Zack, Poulos, Fragopoulos, Woodford, & MacLeod, 2006). In summary, these results show that priming tasks appear well-suited to investigate alcohol-seeking behaviour in the laboratory.
contained alcohol. For these reasons, and based on previous experiments (e.g., Field & Eastwood, 2005; Jones et al., 2011), in the current study we used the volume of beer consumed, calculated as a percentage of total fluid consumed, as a measure of alcohol-seeking behaviour.
Experiment 1
In Experiment 1 we tested whether brief exposure to images of poor and affluent neighbourhoods can influence alcohol-seeking behaviours in adult social drinkers. As
impulsivity has been linked to increased levels of alcohol consumption (or review, see Lejuez et al., 2010), participants completed the BIS-11 to measure self-reported motor, attention and non-planning impulsiveness (Patton, Stanford, & Barratt, 1995) before the manipulation, to rule out between-group differences in impulsivity. After priming, participants completed the Positive and Negative Affect Schedule (PANAS; Watson, Clark, & Tellegen,1988), a measure of positive and negative affect in the present moment, to evaluate if exposure to the pictures influenced the affective state of the participants, followed by a bogus taste test to measure beer consumption.
Method
Participants
either the Poverty or the Affluence group, and group allocation was balanced across gender. In the Affluence group the mean age was 21.2 years (SD = 1.2), and in the Poverty group the mean age was 21.5 years (SD = 1.8). All participants gave written informed consent to the study. The experiment was approved by the Department of Psychology ethics committee at Liverpool Hope University.
Materials and Equipment
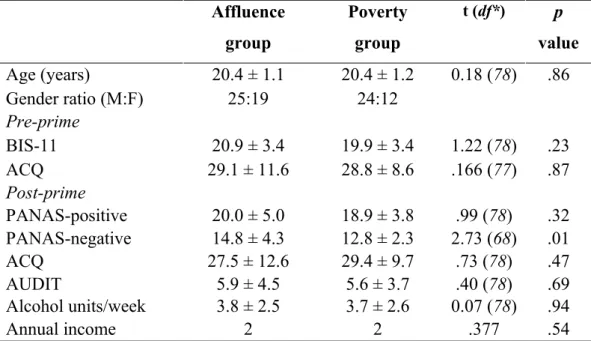
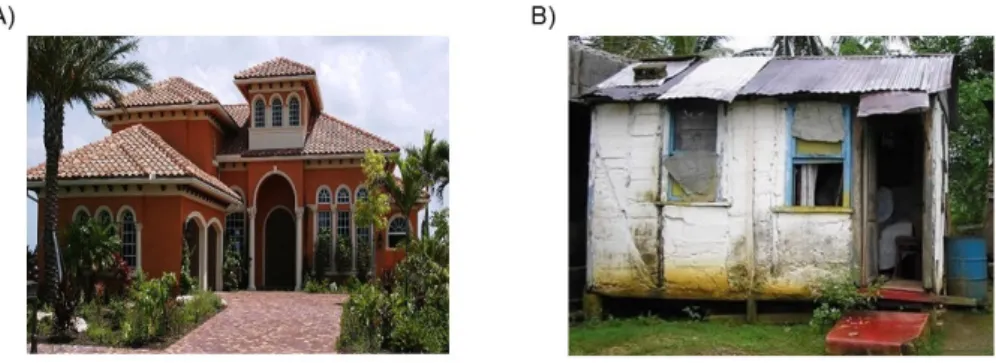
Twenty images depicting poor, and twenty images depicting affluent neighbourhoods were used in Experiment 1 (see Figure 1). The images were selected based on the results of a preliminary picture rating study using a sample of 38 participants (all were aged over 18, but further demographic information was not obtained). None of the participants in the
preliminary study participated in Experiment 1 or Experiment 2. Each participant in the preliminary study rated 56 images on a 7-point Likert scale (1 = not at all deprived, 7 = extremely deprived). The 20 pictures that received the highest ratings were selected as ‘poverty’ pictures (M = 5.92; SD = .50), and the 20 pictures with the lowest ratings were selected as ‘affluent’ pictures (M = 1.82; SD = .38). Because the cover story for the task involved counting the number of buildings in each image, it was important to equate the number of buildings across conditions; there was no difference (p > .6) in number of houses per between conditions (Affluence pictures: M = 3.3 houses, SD = 1.8; Poverty pictures: M = 3.6 houses, SD = 2.5). All pictures were 113 mm (length) x 85 mm (height).
**FIGURE 1 HERE**
BIS-11 consists of 30 questions, rated on a 4-point Likert scale (1 = Rarely/Never, 4 = Almost always/Always). Example items include “I do things without thinking”, and “I buy things on impulse”, and the scale has shown good internal reliability (Stanford et al., 2009). The scale exhibited good reliability in the current sample (α = .84).
The PANAS (Watson, Clark, & Tellegen, 1988) was used to measure participants’ positive and negative affect in the present moment. The questionnaire consists of 20 words that describe feelings/emotions (10 positive, 10 negative), evaluated on a 5-point Likert scale (1 – Very Slightly/Not At All, 5 – Extremely). Higher scores on the positive terms indicates a higher level of positive affect, and higher scores on the negative terms indicates a higher level of negative affect. Reliability analysis revealed good internal consistencies for both the Negative and Positive subscales (Cronbach's alpha coefficients = 0.82 and 0.89, respectively).
The Alcohol Use Disorders Identification Test (AUDIT) (Saunders, Aasland, Babor, de la Fuente, & Grant, 1993) is a screening tool to identify hazardous drinking behaviour. This questionnaire consists of 10 items, each scored on a 5-point scale from 0 to 4. Higher total scores indicate potential harmful drinking. A Timeline Followback questionnaire (Sobell & Sobell, 1992) was used to quantify participants’ self-reported alcohol intake over the 2 weeks prior to the experiment.
Procedure
All testing took place in laboratories within the Psychology department. To reduce demand characteristics that might occur if participants were aware of the true nature of study, the study was advertised as two separate experiments, one about the perception of buildings, and the other about taste perception.
were required to count how many buildings were in each picture. Participants viewed either 20 pictures depicting affluent neighbourhoods, or 20 pictures depicting poor neighbourhoods. Each image was presented in the centre of the screen for 2 seconds, after which participants judged how many buildings were in the picture, using the keyboard numbers 1 to 5 (‘5’ indicated 5 or more buildings). Before the experiment began, participants completed a practice block of 2 trials, using pictures that were not included in the main experiment. The experiment was controlled using E-Prime 2.0.
After the priming task, participants completed the PANAS, followed by the bogus taste test, in which participants were given two drinks in plastic cups. One was filled with 150ml of Becks non-alcoholic beer and the other was filled with 150ml of a supermarket brand of orange juice. This brand of non-alcoholic beer has previously been reported to be indistinguishable in taste from alcohol-containing beer (Jones et al., 2011). At no point did participants view the original packaging of the drinks. Participants were asked to take taste samples (as much or as little as they liked) from the drinks and rate each of them on four separate continuum scales (unpleasant/pleasant, flat/gassy, bitter/sweet, and tasteless/strong tasting). The order in which the drinks were provided (i.e., beer first, or juice first) was counterbalanced. The cups were weighed using electronic scales to measure the amount of fluid that had been consumed. The dependent variable was the volume of beer consumed as a percentage of the total volume of fluid consumed (Field & Eastwood, 2005; Jones et al., 2011).
After completion of the taste test, participants were given the AUDIT scale, followed by the retrospective alcohol diary. Participants were then thanked for taking part and given a thorough debrief.
Table 1 displays descriptive statistics for the participant characteristics and the questionnaires, and the results of independent t-tests to test for between-group differences. There were no significant differences between groups for any of the following variables: age, AUDIT, weekly alcohol units, BIS-11, and PANAS scores.
**TABLE 1 HERE**
Descriptive statistics summarising the total amount of beer and orange juice consumed are displayed in Table 2. Independent t-tests (with adjusted degrees of freedom when equality of variances is not assumed) revealed that there was no difference in orange juice consumption between the Affluence and the Poverty groups (t(36) = 0.33, p = .74). However, the Poverty group consumed a larger total amount of beer compared to the Affluence group (t(22) = 2.18, p = .04). There was no difference in total fluid consumed between the Affluence and the Poverty groups (t(23) = 0.83, p = .42). Importantly,
participants in the Poverty group drank more beer as a percentage of the total fluid consumed (M = 58.9%, SD = 20.8%) than those in the Affluence group (M = 38.5%, SD = 12.7%) (t(30) = 3.65; p = .001).
**TABLE 2 HERE**
findings suggest that even short exposure to pictures of poverty can impact drinking behavior in adult social drinkers. However, a limitation of Experiment 1 was the small sample size, which could potentially produce false-positive results, or over-estimate the magnitude of an effect. Therefore, in order to attempt to replicate the findings from Experiment using a larger sample, and to include additional variables, a second experiment was conducted.
Experiment 2
Experiment 2 aimed primarily to replicate the main findings of Experiment 1 using a larger sample. Secondly, we wanted to investigate the potential effects of priming with pictures of poverty on risk-taking behavior, measured by the Balloon Analogue Risk Task (BART; Lejuez et al., 2002), in addition to effects on beer consumption. Living in poverty is associated with increased risk-taking behavior (Mata, Josef, & Hertwig, 2016), so we
reasoned that exposure to images of deprived neighbourhoods may increase the propensity to take risks. We tested whether risk-taking behavior, measured by the BART, was influenced by priming with images of poverty and affluence.
A further question is whether the environmental primes would influence craving for alcohol, or whether increased beer consumption following priming is produced by
A criticism of much psychological research is that the vast majority of participants are drawn from a demographic that is inconsistent with much of the world’s population. This subset has been defined as WEIRD (Western Educated Industrialized Rich Democratic) (Henrich, Heine & Norenzayan, 2010). It is therefore important to validate our initial results by using a population that in some aspects does not conform to the WEIRD subset, so students from a Caribbean island were recruited for the second study. Finally, we included a measure of participant income to control for differences in economic status between the groups.
Experiment 2 employed the same overall design as Experiment 1, where separate groups of participants viewed pictures of either poor or affluent environments, followed by a bogus taste test to measure beer consumption.
Method Participants
Eighty participants took part in the experiment. All participants were undergraduates of a university on a Southern Caribbean island and were contacted via convenience sampling in public spaces of the campus. No payment or course credit was provided. Participants were randomly allocated to either the Poverty (n = 36) or the Affluence group (n = 44). In the Affluence group, the mean age was 20.42 years (SD = 1.14), and in the Poverty group the mean age was 20.37 years (SD = 1.24). All participants gave written informed consent to the study. The study was approved by the Ethics Committee of the Faculty of Medical Sciences, The University of the West Indies, St. Augustine, Trinidad & Tobago.
Materials and Equipment
pilot study, images were rated for affluence and poverty by a group of 30 undergraduate students at the University of the West Indies, St. Augustine. No further demographic
information about the sample in the pilot study was collected; none of the participants in the pilot study participated in Experiment 2. Ratings were measured using the same 7-point Likert scale as described in the preliminary study for Experiment 1. For images that depicted affluence the mean rating was 1.26 (SD = 0.20) and for those that depicted poverty the mean rating was 5.91 (SD = 0.53). Image size was set at 110mm in length and 75mm in height.
**FIGURE 2 HERE**
In addition to the measures used in Experiment 1 (i.e., BIS-11, PANAS, AUDIT, and average weekly units of alcohol), the following additional measures were used in Experiment 2:
The Alcohol Craving Questionnaire (ACQ) was used to measure present-moment craving for alcohol. This questionnaire consisted of 12 items, and each item was scored on a 7-point Likert scale (1 = strongly disagree; 7 = strongly agree). This questionnaire was a short form version of the 47-item ACQ. Yearly income in Trinidadian dollars was measured on a 6-point scale (from <60,000 TT$, to > 500,000 TT$).
such that persons can ‘bank’ their earnings at any time prior to the balloon bursting. Should the balloon burst, players lose their earning for that round. A total of twenty rounds/balloons were played, and participants kept money earned on the test. Several measures are generated by the BART but the measure used most often is the adjusted average (i.e., the average number of pumps per balloon for the balloons that did not burst) (Lejuezet al., 2002).
Procedure
The procedure was the same as described in Experiment 1, except for the following details. Before the priming experiment, participants completed the BIS-11 and then the ACQ. During the priming task, participants were required to count the number of windows in the picture and answer using the keyboard numbers 1 to 5 (‘5’ indicated 5 or more windows). After the priming task they completed the ACQ, the PANAS, the taste test, the BART test, the AUDIT, followed by the alcohol Timeline Followback, and finally annual income.
Results and discussion
Participant characteristics
Participant characteristics and descriptive statistics for the questionnaires are shown in Table 3. There were no significant differences between groups on any of the following variables: age, AUDIT, weekly alcohol units, BIS-11, PANAS-positive, and yearly income. There was a significant difference between groups for the PANAS-negative scores, which were higher for the Affluence group.
Alcohol Craving Questionnaire (ACQ)
We calculated change in alcohol craving following the priming manipulation by subtracting the ACQ pre-prime total score from the ACQ post-prime score. An independent samples t-test revealed that there was no significant difference between the Poverty and Affluence groups (t(78) = 1.33, p = .187; Affluence group (M = -1.64, SD = 8.27); Poverty group (M = .61, SD = 6.45)).
BART test
An independent samples t-test showed there was no significant difference between the Poverty and Affluence groups on the adjusted average number of pumps per balloon,
indicating no difference in risk-taking between the groups (t(76) = 1.14, p = .26; Affluence group (M = 29.6, SD = 13.7); Poverty group (M = 25.9, SD = 15.1)).
Taste test
Descriptive statistics summarising the measures from the taste test are displayed in Table 4. An independent t-test revealed that there was no difference in beer consumption (t(78) = 0.79, p = .44), no difference in juice consumption (t(74) = 1.84, p = .07), and no difference in total fluid consumed (t(78) = .66, p = .51) between the Affluence and the Poverty groups. Crucially, participants in the Poverty group drank a greater volume of beer as a percentage of the total fluid consumed (M = 50.8%, SD = 17.2%) than those in the Affluence group (M = 38.1%, SD = 18.5%) (t(78) = 3.16, p = .002). Independent t-tests revealed no differences between groups on any of the taste rating scores (all ps > .09).
Association between taste test and BART
average number of pumps per balloon); the regression equation was not significant (F(1,77) = .090, p = .766, R² = .012).
**TABLE 4 HERE**
In summary, Experiment 2 replicated, using a Caribbean sample, the main result from Experiment 1: the group primed by poverty pictures drank more beer than the group primed by affluent pictures. We found no differences in risk-taking behaviour between the Poverty and the Affluence group. The Affluence group reported higher levels of negative affect after viewing the pictures. There were no priming-related differences in alcohol craving.
General discussion
In the current experiments, we investigated the effects of implicit exposure to affluence and poverty-related pictures on subsequent alcohol-seeking behaviour, measured using beer consumption in a bogus taste test. Results from Experiments 1 and 2 showed that priming participants with a resource-scarce environment led to an increase in beer
consumption, as a percentage of total fluid consumed, compared to priming with a resource-rich environment. These novel results were observed in both a Western European sample (Experiment 1) and a West Indian sample (Experiment 2). The current study forms part of a wider body of research investigating how poverty influences the way people feel and behave (for review, see Haushofer & Fehr, 2014). While much research in this area has focused on the relationship between socioeconomic status and psychological processes (see e.g., Sheehy-Skeffington & Rea, 2017), the current studies add to a growing number of experiments showing that brief exposure to environmental cues associated with poverty can influence behavioural choices (Liu et al., 2012; Zhong & DeVoe, 2010).
considered the possible effects of emotional distress, by testing whether exposure to pictures of poverty would lead to increased feelings of negative affect, as measured by the PANAS scale. We found that negative affect scores did not differ between groups in Experiment 1, suggesting that increased consumption of beer in the poverty condition could not be explained by higher levels of negative affect induced by viewing the pictures of resource-scarce environments. This finding was in line with the results of Liu and colleagues (2012), who similarly found no differences in positive or negative affect after participants viewed pictures representing poverty or affluence. Moreover, in Experiment 2 there was a higher level of self-reported negative affect in the Affluence condition compared to the Poverty condition1. Taken together, these findings indicate that the increase in beer consumption was unlikely to have been related to increased levels of negative emotions induced by viewing pictures of poverty.
In Experiment 2 we tested whether priming with resource-scarce or resource-rich pictures influenced risk-taking behavior using the Balloon Analogue Risk Task (BART). Exposure to images of poverty had a detrimental effect on impulsive decision-making using a delay discounting task (Liu et al., 2012), and risk-taking is a closely related aspect of
impulsive decision-making processes (Reynolds et al., 2006). Furthermore, risk-taking, as measured by the BART, has been shown to predict alcohol consumption in social drinkers (Fernie, Cole, Goudie, & Field, 2010). Risk-taking behaviour could be especially adaptive in conditions of resource-scarcity where competition for resources is high, and there is evidence that living in poor conditions is associated with increases in risk-taking behavior (Mata et al., 2016).
delay between the priming task and the administration of the BART; three measures were assessed between the priming task and the BART (ACQ, PANAS, and the taste test), which may have reduced the influence of the priming procedure. Alternatively, the failure to
observe increased risk-taking behaviour following exposure to cues of poverty may be due to distinctions between risk-related cognitive processes and delay discounting. Indeed, several studies have found no correlations between scores on the BART and delay discounting tasks (Reynolds et al., 2006; Xu, Korczykowski, Zhu, & Rao, 2013). One important distinction between the BART and delay discounting tasks is that delay tasks involve inhibition, i.e., deciding to inhibit hedonic pleasure in the moment (even hypothetically, as is often done with monetary delay tasks), whereas the BART (and other risk measures) are essentially approach tasks. Furthermore, delay discounting involves a temporal element (i.e., delay of reward delivery) that is not present in risk-taking tasks. It may be that this temporal element is necessary to explain the effects of poverty cues on impulsivity (e.g., as shown by Liu et al. 2012), as poor environments are associated with fewer resources, placing a premium on the acquisition of immediate rewards in order to retain important resources. Furthermore, while some previous research has shown an association between poverty and increased risk-taking (Mata et al., 2016), other studies have reported an increase in risk-averse behaviors in poor populations (for review, see Haushofer & Fehr, 2014), likely due to decreased willingness to take risks with limited resources. In agreement with the latter findings, in Experiment 2 there was a trend towards lower BART scores for the poverty group compared to the affluence group, although the difference was not statistically significant.
changes in subjective craving. This finding is in accordance with findings from previous studies using the bogus taste test (e.g., Jones et al., 2011), and with theories of addictive behaviour which propose that craving and drug-seeking behaviour can function
independently (Wiers et al., 2007).
While participants in Experiment 1 drank on average 12.2 units of alcohol per week, in close agreement with other studies using similar samples of social drinkers in the UK (e.g., Harrison & McCann, 2014), it should be noted that participants in Experiment 2 had much lower self-reported weekly alcohol intakes. This is not surprising as, although alcohol use is considered problematic in the Caribbean region, the majority of Caribbean islands report lower alcohol use levels compared to global average scores (Shield, Monteiro, Roerecke, Smith, & Rehm, 2015). Taken together, the results from Experiments 1 and 2 show that the poverty priming effect was present in both social drinkers and for participants who drank relatively little alcohol in their daily life. Future studies should explore whether the poverty priming effect is present, or indeed increased, in drinkers with a higher rate of alcohol consumption.
Future studies should investigate whether the increase in beer consumption following exposure to images of impoverished environments is related to the depiction of an
environment, or whether other means of signifying poverty would have the same influence on alcohol-seeking behaviour. For instance, material objects such as electronics or cars can effectively convey either resource-wealth or resource-scarcity, therefore could influence alcohol-seeking behaviour (Nelissen & Meijers, 2011).Besides differences in picture content, future studies could also test the effectiveness of alternative environmental priming
manipulations. For example, vignettes signalling resource-scarcity, such as have been shown previously to influence mate preference choices (Lyons et al., 2016), could be used to
temporarily manipulate affluence or poverty-related cognitions. Alternatively, manipulations designed to induce a feeling of being poor or wealthy, such as by winning or losing a prize (see e.g., Experiment 3 in Liu et al., 2014), could be employed prior to a measure of beer consumption. Future research could usefully investigate whether the poverty priming effect is generalizable to consumption of other types of alcoholic drinks (for example beverages for which a participant has a preference), of other substances (such as nicotine, drugs, or food), or to other potentially maladaptive behaviours such as gambling (e.g., Callan, Shead, & Olson, 2011). Lastly, while the calorific value of beer and orange juice is similar (around 40 calories per 100ml), it could be that participants judged beer as more filling than orange juice, therefore they consumed more beer after exposure to pictures of poverty, as images of poverty suggest hunger. Future studies could include a measure of satiety, to test whether the images influenced perceived fullness after consuming the beverages.
viewed images of affluent environments. The environmental priming manipulation did not appear to influence risk-taking behaviour, or levels of negative affect. The results of the study may have potential implications in relation to how the architecture of urban environments might influence alcohol-seeking behaviour, and could inform debates about the benefits of mixed versus segregated communities in relation to poverty and problematic alcohol use.
References
Callan, M. J., Shead, N. W., & Olson, J. M. (2011). Personal relative deprivation, delay discounting, and gambling. Journal of Personality and Social Psychology, 101, 955-973.
Cerda, M., Diez-Roux, A.V., Tchetgen, E.T., Gordon-Larsen, P., & Kiefe, C. (2010). The relationship between neighborhood poverty and alcohol use: estimation by marginal structural models. Epidemiology, 21, 482–489.
Christiansen, P., Townsend, G., Knibb, G., & Field, M. (2017). Bibi ergo sum: the effects of a placebo and contextual alcohol cues on motivation to drink alcohol.
Psychopharmacology, 1-9.
Conger, J. J. (1956). Alcoholism: Theory, problem and challenge. II. Reinforcement theory and the dynamics of alcoholism. Quarterly Journal of Studies on Alcohol, 17, 296– 305.
de Wit, H. (1996). Priming effects with drugs and other reinforces. Experimental and Clinical Psychopharmacology, 4, 5–10.
Diez-Roux, A.V. (2001). Investigating neighborhood and area effects on health. American Journal of Public Health, 91, 1783–1789.
Fernie, G., Cole, J.C., Goudie, A.J., & Field, M. (2010). Risk-taking but not response inhibition or delay discounting predict alcohol consumption in social drinkers. Drug and Alcohol Dependence, 112, 54–61.
Field, M., & Eastwood, B. (2005). Experimental manipulation of attentional bias increases the motivation to drink alcohol. Psychopharmacology, 183, 350–357.
Fone, D. L., Farewell, D. M., White, J., Lyons, R.A., & Dunstan, F. D. (2013).
Socioeconomic patterning of excess alcohol consumption and binge drinking: a cross-sectional study of multilevel associations with neighbourhood deprivation. BMJ Open, 3(4), e002337.
Frankenhuis, W. E., Panchanathan, K., & Nettle, D. (2016). Cognition in harsh and unpredictable environments. Current Opinion in Psychology, 7, 76-80.
Goudriaan, A. E., Oosterlaan, J., De Beurs, E., & Van Den Brink, W. (2006). Neurocognitive functions in pathological gambling: a comparison with alcohol dependence, Tourette syndrome and normal controls. Addiction, 101(4), 534-547.
Harrison, N. R., & McCann, A. (2014). The effect of colour and size on attentional bias to alcohol-related pictures. Psicológica, 35, 39–48.
Haushofer, J., & Fehr, E. (2014). On the psychology of poverty. Science, 344, 862.
Hill, T. D., & Angel, R. J. (2005). Neighborhood disorder, psychological distress, and heavy drinking. Social Science & Medicine, 61, 965–975.
Hunt, M.K., Hopko, D.R., Bare, R., Lejuez, C.W., & Robinson, E.V. (2005). Construct validity of the Balloon Analog Risk Task (BART): associations with psychopathy and impulsivity. Assessment, 12, 416–428.
Jackson, J. S., Knight, K. M., & Rafferty, J. A. (2010). Race and unhealthy behaviors: chronic stress, the HPA axis, and physical and mental health disparities over the life course. American Journal of Public Health, 100(5), 933-939.
Jones. A., Cole. J., Goudie. A., & Field, M. (2011). Priming a restrained mental set reduces alcohol-seeking independently of mood. Psychopharmacology, 218 (3), 557-565.
Jones. A., Guerrieri. R., Fernie, G., Cole, J., Goudie, A., & Field, M. (2011). The effects of priming restrained versus disinhibited behaviour on alcohol-seeking in social drinkers. Drug and Alcohol Dependence, 113, 55-61.
Jones, L., & Sumnall, H. (2016). Understanding the Relationship between Poverty and Alcohol Misuse. Liverpool: Centre for Public Health, Faculty of Education, Health
and Community, Liverpool John Moores University
Khan, S., Murray, R. P., & Barnes, G. E. (2002). A structural equation model of the effect of poverty and unemployment on alcohol abuse. Addictive Behaviors, 27(3), 405-423.
Lejuez, C.W., Aklin, W.M., Zvolensky, M.J., & Pedulla, C.M. (2003). Evaluation of the Balloon Analogue Risk Task (BART) as a predictor of adolescent real-world risk-taking behaviours. Journal of Adolescence, 26, 475–479.
Lejuez, C.W., Magidson, J.F., Mitchell, S.H., Sinha, R., Stevens, M.C., & de Wit, H. (2010). Behavioral and biological indicators of impulsivity in the development of alcohol use, problems, and disorders. Alcoholism: Clinical and Experimental Research, 34, 1334– 1345.
Lejuez, C.W., Read, J.P., Kahler, C.W., Richards, J.B., Ramsey, S.E., Stuart, G.L., & Brown, R.A. (2002). Evaluation of a behavioral measure of risk taking: the Balloon Analogue Risk Task (BART). Journal of Experimental Psychology: Applied, 8, 75–84.
Liu, L., Feng, T., Suo, T., Lee, K., & Li, H. (2012). Adapting to the Destitute Situations: Poverty Cues Lead to Short-Term Choice. PLoS ONE, 7(4), e33950.
Lyons, M., Marcinkowska, U., Moisey, V., & Harrison, N. (2016). The effects of resource availability and relationship status on women's preference for masculinity: An eye-tracking study. Personality and Individual Differences, 95, 25-28.
Martin‐Storey, A., Ruttle, P. L., Temcheff, C. E., Serbin, L. A., Stack, D. M., Ledingham, J. E., & Schwartzman, A. E. (2013). Longitudinal and concurrent pathways to
alcoholism: The importance of perception of neighborhood disorder. Journal of Community Psychology, 41(2), 156-174.
Mata, R., Josef, A. K., & Hertwig, R. (2016). Propensity for risk taking across the life span and around the globe. Psychological Science, 27, 231-243.
Nelissen, R.M., & Meijers, M.H. (2011). Social benefits of luxury brands as costly signals of wealth and status. Evolution and Human Behavior, 32(5), 343-355.
Nettle, D., Pepper, G.V., Jobling, R., & Schroeder, K.B. (2014). Being there: A brief visit to a neighbourhood induces the social attitudes of that neighbourhood. PeerJ, 2, e236. http://dx.doi.org/10.7717/peerj.236
Neufeld, K.J., Peters, D.H., Rani, M., Bonu, S., & Brooner, R.K. (2005). Regular use of alcohol and tobacco in India and its association with age, gender, and poverty. Drug and Alcohol Dependence, 77(3), 283-291.
Patton, J.H., Stanford, M.S., & Barratt, E.S. (1995). Factor structure of the Barratt impulsiveness scale. Journal of Clinical Psychology 51, 768–774.
Piff, P.K., Kraus, M.W., Côté, S., Cheng, H., & Keltner, D. (2010). Having less, giving more: the influence of social class on prosocial behavior. Journal of Personality and Social Psychology, 99, 771–784.
Pillai, A., Nayak, M.B., Greenfield, T.K., Bond, J.C., Nadkarni, A., & Patel, V. (2013). Patterns of alcohol use, their correlates, and impact in male drinkers: a population-based survey from Goa, India. Social Psychiatry and Psychiatric
Epidemiology, 48(2), 275-282.
Raabe, A., Grüsser, S.M., Wessa, M., Podschus, J., & Flor, H. (2005). The assessment of craving: psychometric properties, factor structure and a revised version of the Alcohol Craving Questionnaire (ACQ). Addiction, 100(2), 227-234.
Reynolds, B., Ortengren, A., Richards, J.B., & de Wit, H. (2006). Dimensions of impulsive behavior: Personality and behavioral measures. Personality and Individual
Roehrich, L., & Goldman, M.S. (1995). Implicit priming of alcohol expectancy memory processes and subsequent drinking behaviour. Experimental and Clinical
Psychopharmacology, 3, 402-410.
Roux, C., Goldsmith, K., & Bonezzi, A. (2015). On the consequences of scarcity: When limited resources promote agentic responses. Journal of Consumer Research, 42, 615-631.
Saunders, J.B., Aasland, O.G., Babor, T.F., de la Fuente, J.R., & Grant, M. (1993). Development of the alcohol use disorders identification test (AUDIT): WHO
collaborative project on early detection of persons with harmful alcohol consumption‐ II. Addiction, 88(6), 791-804.
Sheehy-Skeffington, J., & Rea, J. (2017). How Poverty Affects People’s Decision-Making Processes. York: Joseph Rowntree Foundation.
Shield, K.D., Monteiro, M., Roerecke, M., Smith, B., & Rehm J. (2015). Alcohol
consumption and burden of disease in the Americas in 2012: implications for alcohol policy. Revista Panamericana de Salud Pública, 38(6), 442-449.
Silveira, C.M., Siu, E.R., Anthony, J.C., Saito, L.P., De Andrade, A.G., Kutschenko, A., ... & Andrade, L.H. (2014). Drinking patterns and alcohol use disorders in São Paulo, Brazil: the role of neighborhood social deprivation and socioeconomic status. PloS ONE, 9(10), e108355.
Sobell, L.C., & Sobell, M.B. (1992). Timeline follow-back: a technique for assessing self-reported ethanol consumption. In: Allen, J., Litten, R.Z. (Eds.), Measuring Alcohol Consumption: Psychosocial and Biological Methods (pp. 41–72). Humana Press:
Stanford, M.S., Mathias, C.W., Dougherty, D.M., Lake, S.L., Anderson, N.E., & Patton, J.H. (2009). Fifty years of the Barratt Impulsiveness Scale: an update and review.
Personality and Individual Differences 47, 385–395.
Wandersman, A., & Nation, M. (1998). Urban neighborhoods and mental health: psychological contributions to understanding toxicity, resilience, and interventions. American Psychologist, 53, 647–56.
Watson, D., Clark, L. A., & Tellegen, A. (1988). Development and validation of brief measures of positive and negative affect: the PANAS scales. Journal of Personality and Social Psychology, 54(6), 1063.
White, T.L., Lejuez, C.W., & de Wit, H. (2008). Test-retest characteristics of the Balloon Analogue Risk Task (BART). Experimental and Clinical Psychopharmacology, 16, 565–570.
Wiers, R.W., Bartholow, B.D., van den Wildenberg, E., Thush, C., Engels, R.C.M.E., Sher, K.J., Grenard, J., Ames, S.L., & Stacy, A.W. (2007). Automatic and controlled processes and the development of addictive behaviors in adolescents: a review and a model. Pharmacology Biochemistry and Behavior, 86, 263–283.
Xu, S., Korczykowski, M., Zhu, S., & Rao, H. (2013). Assessment of risk-taking and impulsive behaviors: A comparison between three tasks. Social and Behavioral Personality, 41, 477–486.
Zhong, C.B., & DeVoe, S.E. (2010) You are how you eat: Fast food and impatience. Psychological Science, 21, 619–622.
Tables
Table 1 Experiment 1: Participant characteristics based on questionnaires administered before the poverty priming task (pre-prime) and after the priming task (post-prime). Values are mean ± SD.
Affluence group
Poverty group
t (df*) p value
Age (years) 21.2 ± 1.2 21.5 ± 1.8 0.63 (31) .54
Gender ratio (M:F) 9:10 10:9
Pre-prime
BIS - attention 18.6 ± 3.2 18.3 ± 3.3 0.30 (36) .77
BIS - motor 23.2 ± 3.7 21.7 ± 4.3 1.09 (36) .28
BIS - non-planning 24.7 ± 5.7 26.7 ± 4.7 1.21 (36) .23 Post-prime
PANAS - positive 31.5 ± 7.4 27.1 ± 8.5 1.71 (36) .10 PANAS - negative 14.5 ± 5.2 14.1 ± 5.8 0.21 (36) .84
AUDIT 10.3 ± 3.7 10.5 ± 6.7 0.12 (36) .91
Alcohol units per week 11.3 ± 6.9 12.9 ± 8.7 0.66 (36) .51
Notes: BIS: scores on the three subscales of the Barratt Impulsivity Scales, higher values indicate greater impulsivity; PANAS: scores on the positive and negative subscales of the Positive and Negative Affect
Table 2 Experiment 1: Dependent measures from the bogus taste test, shown separately for participants in the Affluence and Poverty groups. Values are mean ± SD.
Affluence group
Poverty group
t (df*) p value
Beer (ml) 15.5 ± 8.2 29.1 ± 26.0 2.18 (22) .04
Orange juice (ml) 26.3 ± 14.9 23.6 ± 33.1 0.33 (36) .74 Total fluid (ml) 41.8 ± 20.1 52.7 ± 53.7 0.83 (23) .42 Beer consumption (% of
total fluid consumed) 38.5 ± 12.7 58.9 ± 20.8 3.65 (30) .001 Note: * degrees of freedom are adjusted when equality of variances is not assumed
Table 3 Experiment 2: Participant characteristics and descriptive statistics for the
questionnaires, shown separately for participants allocated to Affluence and Poverty groups. Values indicate mean ± SD.
Affluence group
Poverty group
t(df*) p
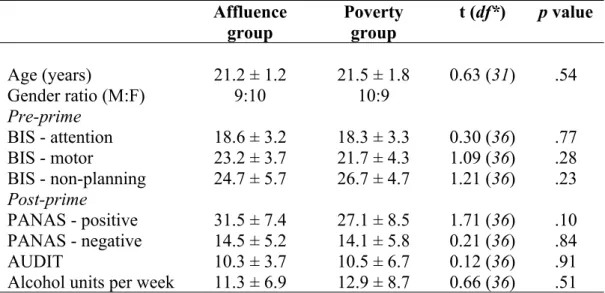
value Age (years) 20.4 ± 1.1 20.4 ± 1.2 0.18 (78) .86
Gender ratio (M:F) 25:19 24:12
Pre-prime
BIS-11 20.9 ± 3.4 19.9 ± 3.4 1.22 (78) .23
ACQ 29.1 ± 11.6 28.8 ± 8.6 .166 (77) .87
Post-prime
PANAS-positive 20.0 ± 5.0 18.9 ± 3.8 .99 (78) .32 PANAS-negative 14.8 ± 4.3 12.8 ± 2.3 2.73 (68) .01
ACQ 27.5 ± 12.6 29.4 ± 9.7 .73 (78) .47
AUDIT 5.9 ± 4.5 5.6 ± 3.7 .40 (78) .69
Alcohol units/week 3.8 ± 2.5 3.7 ± 2.6 0.07 (78) .94
Annual income 2 2 .377 .54
Table 4 Experiment 2: Dependent measures from the bogus taste test, shown separately for participants in the Affluence and Poverty groups. Values are mean ± SD.
Affluence group
Poverty group
t (df*) p value
Beer (ml) 38.5 ± 42.9 45.6 ± 37.2 0.79 (78) .44
Orange juice (ml) 64.5 ± 54.4 46.0 ± 35.1 1.84 (74) .07 Total fluid (ml) 103.0 ± 86.1 91.6 ± 67.8 0.66 (78) .51 Beer consumption (% of
total fluid consumed) 38.1 ± 18.5 50.8 ± 17.2 3.16 (78) .002 Note: * degrees of freedom are adjusted when equality of variances is not assumed
Figures