T h e E ff e c t o f M o d e r a t e D i e t a r y P r o t e i n a n d P h o s p h a t e R e s t r i c t i o n
o n C a l c i u m - P h o s p h a t e Ho m e o s t a s i s i n H e a l t h y O l d e r C a t s
R.F. Geddes, V. Biourge, Y. Chang, H.M. Syme, and J. Elliott
Background: Dietary phosphate and protein restriction decreases plasma PTH and FGF-23 concentrations and improves survival time in azotemic cats, but has not been examined in cats that are not azotemic.
Hypothesis: Feeding a moderately protein- and phosphate-restricted diet decreases PTH and FGF-23 in healthy older cats and thereby slows progression to azotemic CKD.
Animals: A total of 54 healthy, client-owned cats (≥9 years).
Methods: Prospective double-blinded randomized placebo-controlled trial. Cats were assigned to test diet (protein 76 g/Mcal and phosphate 1.6 g/Mcal) or control diet (protein 86 g/Mcal and phosphate 2.6 g/Mcal) and monitored for 18 months. Changes in variables over time and effect of diet were assessed by linear mixed models.
Results: A total of 26 cats ate test diet and 28 cats ate control diet. There was a significant effect of diet on urinary frac-tional excretion of phosphate (P=0.045), plasma PTH (P=0.005), and ionized calcium concentrations (P=0.018), but not plasma phosphate, FGF-23, or creatinine concentrations. Plasma PTH concentrations did not significantly change in cats fed the test diet (P=0.62) but increased over time in cats fed the control diet (P=0.001). There was no significant treatment effect of the test diet on development of azotemic CKD (3 of 26 (12%) test versus 3 of 28 (11%) control, odds ratio 1.09 (95% CI 0.13–8.94),P=0.92).
Conclusions and Clinical Importance: Feeding a moderately protein- and phosphate-restricted diet has effects on calcium-phosphate homeostasis in healthy older cats and is well tolerated. This might have an impact on renal function and could be useful in early chronic kidney disease.
Key words: CKD; Feline; FGF-23; Nutrition; PTH; Renal/Urinary tract.
T
he prevalence of chronic kidney disease (CKD) in
cats is high
1and increases with age,
2making it
likely that a large number of older cats could have
non-azotemic CKD. Thirty-one percent of nonnon-azotemic cats
≥
9 years of age develop azotemic CKD by 12 months.
3Previous studies have looked at biomarkers for early
CKD,
4–8risk factors for CKD
9,10, and predictors of
azotemia development,
3,10but at present, identification
of cats with nonazotemic CKD remains difficult.
In humans, the collection of clinical, biochemical, and
imaging abnormalities ultimately leading to renal
osteodys-trophy is now termed “chronic kidney disease-mineral and
bone disorder” (CKD-MBD).
11Cats have disruption of
calcium-phosphate homeostasis in CKD, with
hyperphos-phatemia, hyperparathyroidism, decreased calcitriol and
ionized calcium,
12and increased FGF-23 concentrations.
13Additionally, cats with late-stage CKD have decreased
bone quality, with an increased number of bone resorption
cavities in their femurs and decreased bone mineral density
compared to healthy cats.
14Taken together, these data
support the use of the term CKD-MBD in cats with CKD.
In humans, CKD-MBD biochemical changes occur early
in CKD to maintain a normal serum phosphate
concentra-tion in the face of declining glomerular filtraconcentra-tion rate
(GFR). Similarly, both parathyroid hormone (PTH) and
fibroblast growth factor 23 (FGF-23) are increased in
healthy older cats that develop CKD within 12 months
compared to cats remaining nonazotemic,
15,16suggesting
that stimulation of phosphaturic hormones occurs to help
From the Department of Clinical Science and Services, Royal Veterinary College, North Mymms, Hatfield, UK (Geddes, Syme); Royal Canin SAS, Aimargues, France (Biourge); and the Department of Comparative Biological Sciences, Royal Veterinary College, Camden, London, UK (Chang, Elliott).
Corresponding author: R.F. Geddes, Department of Clinical Science and Services, Royal Veterinary College, Hawkshead Lane, North Mymms, Hatfield AL9 7TA, UK; e-mail: rgeddes@rvc.ac.uk.
Submitted October 11, 2015; Revised June 25, 2016; Accepted July 18, 2016.
Copyright © 2016 The Authors. Journal of Veterinary Internal Medicine published by Wiley Periodicals, Inc. on behalf of the American College of Veterinary Internal Medicine.
This is an open access article under the terms of the Creative Commons Attribution-NonCommercial License, which permits use, distribution and reproduction in any medium, provided the original work is properly cited and is not used for commercial purposes.
DOI: 10.1111/jvim.14563
Abbreviations:
BCS body condition score BSH British Shorthair CI confidence interval CKD chronic kidney disease DHA docosahexaenoic acid DLH domestic longhair DSH domestic shorthair EPA eicosapentaenoic acid FE fractional excretion FGF-23 fibroblast growth factor 23 FOS fructo-oligo-saccharides GFR glomerular filtration Rate
GLM New Zealand green-lipped mussel extract iCa ionized calcium
LoD limit of detection MCS muscle condition score NFE nitrogen-free extract PTH parathyroid hormone SBP systolic blood pressure
SRHP secondary renal hyperparathyroidism TT4 total thyroxine
maintain phosphate balance in the preazotemic stages of
CKD.
Dietary phosphate restriction is considered the
main-stay of treatment for naturally occurring azotemic CKD
in cats. Commercially available diets containing low
protein (
≤
60.2 g/MCal) and phosphate (
≤
1.0 g/MCal)
reduce plasma PTH concentration and improve survival
time in azotemic cats compared to cats eating
mainte-nance adult diets with approximately 120 g/MCal
pro-tein and 4.8 g/MCal phosphate.
17Additionally, a diet
marketed for cats with CKD containing restricted
pro-tein
(
≤
67.4 g/MCal)
and
phosphate
(
≤
1.2 g/MCal)
reduces the incidence of uremic crises and renal-related
deaths when compared to a maintenance diet containing
protein
>
92.0 g/MCal and phosphate
≥
1.8 g/MCal.
18Plasma FGF-23 concentrations significantly decrease
after 28
–
56 days of feeding a diet containing low
pro-tein
≤
66.5 g/MCal and phosphate
≤
1.1 g/MCal in cats
with stable azotemia.
19However, feeding a protein
(69.7 g/MCal)- and phosphate (1.0 g/MCal)-restricted
diet instead of a protein (129.4 g/MCal) and
high-phosphate (3.4 g/MCal) diet to young adult cats (2
–
3 years of age) over a short time period (4 weeks)
resulted in higher plasma creatinine and phosphate
con-centrations, which was postulated to be because of a
decrease in glomerular filtration rate (GFR).
20The benefit of phosphate and protein restriction in
healthy older cats is unknown. The overall aim
(pri-mary outcome) of this study was to examine whether
feeding a moderately protein (76 g/MCal)- and
phos-phate (1.6 g/MCal)-restricted diet to cats
≥
9 years of
age could prevent progression to azotemic CKD,
com-pared to feeding a maintenance diet with protein 86
g/MCal and phosphate 2.6 g/MCal. More specifically,
to examine whether moderate phosphate restriction
would result in decreased fractional excretion of
phos-phate and reduced plasma PTH and FGF-23
concentra-tions in healthy cats.
Materials and Methods
Animal Selection
Cats were recruited prospectively into this randomized double-blinded controlled trial. The study protocol was approved by the Ethics and Welfare Committees of the Royal Veterinary College
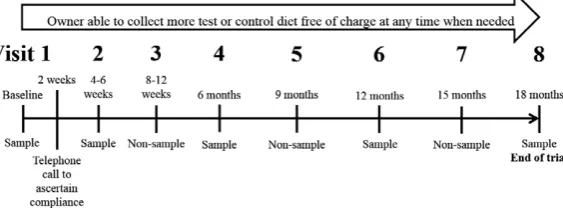
(URN 2011 1113) and Royal Canin. Clients of the Beaumont Sainsbury Animal Hospital were invited to bring apparently healthy cats≥9 years of age to the clinic for free screening, with the incentive of receiving free food for 18 months for eligible cats. All cats seen between October 2011 and January 2013 were screened. Owners were requested to withhold food from their cat for at least 8 hours before appointments. The protocol followed at each visit is outlined in Figure 1.
Cats were considered eligible for the trial if they were healthy on physical examination and had no outward signs of illness reported by their owners, with the exception of signs of osteoarthritis. Auscultation of a heart murmur, documentation of dental calculus gingivitis, and palpation of small kidneys were not exclusion criteria. Cats with plasma creatinine concentration
>2 mg/dL were excluded unless they had a concurrent USG of ≥1.035. If no cystocentesis sample could be collected, the cat was reevaluated 1–2 weeks later and cats with persistent azotemia were excluded, unless a USG ≥1.035 was documented. Cats were excluded if they had long-term medical problems within the last 6 months; a plasma total thyroxine (TT4)>40 nmol/L; recent recur-rent lower urinary tract problems; or were currecur-rently being fed on a diet formulated for urinary tract conditions. Cats diagnosed with systemic hypertension, defined as systolic blood pressure (SBP)
>160 mmHg with concurrent evidence of hypertensive retinopathy or mean SBP>170 mmHg on two occasions without evidence of hypertensive retinopathy, were treated with amlodipine besylatea and reevaluated before enrollment.
Randomization and Blinding
Owners of cats that met the inclusion criteria were invited to take part in the 18-month clinical trial. Consent was obtained from all owners. Cats were entered onto a randomization list by the same veterinary nurse for all cases, in strict chronologic order. The only exception was that eligible cats from the same household were assigned to the same diet (in total 4 households, each with 2 cats).
The food manufacturer assigned code names to the diets and labeled plain white bags with the code, a feeding guide, and an expiry date. The code was unblinded only after all analyses had been completed.
Test and Control Diets Used
The test diet used was a commercially available dry diet formu-lated for cats, marketed as a “senior” diet.bTo manufacture the
control diet, any ingredients not normally present in an adult maintenance diet for cats were removed from the test diet, and protein and phosphate concentrations were adjusted to be similar
to commercial adult maintenance diets. Both diets were formulated with the same ingredients with the exception of a few additional ingredients in the test diet; the nutritional composition and ingre-dients for each diet are shown in Table 1. The cholecalciferol (1000 IU/kg) and iodine (5 ppm) contents of both diets were the same, and both were formulated to induce a urine pH of 6–6.5 to reduce the incidence of struvite urolithiasis. Both diets provided all nutrients in excess of the National Research Council-recommended nutrient requirements for cats.21The test diet was lower in protein, higher in omega (x)-3 polyunsaturated fatty acids (PUFA), and lower in calcium and phosphate when compared to the control diet. Owners were given guidance on weight of the dry trial diet to feed per day based on bodyweight. The amount was tailored to help achieve weight loss in cats with a body condition score>6 of 9. Owners were encouraged not to feed any other food. Owners insistent on feeding a wet food were requested to feed a maximum of 50 g per day, to avoid all fish-flavored foods and to avoid other “senior” diets. To maximize compliance, owners were asked to only rarely provide other foods (e.g., chicken, dairy) and treats. Owners were requested to keep a daily diary of all foods given to their cat during the trial period. Owners were encouraged to ensure that at least 66% of their cat’s daily food intake (by vol-ume) was the assigned diet. Because dry food has approximately 4 times more calories per gram than wet food, this was to ensure that the majority of the calorific intake of the cat (≥approximately 80%) would come from the study diets. In a previous study, feed-ing a protein (60.3 g/Mcal)- and phosphate (1.0 g/Mcal)-restricted diet as at least two-third of the daily energy requirements was suf-ficient to see a significant effect on plasma phosphate concentra-tion in cats with azotemic CKD.17,22
Study Follow-Up
The schedule of clinic visits for this 18-month trial is shown in Figure 1. At each visit, owners were questioned about dietary compliance and perceived palatability. The cats had their systolic blood pressure measured by Doppler, as previously described, and had a physical examination including measurement of bodyweight. Body condition score (BCS) was determined from 1 to 9 and mus-cle condition score (MCS) scored as normal (4), mild (3), moder-ate (2), or severe (1) muscle loss by the MCS system proposed by WSAVA.c
The following data were obtained at visits 1, 2, 4, 6, and 8. Blood samples were obtained by jugular venepuncture and urine samples collected by cystocentesis. Ionized calcium (iCa) was mea-sured on whole blood immediately after sampling with a portable analyzer.dHeparinized plasma was submitted to an external
labo-ratory for biochemical analysis (and TT4 analysis on visits 1 and 6).eUrinalysis and sediment examination were performed in house.
Residual heparinized plasma, EDTA plasma, and urine were stored at80°C. Batch analysis was performed at the external lab-oratory for urine protein-to-creatinine ratio (UPC) and urine phosphate. Batch analysis was performed in house to measure plasma FGF-23f and PTHg concentrations, as previously
described.13These data were also obtained at other time points if
a cat became unwell during the study.
Development of azotemic CKD, death/euthanasia, and reach-ing visit 8 on the allocated intervention were considered trial end points. Renal azotemia was defined as a plasma creatinine concentration >2 mg/dL with concurrent urine specific gravity (USG) <1.035, or persistent azotemia on two consecutive occa-sions at least 2 weeks apart without evidence of a prerenal cause. Owners were instructed to follow the trial protocol until confirmation of azotemia in cases where no urine sample was obtained. If USG was documented to be >1.035, the study pro-tocol was continued regardless of the plasma creatinine concen-tration. The trial was terminated if a cat refused to eat the trial
diet; an owner repeatedly failed to attend appointments; a cat developed a significant medical condition requiring additional treatment; or adverse effects were observed that required cessa-tion of the diet. All reasons for trial terminacessa-tion were recorded. Cases where no data were obtained while on the assigned inter-vention were excluded from analyses. Data for all other cases
Table 1.
Ingredients for the test and control diets and
mean dietary composition from three batches of each
diet, as provided by the manufacturer. Nutrients
expressed per Mcal of metabolizable energy with energy
calculated by the National Research Council 2006
equa-tion. Underlined ingredients were only present in the
test diet and not in the control diet. Nutrients
high-lighted in bold illustrate the main differences between
the two diets.
Nutrient
Test Diet MeanSD
Control Diet MeanSD
Energy (Kcal/Kg) 382229 373615
Water (g/Mcal) 13.91.59 15.32.34
Protein (g/Mcal) 76.01.13 85.52.16
Fat (g/Mcal) 37.21.13 36.71.25
Fatty Acidsx3 (g/Mcal) 2.340.61 0.950.15 Fatty Acidsx6 (g/Mcal) 9.490.85 10.11.29 Fatty Acidsx6/x3 4.180.74 10.71.18 C18:2 Linoleic Acidx6
(g/Mcal)
9.090.81 9.841.24
C18:3 Gamma-linoleic Acidx6 (g/Mcal)
0.090.02 0.040.00
C20:4 Arachidonic Acidx6 (g/Mcal)
0.140.02 0.150.04
C20:5 EPA (g/Mcal) 0.880.33 0.030.01 C22:6 DHA (g/Mcal) 0.460.07 0.030.01
NFE (g/Mcal) 1062.44 97.92.70
Starch (g/Mcal) 90.52.59 80.71.03
Cellulose (g/Mcal) 13.21.32 14.40.69 Total dietary fibre (g/Mcal) 28.91.22 31.61.74
Minerals (g/Mcal) 15.30.87 17.90.37
Calcium (g/Mcal) 1.930.18 2.870.19
Phosphate (g/Mcal) 1.590.05 2.610.15
Sodium (g/Mcal) 1.270.08 1.200.09
Potassium (g/Mcal) 2.090.13 2.100.12
Chloride (g/Mcal) 2.310.08 1.730.18
Ingredients Maize, wheat gluten, maize flour, dehydrated poultry protein, wheat, maize gluten, animal fats, rice, vegetable fibres, hydrolyzed animal proteins, chicory pulp, fish oil, soya oil, minerals, tomato (source of lycopene), psyllium husks and seeds, FOS, GLM 0.3%, hydrolyzed yeast (source of mannan-oligo-saccharides), hydrolyzed crustaceans (source of glucosamine), borage oil, marigold extract (source of lutein), hydrolyzed cartilage (source of chondroitin)
were included until the study end point or termination of the trial.
Statistical Analysis
Assuming 33% of cats on the control diet would develop azote-mic CKD during the study period, and that <5% cats would develop azotemia on the test diet, with a 5% type I error rate and power of 80%, a sample size calculation suggested 30 cats would be required in each group. Statistical analyses were performed by SPSS.hStatistical significance was determined asP<.05.
Normal-ity of variables was assessed by visual inspection of histograms. Results are reported as meanSD for normally distributed vari-ables or as median [25th, 75th percentiles] for data not normally distributed. Variables at baseline were compared between groups by independentt-tests or Mann-Whitney U-tests, as appropriate. Proportions were compared between groups by a Fisher’s exact test. Treatment effect reported as an odds ratio with 95% confi-dence intervals (CI).
Fractional excretion of phosphate was calculated by the follow-ing formula:
Linear mixed-effects models were constructed to compare the change in continuous variables across all visits and study the effect of diet on the changes identified. Variables with highly skewed dis-tributions were logarithmically transformed. Data from all visits, including additional recheck visits, if performed, were included. Case number was treated as a random factor; all other variables were fixed factors. Time was treated as a continuous covariate with the unit expressed as month (28 days). Quadratic terms for time (time2) were included in initial models to account for
poten-tial nonlinear changes of variables over time and subsequently removed if not significant. Contrast analysis was performed post-hocto examine differences between the two diet groups at specific time intervals in variables with a significant diet*time interaction.
Generalized estimating equations by ordinal logistic link func-tion were constructed to compare the change in categorical vari-ables across all visits and the effect of diet. An exchangeable correlation structure was used to account for correlation among repeated measures from the same cat. Fixed factors and covariates were included as described above.
Results
One hundred and forty-five cats were assessed for
eligi-bility for the trial with a median age of 12.8 [11.2, 13.8]
(range 9.0
–
21.0) years. Case enrollment, diet allocation,
and follow-up are summarized in a flow diagram as per
the CONSORT 2010 statement
23(Fig 2). Additional
information not included in Figure 2 is outlined below.
Reasons
for
not
meeting
the
inclusion
criteria
included a diagnosis of azotemic CKD (n
=
21),
border-line CKD diagnosis with conflicting results on
follow-up (n
=
6), TT4
>
40 nmol/L (n
=
16), recurrent lower
urinary tract problems/eating a urinary diet (n
=
4),
eat-ing a prescription diet
i(n
=
1), taking long-term
medi-cation for suspected cardiovascular disease (n
=
2), a
diagnosis of diabetes mellitus (n
=
2), and chronic eye
problems (n
=
1).
Medical problems diagnosed during the trial, which
necessitated trial termination, were congestive heart
fail-ure (n
=
1) for a cat on the test diet and severe weight
loss (n
=
1), hepatitis (n
=
1), and diabetes mellitus
(n
=
1) for cats on the control diet.
Medications administered during the trial to cats
assigned to the test diet included short-term antibiotics
for a cat bite abscess (n
=
1), amlodipine besylate
(n
=
1), long-term NSAIDs for osteoarthritis (n
=
5),
and short-term NSAIDs (n
=
3). Additionally, one cat
received medications for pancarpal arthrodesis surgery
for a short period of time, which occurred between
vis-its 4 and 6. Medications administered during the trial to
cats assigned to the control diet included amlodipine
besylate (n
=
1), clomipramine hydrochloride to manage
urine spraying (n
=
1), antibiotics for a urinary tract
infection
(n
=
1),
and
long-term
NSAIDs
for
osteoarthritis (n
=
1). Additionally, methimazole
jwas
administered to one cat that was diagnosed with
hyper-thyroidism (TT4 64.1 nmol/L) at visit 6 and was
promptly and successfully treated medically, becoming
euthyroid (TT4 30.1 nmol/L) within 2 months and
remaining euthyroid at visits 7 and 8. There was no
sig-nificant difference between the proportion of cats
requiring long-term NSAIDs between groups (test
group 19% and control group 4%;
P
=
0.067).
Twenty-six cats that received test diet and 28 cats
that received control diet were included in analyses
(Fig 2). Baseline variables were similar between groups,
although UPC measurements were significantly higher
in cats assigned to receive control diet (see Table 2).
Effect of Diet Over Time
The median [range] timings for visits 2
–
8 were visit 2:
35 days [28
–
56], visit 3: 105 days [70
–
140], visit 4:
189 days [140
–
233], visit 5: 287 days [245
–
322], visit 6:
368 days [315
–
413], visit 7: 462 days [420
–
497], and visit
8: 553 days [474
–
595]. On six occasions, additional
vis-its occurred during the study period for the following
reasons: to confirm the presence of azotemic CKD (4
visits) or to assess control of hyperthyroidism (2 visits).
On 24 occasions, cats were not presented to the clinic,
of which 23 of 24 were nonsample visits; whenever
pos-sible, compliance with the assigned diet was checked by
telephone in this circumstance.
The proportion of cats lost from the trial because of
poor compliance was not significantly different between
groups (9 of 37 test vs. 3 of 32 control,
P
=
0.10). For
the 54 cats included in the analyses, the amount of diet
eaten was recorded as
<
66% on 11 of 284 occasions,
but was always
≥
50%. There was no difference in
per-centage of diet eaten between the groups (
P
=
0.74) or
change in the percentage of diet eaten over time
FE phosphate
¼
urinary concentration of phosphate
plasma creatinine concentration
(
P
=
0.69). There was no difference between the
propor-tion of cats in each group that died or were euthanized
(2 of 26 test vs. 2 of 28 control,
P
=
0.34) during the
study (see Fig 2). Assessment of the primary outcome
found no difference in the number or proportion of cats
that developed azotemic CKD in each group (3 of 26
(12%) test vs. 3 of 28 (11%) control, odds ratio 1.09
(95% CI 0.13
–
8.94),
P
=
0.92).
The majority of cats in this study ate some wet food
in addition to the study diet provided: 17 of 26 cats
assigned to the test diet and 18 of 28 cats assigned to
the control diet. In all cases, the wet foods offered were
not marketed as a “senior” diet. A variety of brands
were offered, with Whiskas
Òbeing the most commonly
fed brand. The majority of cats were also offered some
“human” foods, but in all cases, the foods offered were
small amounts, offered occasionally, and no cat received
these foods as a substantial part of their diet. The most
common foods offered were chicken (28 cats) and dairy
(milk, cream, yoghurt, or cheese) (17 cats). Additional
dry foods were offered to a small number of cats: 6 of
26 cats on the test diet and 2 of 28 on the control diet.
However, only 2 cats (one on each diet) received more
than a few kibbles of alternative dry food per day.
A summary of variables examined over time and the
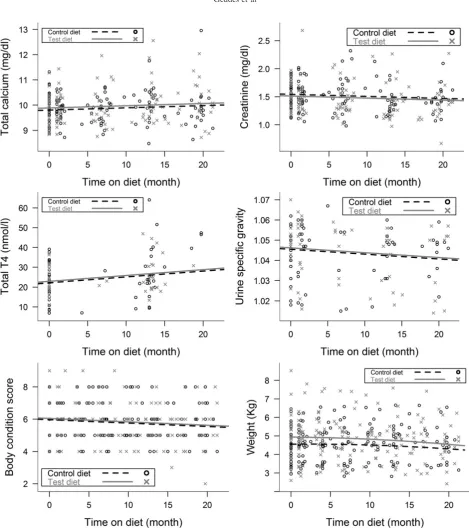
effects of diet are shown in Table 3a and b. Variables that
did not change over time and no effect of diet was seen:
plasma phosphate, logFGF-23 (Fig 3) and potassium
concentrations, SBP, or logUPC. Although UPC
concen-trations were higher in the control diet group at baseline,
there was no difference between the groups at any other
time points (
P
>
0.57). Total calcium (
P
=
0.032) and
TT4 concentrations (
P
=
0.007) increased, while BCS
(
P
<
0.001), bodyweight (
P
<
0.001), MCS (
P
<
0.001),
USG (
P
=
0.047), and plasma creatinine (
P
=
0.030)
decreased over time for all cats, independent of diet fed
(Fig 3).
FE phosphate changed significantly over time for
both groups (
P
=
0.040); in both cases, the change was
nonlinear and the two diets had different effects (see
Fig 4).
Posthoc
comparisons indicated that FE
phos-phate was significantly higher in cats eating control diet
by 15 months (
P
=
0.045) and for the remainder of the
study period (all
P
<
0.05).
Lost to follow-up (n=1) Owner not contactable
Discontinued intervention (n=12) Poor compliance at 2 weeks (n=9) Owner decision (n=1)
Significant medical problem (n=1) Became aggressive (n=1)
Reached a primary end-point (n=24) Azotemic CKD (n=3) Death/euthanasia (n=2) Euthanasia before visit 2 (n=1) Reached visit 8 following the protocol (n=18)
Lost to follow-up (n=0)
Discontinued intervention (n=11) Poor compliance at 2 weeks (n=3) Owner decision at 2 weeks (n=1) Owner decision at a later visit (n=4) Significant medical problem (n=3)
Reached a primary end-point (n=21) Azotemic CKD (n=3) Death/euthanasia (n=2)
Reached visit 8 following the protocol (n=16)
Analysed (n=26)
• Excluded from analysis (n=11) (underlined) No follow-up on intervention (n=10)
Analysed (n=28)
• Excluded from analysis (n=7) (underlined) Didn’t receive the intervention (n=3) No follow-up on intervention (n=4) Analysis
Follow-Up Allocated to test diet (n=37)
•Received allocated intervention (n=37)
•Did not receive allocated intervention (n=0)
Allocated to control diet (n=35)
• Received allocated intervention (n=32)
•Did not receive allocated intervention (n=3) Allocation
Enrolment Assessed for eligibility (n=145)
Excluded (n=73)
•Not meeting inclusion criteria (n=53)
•Declined to participate (n=17)
•Too aggressive to sample (n=3)
Randomized (n=72)
Ionized calcium concentrations increased over time
for both groups (
P
=
0.022). Although the magnitude
of the increase was greater for the test diet group, the
size of the effect was small and
posthoc
comparisons
found no significant difference between the groups at
any individual time points (Fig 4). Ionized
hypercal-cemia (
>
1.4 mmol/L) was present in two cases at visit 1;
one assigned to each diet and was persistent for the cat
on test diet but normalized for the remainder of the
trial for the cat on control diet. A further 6 cats
devel-oped ionized hypercalcemia during the study period.
One cat assigned to control diet developed ionized
hypercalcemia from visit 4 onwards, with total
hyper-calcemia from visit 6 onwards. Five cats eating test diet
developed ionized hypercalcemia, including 3 cases at
visit 8 (total calcium normal), 1 cat from visit 4
onwards (total calcium always normal), and the cat that
had a pancarpal arthrodesis was transiently
hypercal-cemic for both ionized and total calcium following
sur-gery. Plasma PTH concentrations were below the limit
of detection (LoD) of the assay for all cats at visits
where ionized hypercalcaemia was demonstrated, with
the exception of one cat diagnosed with azotemic CKD
at visit 8 (plasma PTH concentration 14.0 pg/mL).
Plasma FGF-23 concentrations were increased
through-out the study period for the cat that was persistently
hypercalcemic from baseline. Plasma FGF-23
concen-trations increased to above reference interval in two
cats (one on each diet) that demonstrated persistent
ion-ized hypercalcemia from visit 4 onwards. The
propor-tion of cats that developed ionized hypercalcemia while
eating test diet was higher than for cats eating control
diet, but this failed to reach statistical significance (5 of
26 test vs. 1 of 28 control,
P
=
0.067).
Of the 240 PTH measurements obtained, 100 (41.6%)
were below the LoD of the assay. PTH was therefore
analyzed as a categorical variable based on a previously
derived reference interval (RI)
19by four categories: (1)
below the assay LoD (
<
5.2 pg/mL), (2) RI lower half
(5.2
–
8.8 pg/mL), (3) RI upper half (8.9
–
17.6 pg/mL),
and (4) above the RI (
>
17.6 pg/mL), to allow inclusion
of all measurements. There was a significant difference
in plasma PTH concentrations between the two diets
during the study period (
P
=
0.005); feeding test diet
was associated with no change in PTH over time [odds
ratio (OR) 0.99, 95% confidence interval (CI) 0.96
–
1.03, (
P
=
0.62)], and feeding control diet was
associ-ated with a 7% increase in the odds of progressing to a
higher PTH category per month of the study period
[OR 1.07, 95% CI 1.03
–
1.12, (
P
=
0.001)] (Fig 5).
Discussion
In the present study, feeding the moderately
protein-and phosphate-restricted test diet to healthy older cats
was associated with lower FE phosphate and more
stable
PTH
concentrations
but
a
slightly
greater
increase in ionized calcium when compared to the
con-trol diet. There was no difference in the proportion of
cats developing azotemic CKD between groups. Some
cats from both groups were lost before visit 2 because
of poor compliance; however, compliance for all
remaining cats was excellent for the entire 18 month
study.
The groups were well matched at baseline; however,
UPC was higher in the cats assigned to the control diet
group. We consider this likely to be a type I error, as
there was no difference in UPC between groups at any
Table 2.
Comparison of variables at visit 1 (baseline) for cats assigned to each diet. The only significant
P
value
(
P
<
.05) is highlighted in bold.
Test diet (n=26) Control diet (n=28)
Pvalue MeanSD or Median
[25th, 75th percentiles] n
MeanSD or Median
[25th, 75th percentiles] n
Age (years) 12.2 [11.2, 13.5] 26 12.1 [11.1, 13.9] 28 0.92
Creatinine (mg/dl) 1.50.2 26 1.60.2 28 0.73
Urea (mg/dl) 28.35.6 26 27.24.5 28 0.41
Ionized calcium (mg/dl) 1.270.08 20 1.30.06 24 0.24
Total calcium (mg/dl) 9.760.60 26 9.880.60 28 0.48
Phosphate (mg/dl) 3.881.21 26 3.500.50 28 0.14
PTH (pg/ml) 7.7 [2.6, 10.1] 25 6 [2.6, 11.4] 28 0.36
FGF-23 (pg/ml) 153.4 [105.1, 208.6] 25 124.3 [99.2, 209.9] 28 0.31
SBP (mmHg) 13225 26 13322 28 0.88
Weight (Kg) 4.961.29 26 4.540.93 28 0.17
BCS (1 to 9) 61.4 26 61.41 28 0.34
UPC 0.13 [0.11, 0.17] 13 0.20 [0.15, 0.24] 15 0.045
USG 1.0480.01 13 1.0420.014 15 0.23
TT4 (nmol/l) 22.87.9 26 22.68.9 28 0.91
Sex 18 MN, 8 FN 12 MN, 16 FN
Breeds 23 DSH, 3 DLH 21 DSH, 5 DLH,
1 BSH, 1 Chinchilla X
Table 3.
(a and b): Linear mixed model analysis of changes in variables during the study period showing (a)
sum-mary of
P
values for terms included in the models and (b) summary of intercepts and slopes (n
=
54).
Variable Diet Time Diet*Time Time2
(a)
Weight (Kg) 0.20 0.98 0.067 0.011
Ionised calcium (mmol/L) 0.48 0.59 0.018 0.022
FE phosphate (%) 0.61 0.021 0.045 0.040
BCS (1 to 9) 0.80 <0.001 NS NS
MCS 0.52 <0.001 NS NS
Total T4 (nmol/L) 0.75 0.007 NS NS
Creatinine (mg/dL) 0.66 0.030 NS NS
Total calcium (mg/dL) 0.58 0.032 NS NS
USG 0.84 0.047 NS NS
logUPC 0.39 0.090 NS NS
SBP (mmHg) 0.39 0.29 NS NS
logFGF23 (pg/ml) 0.11 0.32 NS NS
Potassium (mEq/L) 0.95 0.76 NS NS
Urea (mg/dL) 0.92 0.84 NS NS
% study diet eaten 0.82 0.84 NS NS
Phosphate (mg/dL) 0.35 0.89 NS NS
Variable
Test Diet Control Diet
Intercept Slope of Time Slope of Time2 Intercept Slope of Time Slope of Time2
(b)
Weight (Kg) 4.940.21 (0.003)0.006 (0.008)0.003 4.560.20 0.0040.006 (0.008)0.003 Ionised
calcium (mmol/L)
1.280.013 0.00020.002 0.00028.02E-05 1.300.013 (0.002)0.002 0.00028.02E05
FE
phosphate (%)
40.52.8 (1.83)0.64 0.0660.032 38.62.7 (1.15)0.65 0.0660.032
BCS (1 to 9) 6.050.22 (0.021)0.006 NA 5.970.21 (0.021)0.006 NA
MCS (1 to 4) 3.690.075 (0.016)0.004 NA 3.630.073 (0.016)0.004 NA
Total T4 (nmol/L)
22.91.8 0.300.11 NA 22.11.8 0.300.11 NA
Creatinine (mg/dL)
1.510.05 (0.004)0.002 NA 1.540.05 (0.004)0.002 NA
Total calcium (mg/dL)
9.890.11 0.0090.004 NA 9.810.11 0.0090.004 NA
USG 1.0460.003 (0.0002)0.0001 NA 130450.003 (0.0002) 0.0001 NA
logUPC (0.82)0.04 0.0020.001 NA (0.78)0.03 0.0020.001 NA
SBP (mmHg) 130.52.8 (0.12)0.11 NA 133.82.8 (0.12)0.11 NA
logFGF23 (pg/mL)
2.200.05 (0.001)0.001 NA 2.090.05 (0.001) 0.001 NA
Potassium (mEq/L)
3.990.05 0.00070.0023 NA 3.990.049 0.00070.0023 NA
Urea (mg/dL)
27.51.02 (0.007)0.04 NA 27.40.99 (0.007)0.04 NA
% study diet eaten
84.92.6 (0.014)0.069 NA 84.12.5 (0.014)0.069 NA
Phosphate (mg/dL)
3.730.09 0.00070.005 NA 3.610.09 0.00070.005 NA
Outcome variables showing significant change over time and between groups (P<.05) are highlighted in bold. The unit used for time was month (28 days). Diet represents cats assigned to test or control diet.
The term diet*time2was not significant in any models and is therefore not included in the table. A significant effect of time2indicates a significant nonlinear change in both groups during the study period. If time2 was not significant (NS), this term was removed from the model.
A significant interaction in diet*time indicates the rate of change of the outcome variable differed between diets and therefore indicates a difference between feeding test or control diet. If diet*time was not significant, it suggests that any change in the outcome variable occurred in all cats independent of which diet they were assigned to and the term was therefore removed from the model.
For models where diet*time was NS, a significant change in time indicates the outcome variable significantly increased or decreased dur-ing the study period and that the change seen was linear.
other time point and no effect of diet on UPC over
time.
FE phosphate was significantly lower in cats eating
the test diet compared to those eating the control diet.
This was expected, because maintaining stable total
body phosphate should require a decrease in phosphate
excretion if phosphate intake is reduced (and GFR does
not change). Exact phosphate intake during the study
could not be determined in these cats because reported
dietary intake by owners could not be verified. This is a
potential limitation; however, the results more
accu-rately reflect the situation in the clinic than results from
studies that use laboratory cats. Interestingly, FE
phos-phate was not significantly different between the groups
until the 15-month time point and at the beginning of
the study period it decreased in all cats. This suggests
that dietary phosphate load was higher or more
bioavailable in the varied baseline diets than both the
test and control diets. This may be because of the
feed-ing of more high-protein “treats” such as meat, fish,
and dairy products before the study. On enrollment,
owners were requested not to feed fish and to minimize
treats, particularly in overweight cats. Ideally all cats
would have had a wash-in period before the start of the
study in which they all received the same diet. This was
not performed as it would have required additional
sampling in these healthy cats and might have reduced
compliance with the study protocol in these
client-owned animals. However, given the long timecourse of
this study, it need not be considered a substantial study
limitation.
Plasma
phosphate
and
FGF-23
concentrations
remained stable for all cats during the study. It is
possi-ble that no difference was seen between the groups
because there was not enough difference in phosphate
content between the two diets. Alternatively, it could be
expected that plasma phosphate concentrations would
not change in these healthy cats, because plasma
phos-phate concentration does not change when feeding a
more markedly phosphate-restricted diet (
<
1.1 g/Mcal)
to CKD cats that are normophosphatemic for their
IRIS stage.
19However, plasma FGF-23 concentrations
do decrease significantly in all CKD cats fed a diet with
<
1.1 g/Mcal phosphate.
19Additionally, short-term
diet-ary phosphate restriction (maximum study duration
4 weeks) in healthy people decreases FGF-23
concentra-tions.
24–27Therefore, plasma FGF-23 concentrations
were expected to decrease in cats fed the test diet in the
present study. As plasma phosphate concentrations
were stable for all cats, the lack of change in FGF-23
might be an appropriate physiologic response, but FE
of phosphate decreased on both diets. Additionally,
Fig 4. Scatter plots of whole blood ionized calcium concentration and FE phosphate for cats eating the test and control diets during the study period. All changes over time were nonlinear. Ionized calcium increased significantly over time (P=0.022), and there was a difference between cats eating test diet and cats eating con-trol diet over time (P=0.018). However, post hoc comparisons revealed no significant difference between the cats on the different diets at any individual time points during the study period. FE phosphate initially decreased and subsequently increased during the study period (P=0.040), and there was a difference between cats eating test diet and cats eating control diet over time (P=0.045). Post hoc comparisons found that FE phosphate was significantly lower in cats eating test diet at the 15 month time point (P=0.045) and for the remainder of the study period.
there was no decrease in PTH concentrations in either
group. This raises the question of what was responsible
for the change in phosphate excretion if not FGF-23
(or PTH), unless the timing of sampling, or the assay
used for FGF-23 measurement prevented subtle changes
in this hormone being detected.
Circulating FGF-23 concentrations do not change
acutely postprandially in healthy humans
28or those
with early CKD
29and do not demonstrate a circadian
rhythm in healthy humans or hemodialysis patients.
30,31These observations have not been examined in the cat,
but to minimize the effect of eating and of circadian
variation on all parameters, owners were telephoned the
day before every appointment to remind them to starve
their cats for at least 8 hours and appointments were
conducted in the mornings. Studies of murine
mod-els,
32,33of healthy humans
25,26and CKD patients,
34,35have revealed variable responses of urinary phosphate
excretion, serum phosphate, and serum FGF-23
concen-trations with changes in dietary phosphate load. One
study of 16 normophosphatemic stage 3 or 4 CKD
patients randomized in a 2
9
2 factorial design to diets
with different phosphate loads (P)
a phosphate binder
(PB) (750 mg P
+
PB, 1500 mg P
+
placebo, 750 mg P
+
placebo, 1500 mg P
+
PB daily) for 2 weeks found no
significant changes in serum phosphate or FGF-23
con-centrations in any group, but significant reductions in
24-hour phosphate excretion were seen in all groups
except the group receiving the highest dietary phosphate
load (1500 mg
+
placebo).
36It seems, therefore, that
dietary phosphate load can alter urinary phosphate
excretion via a mechanism independent of FGF-23.
Infusion of phosphate into the duodenum and
intra-venous infusion of duodenal extracts into rats induce a
rapid increase in FE phosphate.
37This is independent
of FGF-23, PTH, and the phosphatonin sFRP-4 and is
unchanged by denervation of the kidney. Therefore, it
has been proposed that the duodenal mucosa secretes a
phosphatonin-like substance which induces a rapid
increase in the fractional excretion of phosphorus.
37However, to date, the substance(s) involved in this
gut-renal axis remain unknown. Furthermore, although the
presence of a phosphate-sensing mechanism in various
organs has been postulated,
38this also remains to be
elucidated.
Cats fed the test diet had no change in plasma PTH
concentrations throughout the trial, whereas PTH
con-centration increased in cats fed the control diet. The
majority of these increases occurred within the reference
interval. It is difficult to assess the definitive cause of
this difference between groups. The control diet had a
slightly lower calcium:phosphate (Ca:P) ratio (1.10)
than the test diet (1.21), which may have been a
stimu-lus
of
PTH
secretion;
however,
ionized
calcium
increased over time in both groups. Alternatively, the
change in PTH for cats eating the control diet may
reflect an age-related increase. Age has previously been
shown to be a predictor of increasing PTH in both
humans
39,40and cats.
15PTH is increased at baseline for
cats that develop azotemia over 12 months, compared
to cats remaining nonazotemic.
15It is not possible to
assess the effect that these differences in PTH
concentra-tion had, if any, on the progression of CKD in the
pre-sent study, as the proportion of cats that developed
azotemia was low in both diet groups. Additionally,
measurement of PTH in this study was hampered by
poor sensitivity of the assay, resulting in 41.6% of
sam-ples being below the LoD. Unfortunately, currently,
there are no validated PTH assays for use with feline
samples that do not have poor sensitivity.
41The assay
used in this study measures intact PTH and has been
validated previously.
42,43An assay measuring
biologi-cally active “whole” PTH molecule has also been
vali-dated, but has not been found to offer advantage over
the intact PTH assay.
42Total calcium concentrations increased in all cats
during the study (independent of diet). Both diets could
have had greater calcium bioavailability than the
mix-ture of diets fed at baseline or could have resulted in a
similar increase in calcium absorption, bone resorption,
or reduced calcium excretion. Alternatively, total
cal-cium may increase with age. In contrast, apparently
healthy cats
>
10 years of age in Belgium have
signifi-cantly lower total calcium concentrations than cats 6
–
10 years old.
44Another study found a negative effect of
age on plasma total calcium concentrations in 525
healthy purebred cats, but deemed it to be clinically
irrelevant when establishing a reference range.
45Ionized
calcium concentrations also increased during the study
period, but there was a significant difference in this
change between the groups. The increase in calcium
does not appear to be PTH-mediated, as the test diet
was associated with stable PTH but a greater increase
in ionized calcium. Additionally, it does not appear to
be vitamin D-mediated as both diets had the same
vita-min D concentration, and both diets had were mildy
acidifying (urine pH 6
–
6.5) and therefore will not have
induced difference in urinary calcium excretion.
Devel-opment of ionized hypercalcemia occurred in five cats
eating test diet and only one cat eating control diet;
however, this difference was not significant. It is
possi-ble that these cats developed idiopathic hypercalcemia,
independent of dietary calcium/phosphate load.
How-ever, feeding a substantially phosphate-restricted renal
diet has previously been associated with development of
ionized hypercalcemia in azotemic cats.
22It is plausible
that
moderate dietary
phosphate
restriction could
induce ionized hypercalcemia via the same
(undeter-mined) mechanism in healthy cats and although the
consequence of this is unclear, it should be considered
when advising on diets for healthy older cats, as it
might increase the risk of developing calcium-containing
uroliths.
these cats would go on to become hyperthyroid over
time, which would not be unexpected because increasing
age is an independent risk factor for development of
feline hyperthyroidism.
47Bodyweight and BCS decreased in both groups
dur-ing the study period. At enrollment, 61% (33 of 54) of
the cats had a BCS of 6 of 9 or greater and owners
were instructed how much to feed their cats and
encouraged to weigh the food. Thus, part of the
observed reduction in bodyweight may indicate
success-ful
reduction
in
body
fat.
However,
MCS
also
decreased over time in both groups. Although data on
sarcopenia in cats are currently lacking, it is well
recog-nized in humans and to a lesser extent in dogs that lean
body mass declines during aging,
48which could be one
explanation for the decrease in MCS seen during this
study period. Alternatively, lean body mass of cats can
be affected by protein intake;
49however, additional
studies are required to investigate this relationship in
older cats.
Plasma creatinine concentration decreased during the
study in cats on both diets. The mean decrease in
crea-tinine was small (0.12 mg/dL) and is likely a result of
the reduction in lean body mass or is possibly
sec-ondary to an increase in GFR mediated by the increase
TT4. USG significantly decreased gradually over time
for cats on both diets, but in isolation is an unreliable
indicator of renal function as this change could have
been secondary to other changes, for example, reduced
protein intake. A cross-sectional study of apparently
healthy older cats found no significant difference
between serum creatinine concentrations or USG in cats
>
10 years and cats 6
–
10 years of age; however, in
agree-ment with the results of the present study, mean
crea-tinine and USG were slightly lower in the older cats
and the paired design of the present study gives it
greater power to detect differences.
44The test diet was higher in
x
-3 PUFA than the
con-trol diet, which at high doses have renoprotective effects
in experimental canine models of kidney disease,
50although it is not possible from this study to assess
whether the increased concentration of
x
-3 PUFA had
effects on the cats’ renal function. It is also possible that
this difference could have had an impact on
calcium-phosphate homeostasis as there is emerging evidence
that
x-3 PUFA supplementation might reduce bone
turnover in postmenopausal women.
51,52Markers of
bone turnover were not examined in this study;
how-ever, ionized calcium concentrations increased more
greatly in the test diet group, which could be a result of
decreased calcium deposition in bone. Further studies
into the effects of
x
-3 PUFA in cats are warranted.
This trial recruited client-owned cats to improve its
generalizability to veterinary clinical practice. A
limita-tion of this study is that the randomizalimita-tion of cats to
either test or control diet was skewed for cats in
multi-cat households; however, this was considered necessary
to ensure compliance with the assigned diet. The study
was not subjected to an intention-to-treat analysis
because of the duration of the trial. Failure of cats to
eat the assigned diet would have had a substantial
impact on the comparison between test and control
diets and bias the estimate of the effects of feeding the
test diet. Therefore, to address the aims of this study, it
was considered judicious to analyze data only from cats
that had at least one follow-up visit on the intervention.
Data on compliance are presented to show what level
of acceptance of dietary change can be achieved in cats
of this age bearing in mind the incentive to owners of
receiving diet free of charge. The majority of cats ate
other foods during the study. Although fish was not
consumed (because of the high
x
3 PUFA content), and
quantities of fresh meat and dairy were low, 17
–
18 cats
in each group regularly ate a wet maintenance diet cat
food. This is a limitation of the study as it is difficult to
quantify the additional phosphate consumed by these
cats, which may have impacted on the ability to see an
effect of the test diets on calcium-phosphate
homeosta-sis. Future studies aiming to examine the effect of feline
diets in client-owned cats should be aware that pet
own-ers may not be willing to feed one diet type exclusively.
Various medications were administered to cats during
the study period in both groups, as needed based on
clinical judgement. The most frequently prescribed
med-ications were NSAIDs for osteoarthritis. It is difficult to
assess the impact these medications may have had, if
any, on the study outcomes. However, the proportion
of cats requiring long-term NSAIDs was not
signifi-cantly different between groups and the need for pain
relief to manage osteoarthritis commonly occurs in
older cats. Therefore, the use of these medications in
this study cohort reflects the wider management of
older cats in veterinary clinical practice.
Only 11% (6 of 54) of cats were diagnosed with
azo-temic CKD during the present study. A previous
prospective study, where no attempt was made to
mod-ify the cats’ diets during the study period, found 30.5%
of cats developed azotemic CKD within 12 months.
3The disparity between these studies may be attributable
to having a slightly younger population of cats in the
present study, 12.2 [11.2, 13.8] years, compared to 13.0
[11.0, 15.0] years in the previous study. Given the very
low rate of azotemia development in this study
popula-tion, thousands of cats would have been needed to
detect a significant difference in development of
azote-mic CKD between groups with these two diets.
Recruit-ing very large numbers of cases for clinical veterinary
studies is difficult. Further studies should therefore
con-sider using diets with greater difference in protein and
phosphate content, following cats for longer periods, or
assessing renal function with GFR measurements to
assess whether protein and phosphate restriction can
have beneficial effects in preazotemic CKD cats.
nonazotemic cats should consider using an older
popu-lation, or following cats for longer than 18 months, to
evaluate more thoroughly the effect of protein and
phosphate restriction on renal function.
Footnotes
aIstin, Pfizer, Sandwich, Kent, UK
bSenior Consult Stage 1 Balance, Royal Canin SAS, Aimargues,
France
cwww.wsava.org/sites/default/files/Muscle%20condition%20score
%20chart-cats.pdf
dISTAT, Woodley Equipment, UK eIdexx laboratories, Wetherby, UK
fFGF-23 ELISA Kit, Kainos Laboratories, Tokyo, Japan gTotal intact PTH immunoradiometric assay –coated bead
ver-sion, 3KG600, Scantibodies, Santee, CA
h
IBM SPSS Statistics 21, IBM Corporation, Armonk, NY
i
Prescription diet w/dÒ Feline, Hills Pet Nutrition Inc., Topeka, KS
j
Felimazole, Dechra Veterinary Products Limited, Northwich, UK. A dose of 2.5 mg q12h was administered for 28 days, fol-lowed by a dose adjustment to 2.5 mg alternating with 5 mg q12h, which was maintained for the remainder of the study period
Acknowledgments
This study was performed at the Royal Veterinary
College, London, UK, and funded by Royal Canin
SAS, Aimargues, France.
The authors acknowledge Mrs. Nicola L
otter for her
€
help with this study.
Conflict
of
Interest
Declaration
:
V.
Biourge
is
employed by Royal Canin. The Renal Research Clinic
at the Royal Veterinary College acknowledges support
from Royal Canin for its research on feline
hyperphos-phatemia and chronic kidney disease. R. Geddes is in
receipt of an Everts Luff Trust Research Training
Fellowship.
Off-label Antimicrobial Declaration
: Authors declare
no off-label use of antimicrobials.
References
1. Lulich JP. Feline renal failure: Questions, answers, questions. Compend Contin Educ Vet 1992;14:127–152.
2. Marino CL, Lascelles BD, Vaden SL, et al. Prevalence and classification of chronic kidney disease in cats randomly selected from four age groups and in cats recruited for degenerative joint disease studies. J Feline Med Surg 2014;16:465–472.
3. Jepson RE, Brodbelt D, Vallance C, et al. Evaluation of pre-dictors of the development of azotemia in cats. J Vet Intern Med 2009;23:806–813.
4. Jepson RE, Vallance C, Syme HM, Elliott J. Assessment of urinary N-acetyl-beta-D-glucosaminidase activity in geriatric cats with variable plasma creatinine concentrations with and without azotemia. Am J Vet Res 2010;71:241–247.
5. Jepson RE, Syme HM, Markwell P, et al. Measurement of urinary cauxin in geriatric cats with variable plasma creatinine concentrations and proteinuria and evaluation of urine
cauxin-to-creatinine concentration ratio as a predictor of developing azote-mia. Am J Vet Res 2010;71:982–987.
6. Jepson RE, Coulton GR, Cowan ML, et al. Evaluation of mass spectrometry of urinary proteins and peptides as biomarkers for cats at risk of developing azotemia. Am J Vet Res 2013;74:333–342.
7. van Hoek I, Daminet S, Notebaert S, et al. Immunoassay of urinary retinol binding protein as a putative renal marker in cats. J Immunol Methods 2008;329:208–213.
8. Hall JA, Yerramilli M, Obare E, Jewell DE. Comparison of serum concentrations of symmetric dimethylarginine and creatinine as kidney function biomarkers in cats with chronic kidney disease. J Vet Intern Med 2014;28:1676–1683.
9. Greene JP, Lefebvre SL, Wang M, et al. Risk factors associ-ated with the development of chronic kidney disease in cats evalu-ated at primary care veterinary hospitals. J Am Vet Med Assoc 2014;244:320–327.
10. Finch NC. Predicting the Development of Azotaemia in Geriatric Cats [thesis]. London (UK): University of London; 2011. 11. Moe S, Drueke T, Cunningham J, et al. Definition, evalua-tion, and classification of renal osteodystrophy: A position state-ment from Kidney Disease: Improving Global Outcomes (KDIGO). Kidney Int 2006;69:1945–1953.
12. Barber PJ, Elliott J. Feline chronic renal failure: Calcium homeostasis in 80 cases diagnosed between 1992 and 1995. J Small Anim Pract 1998;39:108–116.
13. Geddes RF, Finch NC, Elliott J, Syme HM. Fibroblast growth factor 23 in feline chronic kidney disease. J Vet Intern Med 2013;27:234–241.
14. Shipov A, Segev G, Meltzer H, et al. The effect of naturally occurring chronic kidney disease on the micro-structural and mechanical properties of bone. PLoS ONE 2014;9:e110057.
15. Finch NC, Syme HM, Elliott J. Parathyroid hormone con-centration in geriatric cats with various degrees of renal function. J Am Vet Med Assoc 2012;241:1326–1335.
16. Finch NC, Geddes RF, Syme HM, Elliott J. Fibroblast growth factor 23 (FGF-23) concentrations in cats with early nona-zotemic chronic kidney disease (CKD) and in healthy geriatric cats. J Vet Intern Med 2013;27:227–233.
17. Elliott J, Rawlings JM, Markwell PJ, Barber PJ. Survival of cats with naturally occurring chronic renal failure: Effect of dietary management. J Small Anim Pract 2000;41:235–242.
18. Ross SJ, Osborne CA, Kirk CA, et al. Clinical evaluation of dietary modification for treatment of spontaneous chronic kid-ney disease in cats. J Am Vet Med Assoc 2006;229:949–957.
19. Geddes RF, Elliott J, Syme HM. The effect of feeding a renal diet on plasma fibroblast growth factor 23 concentrations in cats with stable azotemic chronic kidney disease. J Vet Intern Med 2013;27:1354–1361.
20. Backlund B, Zoran DL, Nabity MB, et al. Effects of diet-ary protein content on renal parameters in normal cats. J Feline Med Surg 2011;13:698–704.
21. NRC. Nutrient Requirements of Cats and Dogs. Washing-ton, D.C.: National Academies; [Oxford: Oxford Publicity Partner-ship, distributor]; 2006.
22. Barber PJ, Rawlings JM, Markwell PJ, Elliott J. Effect of dietary phosphate restriction on renal secondary hyperparathy-roidism in the cat. J Small Anim Pract 1999;40:62–70.
23. Schulz KF, Altman DG, Moher D, Group C. CONSORT 2010 statement: Updated guidelines for reporting parallel group randomised trials. J Clin Epidemiol 2010;63:834–840.
24. Ferrari SL, Bonjour JP, Rizzoli R. Fibroblast growth factor-23 relationship to dietary phosphate and renal phosphate handling in healthy young men. J Clin Endocrinol Metab 2005;90:1519–1524.
26. Antoniucci DM, Yamashita T, Portale AA. Dietary phos-phorus regulates serum fibroblast growth factor-23 concentrations in healthy men. J Clin Endocrinol Metab 2006;91:3144–3149.
27. Sigrist M, Tang M, Beaulieu M, et al. Responsiveness of FGF-23 and mineral metabolism to altered dietary phosphate intake in chronic kidney disease (CKD): Results of a randomized trial. Nephrol Dial Transplant 2013;28:161–169.
28. Nishida Y, Taketani Y, Yamanaka-Okumura H, et al. Acute effect of oral phosphate loading on serum fibroblast growth factor 23 levels in healthy men. Kidney Int 2006;70:2141–2147.
29. Isakova T, Gutierrez O, Shah A, et al. Postprandial mineral metabolism and secondary hyperparathyroidism in early CKD. J Am Soc Nephrol 2008;19:615–623.
30. Larsson T, Nisbeth U, Ljunggren O, et al. Circulating con-centration of FGF-23 increases as renal function declines in patients with chronic kidney disease, but does not change in response to variation in phosphate intake in healthy volunteers. Kidney Int 2003;64:2272–2279.
31. Trivedi H, Szabo A, Zhao S, et al. Circadian variation of mineral and bone parameters in end-stage renal disease. J Nephrol 2015;28:351–359.
32. Zhang S, Gillihan R, He N, et al. Dietary phosphate restriction suppresses phosphaturia but does not prevent FGF23 elevation in a mouse model of chronic kidney disease. Kidney Int 2013;84:713–721.
33. Saito H, Maeda A, Ohtomo S, et al. Circulating FGF-23 is regulated by 1 alpha,25-dihydroxyvitamin D-3 and phosphorus in vivo. J Biol Chem 2005;280:2543–2549.
34. Isakova T, Barchi-Chung A, Enfield G, et al. Effects of dietary phosphate restriction and phosphate binders on FGF23 levels in CKD. Clin J Am Soc Nephrol 2013;8:1009–1018.
35. Spatz C, Roe K, Lehman E, Verma N. Effect of a non-cal-cium-based phosphate binder on fibroblast growth factor 23 in chronic kidney disease. Nephron Clin Pract 2013;123:61–66.
36. Isakova T, Gutierrez OM, Smith K, et al. Pilot study of dietary phosphorus restriction and phosphorus binders to target fibroblast growth factor 23 in patients with chronic kidney disease. Nephrol Dial Transplant 2011;26:584–591.
37. Berndt T, Thomas LF, Craig TA, et al. Evidence for a signal-ing axis by which intestinal phosphate rapidly modulates renal phosphate reabsorption. Proc Natl Acad Sci USA 2007;104:11085– 11090.
38. Kumar R. Phosphate sensing. Curr Opin Nephrol Hyper-tens 2009;18:281–284.
39. Kamycheva E, Sundsfjord J, Jorde R. Serum parathyroid hormone level is associated with body mass index. The 5th Tromsø study. Eur J Endocrinol 2004;151:167–172.
40. Muntner P, Jones TM, Hyre AD, et al. Association of serum intact parathyroid hormone with lower estimated glomeru-lar filtration rate. Clin J Am Soc Nephrol 2009;4:186–194.
41. Parker VJ, Gilor C, Chew DJ. Feline hyperparathyroidism: Pathophysiology, diagnosis and treatment of primary and sec-ondary disease. J Feline Med Surg 2015;17:427–439.
42. Pineda C, Aguilera-Tejero E, Raya AI, et al. Feline parathyroid hormone: Validation of hormonal assays and dynam-ics of secretion. Domest Anim Endocrinol 2012;42:256–264.
43. Williams TL, Elliott J, Syme HM. Calcium and phosphate homeostasis in hyperthyroid cats: Associations with development of azotaemia and survival time. J Small Anim Pract 2012;53: 561–571.
44. Paepe D, Verjans G, Duchateau L, et al. Routine health screening: Findings in apparently healthy middle-aged and old cats. J Feline Med Surg 2013;15:8–19.
45. Reynolds BS. Breed dependency of reference intervals for plasma biochemical values in cats. J Vet Intern Med 2010;24:809.
46. Wakeling J, Elliott J, Syme H. Evaluation of predictors for the diagnosis of hyperthyroidism in cats. J Vet Intern Med 2011;25:1057–1065.
47. Wakeling J, Everard A, Brodbelt D, et al. Risk factors for feline hyperthyroidism in the UK. J Small Anim Pract 2009;50: 406–414.
48. Freeman LM. Cachexia and sarcopenia: Emerging syn-dromes of importance in dogs and cats. J Vet Intern Med 2012;26: 3–17.
49. Laflamme DP, Hannah SS. Discrepancy between use of lean body mass or nitrogen balance to determine protein require-ments for adult cats. J Feline Med Surg 2013;15:691–697.
50. Brown SA, Brown CA, Crowell WA, et al. Effects of diet-ary polyunsaturated fatty acid supplementation in early renal insufficiency in dogs. J Lab Clin Med 2000;135:275–286.
51. Dong H, Hutchins-Wiese H, Kleppinger A, et al. Effects of Omega-3 polyunsaturated fatty acid supplementation on bone turnover in older women. Int J Vitam Nutr Res 2014;84:124–132.