Effect of class F fly ash on fine
sand compaction through soil
stabilization
Siavash Mahvasha, Susana López-Querolb,*, Ali Bahadori-Jahromia a
School of Computing and Engineering, University of West London, St Mary's Road, Ealing, London W5 5RF (UK) bDepartment of Civil, Environmental and Geomatic Engineering, University College London, Chadwick Building, Gower Street, London WC1E 6BT (UK)
* Corresponding author.
E-mail address:[email protected](S. López-Querol).
Abstract
This paper presents the results of an experimental investigation carried out to
evaluate the effect of fly ash (FA) on fine sand compaction and its suitability as a
material for embankments. The literature review demonstrates the lack of research
on stabilization of sandy material using FA. The study is concerned with the role of
FA content in stabilized soil physical characteristics. The main aim of this paper is
to determine the optimum quantity of FA content for stabilization of this type of
soil. This is achieved through particle size distribution and compaction (standard
proctor) tests. The sand was stabilized with three proportions of FA (5%, 10% and
15%) and constant cement content of 3% was used as an activator. For better
comparison, the sand was also stabilized by 3% cement only so that the effect of
FA could be observed more clearly. The results were in line with the literature for
other types of soil, i.e. as the % of FA increases, reduction in maximum dry density
and higher optimum moisture content were observed.
Keywords: Civil engineering, Structural engineering
1. Introduction
A significant share of the world's energy needs is met by coal-fired power stations
by burning coal as fuel. There are residues generated in these power plants, which
are called Coal Combustion Products (CCPs). All around the world, in general,
3 November 2016
Revised:
21 February 2017
Accepted:
most of the fly ash (FA) produced is disposed of in a landfill, causing concerns for
environmental agencies. This paper is focused on the utilization of FA only as it
has proved to be a more viable soil stabilizer in comparison to bottom ash, due to
its finer particle size.
The study is concerned with the influence of FA on stabilized sandy soil. Its effect
is investigated and analyzed through some laboratory tests, such as particle size
distribution (PSD) and compaction (proctor). In this paper, a revision of previous
relevant research is outlined. This section covers some general aspects of FA, its
sustainability, continued by ground improvement and soil stabilization. The aim of
the study presented in this paper is to examine the suitability of class F FA as a
suitable material for construction of embankments in geotechnical engineering
projects. An increase in utilization of FA would lead to lower disposal rate, less
land being used for landfill and replacement of traditional base materials so that
CO2emissions can be lowered.
2. Background
2.1. Fly ash
In 2010,Abmaruzzaman (2010)reported that approximately 80% of the total coal
ash produced worldwide was in form of FA. Coal-fired power plants around the
world, produce nearly 25% of the world's primary energy needs, in other words,
38% of the worldwide electricity is generated from these coal-fired power plants
(Barnes and Sear, 2006). Throughout the past decades, FA has been named as a
problematic solid waste due to the conventional disposal methods of FA from
thermal power plants and factories, as they have contaminated and degraded arable
lands all around the world.
Fly ash ranks as the planet's fifth largest raw material resource (Abmaruzzaman,
2010) and can be used as an alternative to conventional materials in the
construction of geotechnical and geoenvironmental infrastructures. By avoiding to
mine or quarry for natural-occurring resources, and using coal combustion
products as a replacement, sustainable and environmental benefits can be achieved.
Energy demand and emissions to the atmosphere can also be reduced by utilizing
CCPs (Barnes and Sear, 2006).
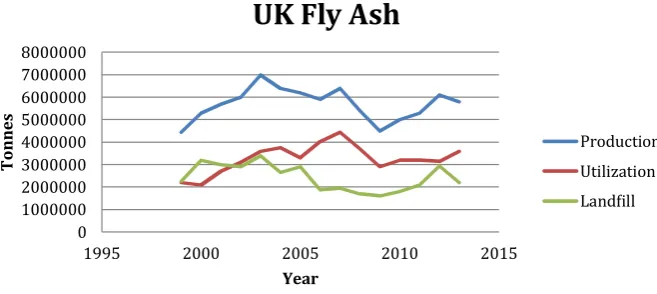
Fig. 1illustrates the development of FA production, utilization and disposal rates
in the UK from 1999 to 2013. It can be seen that, from 1999 to 2003, landfill rates
were higher than the utilization rate, however, 2003 onwards it has been lower than
the utilization rate. In 2010, 36% of the total FA produced was sent to landfill, this
increased to 48% in 2012, while the utilization amount remained at around 32
million tonnes, and then in 2013, the rate of landfill dropped to 38%. The relative
another (Fig. 2,Pandey and Singh, 2010).Abmaruzzaman (2010)believes that the
disposal of FA will soon be too costly if not banned. This can be seen in
Netherlands, where all the FA must be utilized or exported since landfill is
prohibited (Eijk et al., 2011).
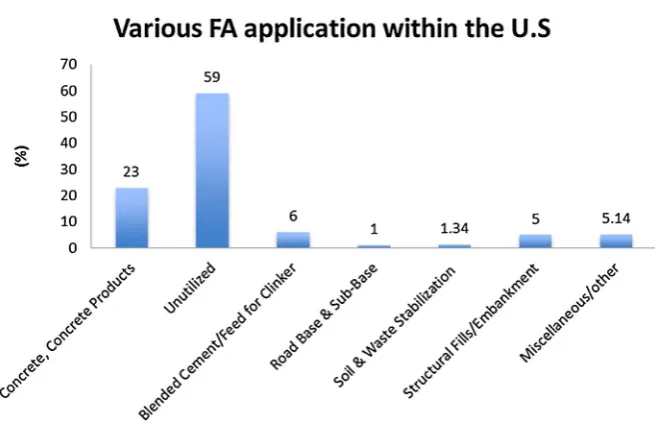
Fly ash has a broad range of applications within the construction industry (Fig. 3).
The utilization of FA as a partial replacement for Portland cement in concrete is
widespread and considerable volumes are used. Looking at the US FA utilization in
that figure, nearly, 60% of the total FA produced was unutilized in 2014 (which,
compared withFig. 2also demonstrates the unutilization significantly increased in
that country since 2010). This is one of the highest unused rates of FA around the
world, while the remaining is mostly used for concrete and cement production. FA
utilization for soil stabilization, which this study is focused on, is at only 0.34% of
[(Fig._1)TD$FIG]
Fig. 1.UK FA production, utilization, and landfill values (afterCarroll, 2015;UKQAA, 2016).
[(Fig._2)TD$FIG]
0 20 40 60 80 100 120
M
il
li
o
n t
o
nne
s
pe
r
ye
ar
FA production and utilization in various countries
Production Utilization
total FA produced in US, and 1% for waste stabilization. In road base and sub-base,
the utilization was 1%, with structural fills and embankment over 5%.
Due to the volumes of material involved in the construction of road, railways and
airports, utilizing FA, has a profound impact from the environmental point of view
on the surroundings (Celauro et al., 2012). The beneficial reuse of fly ash in
embankments construction not only helps ease one of the most pressing
environmental problems, disposal of wastes, but may also result in (Cetin and
Aydilek, 2013);
•Reducing solid waste disposal costs incurred by industry.
•Reducing landfill requirements.
•Minimizing damage to natural resources caused by excavating earthen materials
for construction.
•Obtaining added value from waste materials.
•Conserving production energy.
•Providing sustainable construction.
•Providing economic growth.
The reuse of waste materials, such as fly ash, in highway construction, has a
significant potential to minimize the amount of disposed waste materials (Baykal
et al., 2004;Cetin and Aydilek, 2013).Bumjoo et al. (2005)studied the suitability
of fly and bottom ash mixture in highway embankment construction. In this study,
it was found that the optimum water content (OMC) increased, while the maximum
dry density (MDD) decreased, as the FA content was increased from 50% to 100%
[(Fig._3)TD$FIG]
(Bumjoo et al., 2005). In the same study, it was concluded that, with the right
design and fly/bottom ash mixture, the results proved suitability for highway
embankments and also to be as high as those of conventional sandy soils.
2.2. Ground improvement and stabilization using FA
Ground improvement can be defined‘as the introduction of materials or energy to
soils to affect a change in performance of the ground such that it performs more
reliably and can be incorporated into the design process’(Essler, 2012). Ground
improvement techniques are used all around the world to improve the load-bearing
capacity and stability of soil, to enable the construction of projects with very long
design lives such as embankments, retaining walls and bridges (Cofra, 2005).
Beeghly (2003) explains the main difference between soil modification and soil
stabilization. On one hand, soil modification from moderate rates of additives (i.e. 3%
quicklime) causes improvements such as drying and swells reduction. On the other
hand soil stabilization from higher rates of application is the focus of this paper
(Beeghly, 2003). According toO'Flaherty and Hughes (2016)the term‘modification’
is used to describe the use of a chemical to improve the properties of a soil without
causing much increase to its elastic modulus or tensile strength, while the term
stabilization is used to describe the utilization of a chemical to achieve a soil stabilized
layer with significant strength and stiffness (O'Flaherty and Hughes, 2016).
The stabilization is achieved by the soil particles being glued more chemically than
physically. Dealing with weak soil is one of the most major challenges in the
construction industry (Cristelo et al., 2013; Senol et al., 2006). This situation
probably might occur in road and highway construction (Fauzi et al., 2010;Senol
et al., 2006) or in geotechnical engineering. It is vital to find methods of soil
improvement techniques so that demands can be met.
Dockter et al. (1999)concluded that coal combustion FA has ‘excellent potential
for use in rammed earth construction as a low-cost alternative to Portland cement
and other stabilizers because of its pozzolanic properties’. The main purpose of soil
stabilization is the rendering of weak soils that are unable to meet a specific
project's requirement. Soil stabilization benefits not only from the enhancement of
the compressive strength of the soft soil (Bergado et al., 1996; Prabakar et al.,
2004) but also to improve the shear strength, filter, drainage system (Prabakar
et al., 2004), permeability, soil resistance to the weathering process and traffic
usage (ASTM 1992, cited by Zaliha et al., 2013) to meet specific engineering
projects requirements (Kolias et al., 2005).
According toMackiewicz and Ferguson (2005), utilization of FA stabilization of the
soil used in subgrade improves the stability of the working platform, which is less
made from CCPs, it is necessary to take measures against slope failure caused by rain
or embankment collapse caused by an earthquake (Sato and Nishimoto, 2005).
Makusa (2012)believes that soil stabilized by FA has some limitations:
•Soil to be stabilized shall have less moisture content; therefore, dewatering may
be required.
•Soil-fly ash mixture cured below zero and then soaked in water are highly
susceptible to slaking and strength loss.
•Sulfur contents can form expansive minerals in soil-fly ash mixture, which
reduces the long-term strength and durability.
In an article,Hossain (2010)states that soils with a‘liquid limit less than 40% and
plasticity index within the range 22–25% are also most suitable for stabilization'.
However, the same author concluded that soils do not have to meet the two
conditions, and may still be suitable for stabilization (Hossain, 2010). It is,
therefore, important to investigate the suitability of soil to be stabilized using
different types and combinations of stabilizers and soil types.
It is of interest to note that FA is available free of charge at most power plants, and
hence, there are only transportation costs, and laying and rolling costs to be
considered. For a given degree of compaction, it is suggested that maximum dry
density is lower for stabilized soil than that of soil not stabilized (Makusa, 2012).
2.3. Stabilization activation
There are some common stabilizers, such as lime and cement, and there are some
more recent stabilizers such as fly ash (Class C), blast furnace slag, sodium
hydroxide and sodium silicate (Palomo et al., 1999). One of the key factors of
utlizing cement in stabilizing soils, is that cement reaction is independent of soil
minerals, and it relies on the water that may be found in any soil.Makusa (2012)
states the following improved properties of cement stabilized soils:
•Decreased cohesiveness.
•Decreased volume expansion or compressibility.
•Increased strength.
Class F fly ash can be used in the stabilization process, if added with another
activator, such as lime or cement. It is important to note that the impact of Class F
(plus an activator) may differ significantly compare to a Class C stabilized sample.
Das and Yudhbir (2005) state that the additional strength gained by utilizing
cement or lime is an indication of the FA pozzolanic reactivity, which depends on
the carbon content, the fineness and also the quality and quantity of glassy phase
present in the FA. It is highly dependable on the pozzolan content of each ash, the
lime-based binders were compared to cement-based binders, the mechanical
strength achieved by cement-based binders was higher and of a better consistency
(Cristelo et al., 2012b). Another advantage of using fly ash and cement together is
that it can help in containing the leachate of heavy metals (Kamon et al., 2000).
In another article,Kaniraj and Havanagi (1999)explain that there is a significant
gain in strength (particularly in the case of class F fly ash) even with a small
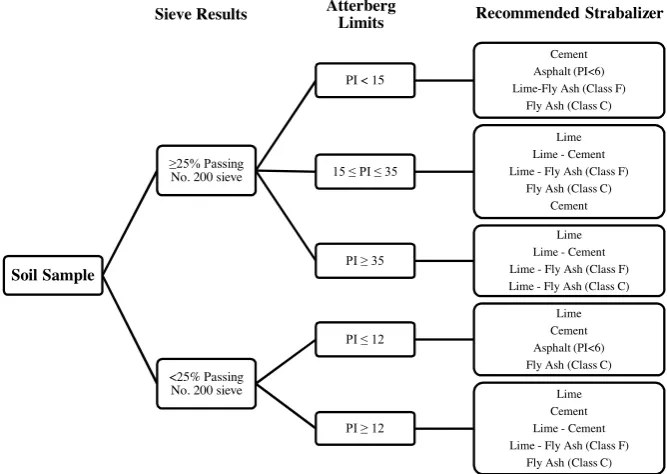
addition of cement, and the gain depends on the cement content and curing time. A
methodology (Fig. 4) has been developed by the U.S air force, by which an
appropriate stabilizer can be selected (Little and Nair, 2009).
2.4. Laboratory testing
There have been many studies, with different approaches, on the utilization of fly
ash. In various researches, where fly ash was utilized for soil stabilization, there
were some common laboratory tests performed, in order to obtain a before and
after treatment properties, both physical and chemical. Among the most extended
tests were:
Particle Size Distribution (Cristelo et al.,2011and2012b), Compaction test, rammer
method (Cristelo et al.,2011,2012b;Hossain, 2010;Kamon et al., 2000;Kaniraj and
Havanagi, 1999; Kolias et al., 2005; Jackson et al., 2007), California Bearing
[(Fig._4)TD$FIG]
Recommended Strabalizer Atterberg Limits Sieve Results Soil Sample ≥25% Passing No. 200 sievePI < 15
Cement Asphalt (PI<6) Lime-Fly Ash (Class F)
Fly Ash (Class C)
15 ≤ PI ≤ 35
Lime Lime - Cement Lime - Fly Ash (Class F)
Fly Ash (Class C) Cement
PI ≥ 35
Lime Lime - Cement Lime - Fly Ash (Class F) Lime - Fly Ash (Class C)
<25% Passing No. 200 sieve
PI ≤ 12
Lime Cement Asphalt (PI<6) Fly Ash (Class C)
PI ≥ 12
Lime Cement Lime - Cement Lime - Fly Ash (Class F)
Fly Ash (Class C)
Capacity (CBR) test (Hossain, 2010;Kolias et al., 2005;Jackson et al., 2007;Sato
and Nishimoto, 2005), Compressive Strength (Arioz et al., 2013; Cristelo et al.,
2012a;Kamon et al., 2000;Kolias et al., 2005;Sato and Nishimoto, 2005), XRD
Analysis (Arioz et al., 2013; Cristelo et al., 2012a; Kolias et al., 2005). For the
purpose of this paper, PSD and compaction tests have been performed.
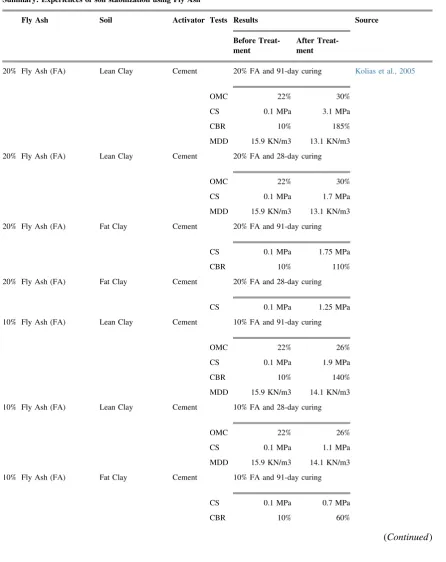
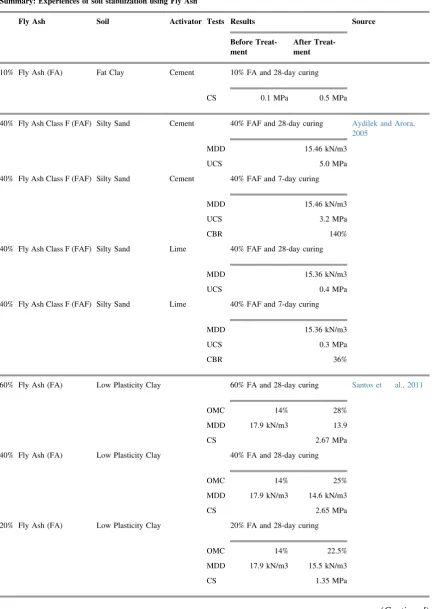
The results of various tests carried out to date are illustrated and are discussed
thoroughly further onTable 1. Several researchers (Cristelo et al., 2011;Kolias et al.,
2005;Aydilek and Arora, 2005;Santos et al., 2011; Cristelo et al.,2012a,2012b;
Reyes and Pando, 2007;Sahu, 2001;McCarthy et al., 2011) studied the effect of fly
ash (both class C and F) on ground improvement through soil stabilization.
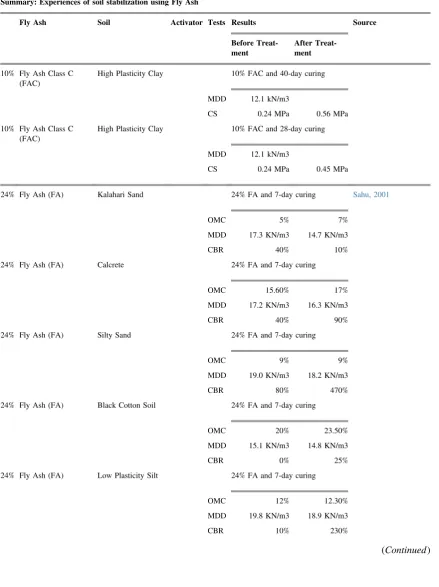
After reviewing the results in Table 1, it was found that majority of the soil
samples were in the form of clay and very few sandy samples. It can be seen that
there is an increase in the CBR value except one case in the study bySahu (2001),
where there was a reduction in CBR, only for the Kalahari Sand, from 40% to 10%
when used 24% fly ash, and down to 30% when only 8% fly ash was used. This
must be due to the particular properties of Kalahari Sand. Aydilek and Arora
(2005) had silty sand stabilized with 40% of Class F fly ash with two different
activators, lime and cement. After four weeks of curing, the sample that was
stabilized with cement had an unconfined compressive strength of 5.0 MPa, over
twelve times more than what was achieved with lime. This was an expected result
asCristelo et al. (2012b) mentioned that regarding mechanical strength,
cement-based binders usually deliver significantly better and more consistent results when
compared to lime-bases binders.
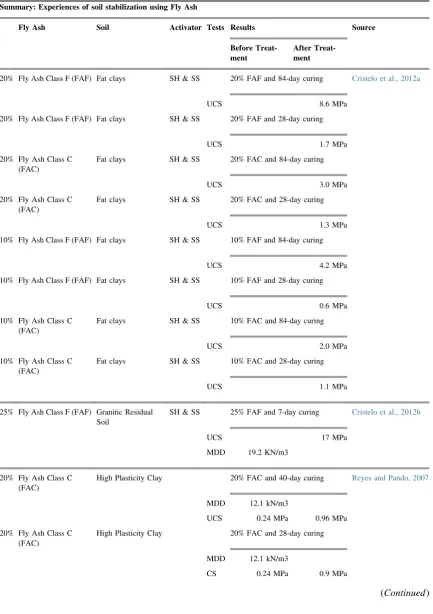
Furthermore,Santos et al. (2011)show that there is not a significant improvement
when the FA contend increased from 40% to 60%, whereas there was a clear
improvement from 20% to 40% FA content. It is clear that cement is a more viable
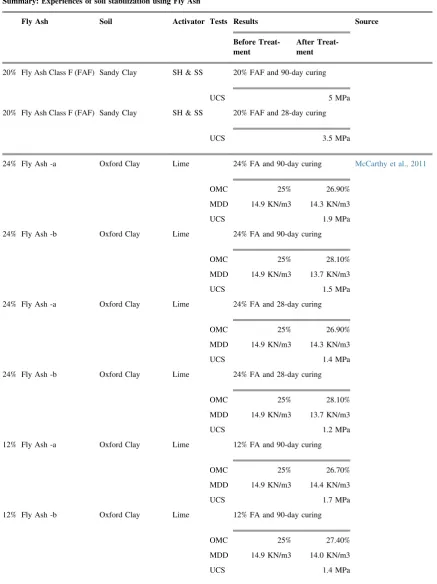
option as an activator than lime. Meanwhile in 2011, Cristelo et al. published the
results of an extensive research on soil improvement by using Class F FA. The
curing periods were as long as a year, which has produced astonishing results, with
one sample (40% FA – 365-day curing) reaching 43 MPa in unconfined
compressive strength. In the same study, samples were cured at 90 and 28 days
as well, with UCS of 17 MPa and 8 MPa (40% FA) respectively. Clearly, the
longer the curing period, the higher the strength of the soil. Furthermore,Cristelo
et al. (2012a)compared soil stabilization with both class C and class F FA. Using
the same percentage (20%) of FA and same curing periods (84-day), the samples,
which were stabilized with class F had about three times the strength compared to
the samples stabilized with class C. In overall, there were improvements on the
physical strength of fly ash stabilized samples in every study. It can be concluded
that the most effective stabilization is, using Class F fly ash with cement as the
Table 1. Results of soil stabilizing by using fly ash from nine different studies.
Summary: Experiences of soil stabilization using Fly Ash
Fly Ash Soil Activator Tests Results Source
Before Treat-ment
After Treat-ment
20% Fly Ash (FA) Lean Clay Cement 20% FA and 91-day curing Kolias et al., 2005
OMC 22% 30%
CS 0.1 MPa 3.1 MPa
CBR 10% 185%
MDD 15.9 KN/m3 13.1 KN/m3
20% Fly Ash (FA) Lean Clay Cement 20% FA and 28-day curing
OMC 22% 30%
CS 0.1 MPa 1.7 MPa
MDD 15.9 KN/m3 13.1 KN/m3
20% Fly Ash (FA) Fat Clay Cement 20% FA and 91-day curing
CS 0.1 MPa 1.75 MPa
CBR 10% 110%
20% Fly Ash (FA) Fat Clay Cement 20% FA and 28-day curing
CS 0.1 MPa 1.25 MPa
10% Fly Ash (FA) Lean Clay Cement 10% FA and 91-day curing
OMC 22% 26%
CS 0.1 MPa 1.9 MPa
CBR 10% 140%
MDD 15.9 KN/m3 14.1 KN/m3
10% Fly Ash (FA) Lean Clay Cement 10% FA and 28-day curing
OMC 22% 26%
CS 0.1 MPa 1.1 MPa
MDD 15.9 KN/m3 14.1 KN/m3
10% Fly Ash (FA) Fat Clay Cement 10% FA and 91-day curing
CS 0.1 MPa 0.7 MPa
CBR 10% 60%
Table 1. (Continued)
Summary: Experiences of soil stabilization using Fly Ash
Fly Ash Soil Activator Tests Results Source
Before Treat-ment
After Treat-ment
10% Fly Ash (FA) Fat Clay Cement 10% FA and 28-day curing
CS 0.1 MPa 0.5 MPa
40% Fly Ash Class F (FAF) Silty Sand Cement 40% FAF and 28-day curing Aydilek and Arora, 2005
MDD 15.46 kN/m3
UCS 5.0 MPa
40% Fly Ash Class F (FAF) Silty Sand Cement 40% FAF and 7-day curing
MDD 15.46 kN/m3
UCS 3.2 MPa
CBR 140%
40% Fly Ash Class F (FAF) Silty Sand Lime 40% FAF and 28-day curing
MDD 15.36 kN/m3
UCS 0.4 MPa
40% Fly Ash Class F (FAF) Silty Sand Lime 40% FAF and 7-day curing
MDD 15.36 kN/m3
UCS 0.3 MPa
CBR 36%
60% Fly Ash (FA) Low Plasticity Clay 60% FA and 28-day curing Santos et al., 2011
OMC 14% 28%
MDD 17.9 kN/m3 13.9
CS 2.67 MPa
40% Fly Ash (FA) Low Plasticity Clay 40% FA and 28-day curing
OMC 14% 25%
MDD 17.9 kN/m3 14.6 kN/m3
CS 2.65 MPa
20% Fly Ash (FA) Low Plasticity Clay 20% FA and 28-day curing
OMC 14% 22.5%
MDD 17.9 kN/m3 15.5 kN/m3
CS 1.35 MPa
Table 1. (Continued)
Summary: Experiences of soil stabilization using Fly Ash
Fly Ash Soil Activator Tests Results Source
Before Treat-ment
After Treat-ment
20% Fly Ash Class F (FAF) Fat clays SH & SS 20% FAF and 84-day curing Cristelo et al., 2012a
UCS 8.6 MPa
20% Fly Ash Class F (FAF) Fat clays SH & SS 20% FAF and 28-day curing
UCS 1.7 MPa
20% Fly Ash Class C (FAC)
Fat clays SH & SS 20% FAC and 84-day curing
UCS 3.0 MPa
20% Fly Ash Class C (FAC)
Fat clays SH & SS 20% FAC and 28-day curing
UCS 1.3 MPa
10% Fly Ash Class F (FAF) Fat clays SH & SS 10% FAF and 84-day curing
UCS 4.2 MPa
10% Fly Ash Class F (FAF) Fat clays SH & SS 10% FAF and 28-day curing
UCS 0.6 MPa
10% Fly Ash Class C (FAC)
Fat clays SH & SS 10% FAC and 84-day curing
UCS 2.0 MPa
10% Fly Ash Class C (FAC)
Fat clays SH & SS 10% FAC and 28-day curing
UCS 1.1 MPa
25% Fly Ash Class F (FAF) Granitic Residual Soil
SH & SS 25% FAF and 7-day curing Cristelo et al., 2012b
UCS 17 MPa
MDD 19.2 KN/m3
20% Fly Ash Class C (FAC)
High Plasticity Clay 20% FAC and 40-day curing Reyes and Pando, 2007
MDD 12.1 kN/m3
UCS 0.24 MPa 0.96 MPa
20% Fly Ash Class C (FAC)
High Plasticity Clay 20% FAC and 28-day curing
MDD 12.1 kN/m3
CS 0.24 MPa 0.9 MPa
Table 1. (Continued)
Summary: Experiences of soil stabilization using Fly Ash
Fly Ash Soil Activator Tests Results Source
Before Treat-ment
After Treat-ment
10% Fly Ash Class C (FAC)
High Plasticity Clay 10% FAC and 40-day curing
MDD 12.1 kN/m3
CS 0.24 MPa 0.56 MPa
10% Fly Ash Class C (FAC)
High Plasticity Clay 10% FAC and 28-day curing
MDD 12.1 kN/m3
CS 0.24 MPa 0.45 MPa
24% Fly Ash (FA) Kalahari Sand 24% FA and 7-day curing Sahu, 2001
OMC 5% 7%
MDD 17.3 KN/m3 14.7 KN/m3
CBR 40% 10%
24% Fly Ash (FA) Calcrete 24% FA and 7-day curing
OMC 15.60% 17%
MDD 17.2 KN/m3 16.3 KN/m3
CBR 40% 90%
24% Fly Ash (FA) Silty Sand 24% FA and 7-day curing
OMC 9% 9%
MDD 19.0 KN/m3 18.2 KN/m3
CBR 80% 470%
24% Fly Ash (FA) Black Cotton Soil 24% FA and 7-day curing
OMC 20% 23.50%
MDD 15.1 KN/m3 14.8 KN/m3
CBR 0% 25%
24% Fly Ash (FA) Low Plasticity Silt 24% FA and 7-day curing
OMC 12% 12.30%
MDD 19.8 KN/m3 18.9 KN/m3
CBR 10% 230%
Table 1. (Continued)
Summary: Experiences of soil stabilization using Fly Ash
Fly Ash Soil Activator Tests Results Source
Before Treat-ment
After Treat-ment
8% Fly Ash (FA) Kalahari Sand 8% FA and 7-day curing
OMC 5% 5%
MDD 17.3 KN/m3 16.8 KN/m3
CBR 40% 30%
8% Fly Ash (FA) Calcrete 8% FA and 7-day curing
OMC 15.60% 19.90%
MDD 17.2 KN/m3 16.4 KN/m3
CBR 40% 60%
8% Fly Ash (FA) Silty Sand 8% FA and 7-day curing
OMC 9% 8.80%
MDD 19.0 KN/m3 18.6 KN/m3
CBR 80% 315%
8% Fly Ash (FA) Black Cotton Soil 8% FA and 7-day curing
OMC 20% 22.70%
MDD 15.1 KN/m3 15.3 KN/m3
CBR 0% 5%
8% Fly Ash (FA) Low Plasticity Silt 8% FA and 7-day curing
OMC 12% 11.90%
MDD 19.8 KN/m3 19.6 KN/m3
CBR 10% 40%
40% Fly Ash Class F (FAF) Sandy Clay SH & SS 40% FAF and 365-day curing Cristelo et al., 2011
UCS 43 MPa
40% Fly Ash Class F (FAF) Sandy Clay SH & SS 40% FAF and 90-day curing
UCS 17 MPa
40% Fly Ash Class F (FAF) Sandy Clay SH & SS 40% FAF and 28-day curing
UCS 8 MPa
20% Fly Ash Class F (FAF) Sandy Clay SH & SS 20% FAF and 365-day curing
UCS 24 MPa
Table 1. (Continued)
Summary: Experiences of soil stabilization using Fly Ash
Fly Ash Soil Activator Tests Results Source
Before Treat-ment
After Treat-ment
20% Fly Ash Class F (FAF) Sandy Clay SH & SS 20% FAF and 90-day curing
UCS 5 MPa
20% Fly Ash Class F (FAF) Sandy Clay SH & SS 20% FAF and 28-day curing
UCS 3.5 MPa
24% Fly Ash -a Oxford Clay Lime 24% FA and 90-day curing McCarthy et al., 2011
OMC 25% 26.90%
MDD 14.9 KN/m3 14.3 KN/m3
UCS 1.9 MPa
24% Fly Ash -b Oxford Clay Lime 24% FA and 90-day curing
OMC 25% 28.10%
MDD 14.9 KN/m3 13.7 KN/m3
UCS 1.5 MPa
24% Fly Ash -a Oxford Clay Lime 24% FA and 28-day curing
OMC 25% 26.90%
MDD 14.9 KN/m3 14.3 KN/m3
UCS 1.4 MPa
24% Fly Ash -b Oxford Clay Lime 24% FA and 28-day curing
OMC 25% 28.10%
MDD 14.9 KN/m3 13.7 KN/m3
UCS 1.2 MPa
12% Fly Ash -a Oxford Clay Lime 12% FA and 90-day curing
OMC 25% 26.70%
MDD 14.9 KN/m3 14.4 KN/m3
UCS 1.7 MPa
12% Fly Ash -b Oxford Clay Lime 12% FA and 90-day curing
OMC 25% 27.40%
MDD 14.9 KN/m3 14.0 KN/m3
UCS 1.4 MPa
for each study. These include; cement, lime, sodium hydroxide (SH) and sodium
silicate (SS). In the studies, Cristelo et al.(2011),(2012a)and(2012b), the authors
used a mixture of SH and SS.
A new chart (Fig. 5) for various possible results of soil stabilization using FA has
been developed from summarizingTable 1. As the main conclusion, it is addressed
that further research needs to be carried out on sand, clayey sand in particular, and
also on high plasticity silts. The present research is focused on sand only.
3. Methods
Comprehensive series of laboratory tests consisting of particle size distribution
(PSD) and standard compaction test were conducted on untreated soil samples and Table 1. (Continued)
Summary: Experiences of soil stabilization using Fly Ash
Fly Ash Soil Activator Tests Results Source
Before Treat-ment
After Treat-ment
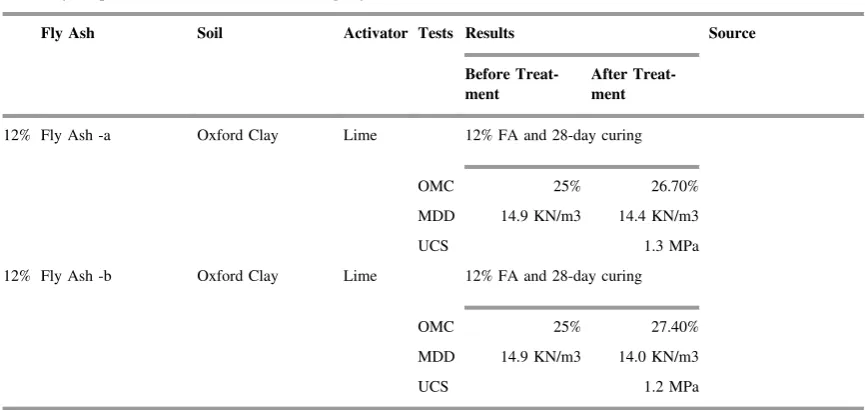
12% Fly Ash -a Oxford Clay Lime 12% FA and 28-day curing
OMC 25% 26.70%
MDD 14.9 KN/m3 14.4 KN/m3
UCS 1.3 MPa
12% Fly Ash -b Oxford Clay Lime 12% FA and 28-day curing
OMC 25% 27.40%
MDD 14.9 KN/m3 14.0 KN/m3
UCS 1.2 MPa
OMC - Optimum Moisture Content. MDD - Maximum Dry Density. CBR - California Bearing Ratio. UCS - Unconfined Compressive Strength. CS - Compressive Strength.
stabilized samples. A minimum of three samples from each variation of soil was
tested so that reliable results can be attained. There were three variations of fly ash
content chosen for this study, 5%, 10% and 15% (similar to Cristelo et al.,2012a;
2012b). In this experimental study, a total of 14 compaction tests were performed.
The aim of the laboratory tests was to analyze the influence FA content on
stabilized soil density and optimal water content, by comparing stabilized soils
against pre-treated samples.
As an activator solution, cement with 3% content will be used in this study. The
quantity of the cement content is selected as an average based on previous studies
(Kolias et al., 2005;Kaniraj and Havanagi, 1999). The proposed tests are described
in more detail in the following section. At least, two representatives specimens for
determination of the moisture content were taken and, hence, an average derived
(BSI, 1990a).
4. Experimental
4.1. Particle size distribution (PSD)
For a basic understanding of the nature of the soil, the distribution of the grain size
present in a given soil mass must be known. The grain size distribution of
coarse-grained soils (gravelly and/or sandy) is determined by sieve analysis (Das, 2014).
The sieves used for the purpose of this study consist of woven-wire square meshes.
[(Fig._5)TD$FIG]
OMC Optimum Moisture Content LL Liquid Limit SM Silty Sand MDD Maximum Dry Density ML Low Plasticity Silt SC Clayey Sand
CBR California Bearing Ratio CL Low Plasticity Clay SP Poorly graded sand UCS Unconfined Compressive Strength MH High Plasticity Silt SW Well Graded sand
CS Compressive Strength CH High Plasticity Clay G Gravel S1 Clean sands with less than 5% fines S2 Sands with over 15% fines
Possible Achievements Soil Classification Atterberg Limits Sieve Results Soil Sample
≥ 50% Passing
No. 200 sieve
LL ≤ 50
ML
CBR can increase by a facotr of 23 - About 4% Reduction in MDD can be achieved*
CL
Can become at least 31 times stronger- CBR can become18 times higher - 30-40%
increase in OMC
LL > 50
MH Requires more research
CH UCS of about 90 times higher is achievable- CBR can be increased 11 times
<50% Passing No. 200 sieve
LL: N/A
G N/A
S S1
SW Requires more research
SP Requires more research
S2
SM
CBR can increase by a facotr of 5- About 4% Reduction in MDD can be
achieved*
SC Requires more research
Note: These results are possible with curing during of 12 to 13 weeks with Fly Ash content of 20% to 24%. *Cured for only seven days
The PSD tests were performed in accordance to BS 1377–2 1990, Classification
tests, the “Dry Sieving Method” (BSI, 1990b). From the classification graph
produced as a result of PSD, the grading and unifomitry of the soil sample can be
calculated, along with the soil classification using the British soil classification
system, which classifies soils with particles size range of 0.06 mm to 2 mm, as
sand (BSI, 1990b). According toO'Flaherty and Hughes (2016), the typical values
for the Coefficient of Gradation (Cc) and the Uniformity Coefficient (CU) in soil
classification, for even graded soils is<1 and<6, respectively.
4.2. Compaction test (2.5 kg Rammer)
In order to find the optimum values, a compaction test is carried out in accordance
with BS 1377–4 1990, Compaction-related tests, the “2.5 kg Rammer Method”
(BSI, 1990c). The compaction is carried out in a modified CBR mould with soil
compacted in three layers and each layer subject to 72 blows from the 2.5 kg
rammer (BSI, 1990c). Generally, the optimum moisture content (OMC) of sandy
soils is about 11%, and the maximum dry density (MDD) of sandy soils is just over
19 kN/m3(O'Flaherty and Hughes, 2016). Construction specifications commonly
require that mixing, compaction, and final shaping be completed in one or two
hours of initial mixing. For the purpose of this study, the samples were compacted
within 30 min from the beginning of mixing. Strength and compaction
characteristics at no delay define optimum properties of the fly ash treated
materials. The unit weight of fly ash-soil mixture is an important parameter since it
controls the strength, compressibility, and permeability.
Compaction is often delayed in normal construction operations, which causes the
fly ash to bond to the soil particles in a loose state, at which point these bonds must
be disrupted to densify the material (Mackiewicz and Ferguson, 2005). Therefore,
a portion of the compaction effort is used to reverse the effect caused by the delay
with the remaining energy to compact the mixture. When compaction is delayed 1
hour after incorporation of the fly ash, maximum densities can decrease up to 6 to
16 kN/m3(Mackiewicz and Ferguson, 2005).
5. Materials
5.1. Sand
For the purpose of this study, the sand (Building Sand) was obtained from Civils &
Lintels, a UK supplier. The sand was delivered in polyethylene bags of 25 kgs.
PSD results are provided inFig. 6. The uniformity coefficient and coefficient of
gradation of each sample tested is individually calculated after the derivation of
D10, D30and D60. After calculating the coefficients of the sand, with an average CU
value of about 2 and CCvalue of just under 1 (0.98), and comparing to the typical
poorly and/or even graded soil, and also classifying as sand through British
Standards. As explained later on, the compaction results of sand, S1, S2 and S3
also do match the typical values presented earlier.
5.2. Fly ash
The FA used in this study was obtained from a UK power station,
Ratcliffe-on-Soar power station in Nottingham. Ratcliffe-on-Ratcliffe-on-Soar is known as one of the most
efficient coal-fired power stations in the UK. Ratcliffe-on-Soar power station uses
coal as fuel. Upon collection from the power plant, the fly ash was sealed in plastic
tubs of 25 kgs and was brought to the University of West London's laboratory. The
physical and chemical analyses of the fly ash used arose typical values for class F
fly ash, as according to ASTM, they should contain at least 70% by weight of
Silicon (SiO2) + Aluminium (Al2O3) + Iron (Fe2O3) (ASTM 2003, cited by
Kelly, 2015). The fly ash obtained from Ratcliffe power station contains nearly
75% by weight of SiO2 + Al2O3 + Fe2O3. This classifies the FA in this research
as Class F.
The fly ash, as it was supplied, had rather large particles, in order to produce more
homogeneous samples, the FA was oven dried and then sieved through a 2.36 mm
sieve. After testing over 30 samples from different tubs, on average about 21% of
the FA was greater than 2.36 mm.
For comparison, the PSD for the fly ash was performed without coarse content (W)
and with (WC). The five (W) samples shown inFig. 7, were highly similar, except
[(Fig._6)TD$FIG]
where two samples, 1 and 2, which had an about half of the accumulative weight
passed in comparison to samples 3, 4 and 5. This variation also occurred when
testing FA with coarse content. In these cases, the largest portion of the material
was retained on 0.075 mm sieve, where in other cases, the highest portion had
passed through the smallest sieve (0.063). It seems FA to be having grain size of
similar to that of silt.
5.3. Cement
Ordinary portland cement (OPC) is most commonly used to stabilize soils. On the
contrary, rapid-hardening cement is generally avoided, as they do not allow the
time required for mixing and compacting in the cement stabilization process
(O'Flaherty and Hughes, 2016). The cement chosen for this study is OPC, provided
by a UK supplier. The manufacturer provided the following conditions:
•Based on sustainable cement technology.
•Grey in colour.
•Consistent strength meeting all the conformity criteria in BS EN 197-1.
•Manufactured from natural products.
6. Results and discussion
The results of compaction tests (standard proctor) performed with different FA and
cement contents are presented in this section and discussed further. Fig. 8
illustrates how the FA content in the stabilized samples affects the maximum dry
density. Despite constituting only 3% of the sample (in weigh), the OPC used in
this experiment had a profound influence on the dry density.
[(Fig._7)TD$FIG]
Meanwhile, Fig. 9 presents an increase in the optimum moisture content of the
stabilized samples as the FA content raises. It should be noted that the addition of
cement only decreased the OMC, and this is believed to be down due to the excess
heat generated by the cement during the activation process. As suggested earlier in
the literature, byMakusa (2012), and the observation ofTable 1, it was anticipated
for the OMC to be increased and the MDD to be decreased with as the FA content
rises. Figs.9and10 illustrate that this has also occurred to the fine sand used in
this research. The decline in MDD is associated with the fact that FA is lightweight
compared to sand only, while the increase in OMC is attributed to the extra water
required for hydration. Comparing the 3% and 5% cement content samples
together, in both Figs.9and10, it clearly can be seen that both lines are producing
the same behaviour in regards to an overall MDD reduction and an overall higher
OMC. It is evident that samples with FA contents of 10% and over are producing
the results, which were anticipated earlier in the literature for other materials.
Fig. 8, illustrates that with the addition of 20% FA (S-5C-20FA) a lower MDD in
comparison to that of only sand has been achieved with nearly over 1.5% higher
[(Fig._8)TD$FIG]
Fig. 8.Behaviour of MDD in relevance to FA content (results for 5% of cement: afterWood, 2016).
[(Fig._9)TD$FIG]
OMC (Fig. 9). Both the MDD as well as the OMC show significant dependence
upon the FA content.
In total, there were 120 individual compactions performed, of which the results are
tabulated inTable 2and illustrated on a compaction graph inFig. 10, which clearly
shows a shift to the bottom right of the compaction curves as the FA content
increases, in other words, the optimum moisture content and the maximum dry
density of a given sample is directly dependent on the FA content. It can be seen
that the OMC from 10% to 15% FA did not change as much as it did from 5% to
10% FA. It is unclear at the moment why that is. The addition of cement
(S-3C-0FA) into soil had a major effect on the compaction properties of the soil, with
MDD increasing by over 0.5 kN/m3and the OMC dramatically reduced by nearly
1%. It is only with the addition of FA that the OMC begins to be increased and
simultaneously the MDD being decreased. The sample S-3C-15FA has an OMC of
approximately 14.4%, over 1% increase to just sand samples, while the MDD is
[(Fig._10)TD$FIG]
Fig. 10. Compaction results of 5%, 10% and 15% FA Stabilized Sand.
Table 2. Average OMC and MDD results of various samples.
Code OMC (%) MDD (kN/m3)
Sand S-0C-0FA 13.4 17.08
Sand + 3% Cement S-3C-0FA 12.5 17.62
Sand + 3% Cement + 5% FA S-3C-5FA 12.4 17.77
Sand + 3% Cement + 10% FA S-3C-10FA 14.2 17.43
Sand + 3% Cement + 15% FA S-3C-15FA 14.35 17.18
Sand + 5% Cement + 5% FA S-5C-5FA 11.57 17.91
Sand + 5% Cement + 10% FA S-5C-10FA 13.70 17.65
Sand + 5% Cement + 20% FA S-5C-20FA 14.98 17.01
still larger than sand alone. Despite this, it can clearly be seen that with the further
addition of FA, lower MDD and higher OMC will attainable. Observing the results
of Table 2, samples compacted with 5% cement content illustrate the influence
cement makes in soil stabilization.
In summary: the laboratory tests performed in this research revealed that the use of
FA and cement resulted in MDD reduction and an increase in OMC. This effect
only occurs when FA content in considerably higher than the cement content. The
results of the study show that the influence of cement is rather significant.
Comparing samples of same FA percentage (5FA with S-5C-5FA &
S-3C-10FA with S-5C-S-3C-10FA), it clearly can be seen that cement has caused a reduction
in OMC and a higher MDD. Since cement is only used in this research as an
activator and not a stabilizer, its content should be kept at its lowest.
Furthermore, the best results were obtained at 20% FA, with 5% cement, with
OMC of about 15%, an increase of 1.6% from sand-only, and MDD of 17.01 kN/
m3from 17.08 kN/m3. Note that if the 20FA was to be compared to
S-5C-5FA, rather than to sand-only, the OMC was increased by 3.4%, while MDD was
lowered from 17.91 kN/m3, a reduction of 0.86 kN/m3.
Based on the results of this experimental research, it appears that FA-sandy soil
mixtures can be suitable for sustainable embankment construction. Although based
on the carried out tests it is not possible to precisely evaluate the effect of the FA and
cement contents on the strength and bearing capacity of the treated soil, this could be
considered as a preliminary research, from which first estimations on both
magnitudes (for example, UCS and CBR) can be derived by means of empirical
correlations, as inPatel and Patel (2013). It is necessary to make further tests, like
CBR and determination of Resilient Modulus, so that FA utilization in soil
stabilization for geotechnical and geoenvironmental infrastructure can be improved.
7. Conclusions
Coal-fired power plants have high importance in the world's energy demands.
Being the source of nearly a quarter of the world's primary energy need, it can be
assured that the production of any by-product, specifically FA, will continue for
the foreseeable future. Innovative technologies will provide increased utilization of
wastes, and recycled materials with larger volumes causing a decrease in the
demand for natural mineral resources. Even simple technologies may increase the
added value of recycled or waste materials producing superior engineering
behaviour. At the same time, the need for disposal of large volumes of waste
material will be minimized. The key findings based on the literature review are:
•Fine fly ash produces better strength than the respective activated coarse fly ash.
•The mechanical strength achieved by cement-based binders was higher and of a better consistency.
•Class F had about three times the strength gain, compared to the samples
stabilized with class C.
Followed by the outcomes of the results obtained during this study:
•Despite constituting only 3% of the sample (in weigh), the OPC used in this
experiment had a profound influence on the dry density.
•The addition of FA resulted in MDD reduction, believed to be caused by FA
being lightweight in comparison to sand only.
•The addition of FA also increased the OMC, which is attributed to the extra
water required for hydration.
•Samples with FA contents of 10% and over produced resutls in consistance of
the literature, higher OMC and lower MDD.
•Further research needs to be carried out on sand, clayey sand in particular, and
also on high plasticity silts.
Fly ash can be considered as a valuable resource and needs to be studied, to
facilitate the application of fly ash in new and innovative areas of economic
interest as the use of fly ash is not only environmental friendly but also
cost-effective. It should be pointed out that both the nature of the FA and the type of soil
significantly influence the results of stabilization and it is very challenging and
unsafe to rely on research carried out with different soils and different FA
quantities. Furthermore, currently, there are limited data in the literature reporting
the long-term performance of soil stabilization. Also, as still a significant amount
of the FA produced around the world is disposed of, and with utilization rates in
soil stabilization, ground improvement and sub-base construction being one of the
lowest applications, about 7% in the U.S and 1% in the UK, a further detailed study
is considered necessary to increase both awareness and the utilization rate of FA
within the industry.
More research should also be conducted in the near future to evaluate the effects of
FA on the soil strength of treated sands.
Declarations
Author contribution statement
Siavash Mahvash: Conceived and designed the experiments; Performed the
experiments; Analyzed and interpreted the data; Contributed reagents, materials,
Susana Lopez-Querol: Conceived and designed the experiments; Analyzed and
interpreted the data; Contributed reagents, materials, analysis tools or data; Wrote
the paper.
Ali Bahadori-Jahromi: Conceived and designed the experiments; Contributed
reagents, materials, analysis tools or data; Wrote the paper.
Funding statement
This research did not receive any specific grant from funding agencies in the
public, commercial, or not-for-profit sectors.
Competing interest statement
The authors declare no conflict of interest.
Additional information
No additional information is available for this paper.
References
Abmaruzzaman, M., 2010. A review on the utilisation of fly ash. Prog. Energy
Combust. Sci. 36 (3), 327–363.
ACAA, 2014. Beneficial Use Of Coal Combustion Products: An American
Recycling Success Story. (Accessed: 20 September 2016)https://www.acaa-usa.
org/Portals/9/Files/PDFs/2014ReportFinal.pdf.
Arioz, E., Arioz, O., Kockar, O., 2013. Mechanical and Microstructural Properties
of Fly Ash Based Geopolymers. Int. J. Chem. Eng. Appl. 4 (6), 397–400.
Aydilek, A.H., Arora, S., 2005. Class F Fly ash amended soils as highway base
materials. ACSE: J. Mater. Civ. Eng. 17 (6), 640–649.
Barnes, D.I., Sear, L.K.A., 2006. Ash Utilisation from coal-based power plants.
United Kingdom quality ash association.
Baykal, G., Edincliler, A., Saygili, A., 2004. Highway embankment construction
using fly ash in cold regions. Resour. Conserv. Recycl. 42, 209–222.
Beeghly, J.H., 2003. Recent Experiences with Lime–Fly Ash Stabilization of
Pavement Subgrade Soils, Base, and Recycled Asphalt. International Ash
Utilization Symposium, Center for Applied Energy Research, University of
Bergado, D., Andersln, L., Miura, N., Balasubramaniam, A., 1996. Soft ground
improvement: in lowland and other environment. American Society of Civil
Engineers, New York.
BSI, 1990a. BS1377-1: Methods of Test for Soils for civil engineering purposes:
General requirements and sample preparation. British Standards Institution,
London.
BSI, 1990b. BS1377-2: Methods of Test for Soils for civil engineering purposes:
Classification tests. British Standards Institution, London.
BSI, 1990c. BS1377-4: Methods of Test for Soils for civil engineering purposes:
Compaction-related tests. London, British Standards Institution.
Bumjoo, K., Prezzi, M., Salgado, R., 2005. Geotechnical Properties of Fly and
Bottom Ash Mixtures for Use in Highway Embankments. ASCE: J. Geotech.
Geoenviron. 137 (7), 914–924.
Carroll, R.A., 2015. Coal Combustion Products in the United Kingdom and the
Potential of Stockpile Ash. World of Coal Ash, Tennessee, USA. 5/7 May 2015.
Celauro, B., Bevilacqua, A., Lo Bosco, D., Celauro, C., 2012. Design Procedures
for Soil-Lime Stabilization for Road and Railway Embankments. Part 1-Review of
Design Methods. Procedia Soc. Behav. Sci. 53, 754–763.
Cetin, B., Aydilek, A.H., 2013. pH and fly ash type effect on trace metal leaching
from embankment soils. Resour. Conserv. Recycl. 80, 107–117.
Cofra, 2005. Ground Improvement, MebraDrain, BeauDrain and AuGeo [Online].
[Accessed: 10 Mar 2016]http://www.cofra.co.uk/brochures/PVDUK.pdf.
Cristelo, N., Glendinning, S., Pinto, A.T., 2011. Deep soft soil improvement by
alkaline activation. ICE: Ground Improvement 164 (G12), 73–82.
Cristelo, N., Glendinning, S., Fernandes, L., Pinto, A.T., 2012a. Effect of calcium
content on soil stabilisation with alkaline activation. Constr. Build. Mater. 29,
167–174.
Cristelo, N., Glendinning, S., Miranda, T., Oliveria, D., Silva, R., 2012b. Soil
stabilisation using alkaline activation of fly ash for self compacting rammer earth
construction. Constr. Build. Mater. 36, 727–735.
Cristelo, N., Glendinning, S., Fernandes, L., Pinto, A.T., 2013. Effects of
alkaline-activated fly ash and Portland cement on soft soil stabilisation. Acta Geotech. 8 (4),
395–405.
Das, S.K., Yudhbir, 2005. Geotechnical Characterization of Some Indian Fly
Ashes. ASCE: J. Mater. Civil Eng. 17 (5), 544–552.
Dockter, B.A., Eylands, K.E., Hamre, L.L., 1999. Use of Bottom Ash and Fly Ash
in Rammed-Earth Construction. International Ash Utilization Symposium. Center
for Applied Energy Research, University of Kentucky.
Eijk, R.J.V., Winkel, H.T., Stam, A.F., 2011. Transforming Bottom Ash Into Fly
Ash. World of Coal Ash, Colorado, USA.. 9/12 May 2011.
Essler, R., 2012. Design principles for ground improvement. In: Burland, J.,
Chapman, T., Skinner, H., Brown, M. (Eds.), ICE manual of geotechnical
engineering: Volume II geotechnical design, construction and verification. ICE
Publishing, London.
Fauzi, A., Nazmi, W.M., Fauzi, U.J., 2010. Subgrade stabilization of Kuantan Clay
using Fly Ash and bottom ash. The 8th international conference on geotechnical
and transportation engineering.
Hossain, K., 2010. Development of stabilised soils for construction application.
ICE: Ground Improvement 163 (G13), 173–185.
Jackson, N.M., Mack, R., Schultz, S., Malek, M., 2007. Pavement Subgrade
Stabilization and Construction Using Bed and Fly Ash. World of Coal Ash,
Kentucky, USA.. 7/10 May 2007.
Kamon, M., Katsumi, T., Sano, Y., 2000. MSW fly ash stabilized with coal ash for
geotechnical application. J. Hazard. Mater. 76 (2–3), 265–283.
Kaniraj, S., Havanagi, V., 1999. Compressive strength of cement stabilized fly
ash-soil mixtures. Cement Concrete Res. 29, 673–677.
Kelly, R.P., 2015. Parallel and nonconformities in worldwide Fly Ash
classifica-tion: The need for a robust, universal classification system for fly ash. World of
Coal Ash, WOCA conference, 5/7 May 2015, Tennessee, USA.
Kolias, S., Kasselouri-Rigopoulou, V., Karahalios, A., 2005. Stabilisation of clayey
soils with high calcium fly ash cement. Cement Concrete Comp. 27 (2), 301–313.
Little, N.D., Nair, S., 2009. Recommended Practice for stabilization of subgrade
soils and base materials. National Cooperative Highway Research Program. Texas
Transportation Institute, A&M University, Texas.
Mackiewicz, S.M., Ferguson, E.G., 2005. Stabilizing of Soil with Self-Cementing
Coal Ashes. World of Coal Ash, Kentucky, USA.. 11/15 April 2005.
Makusa, G.P., 2012. Soil stabilization methods and materials. Lulea University of
McCarthy, M.J., Csetenyi, J.L., Jones, M.R., Sachdeva, A., 2011. Clay-Lime
stabilization: Characterizing fly ash effects in minimizing the risk of sulphate
heave. World of Coal Ash, WOCA Conference, 9-12th May 2011, Denver.
O'Flaherty, C., Hughes, D., 2016. Highways: The location, design, construction
and maintenance of road pavements, fifth ed. ICE Publishing, London.
Palomo, A., Grutzeck, M.W., Blanco, M.T., 1999. Alkali-Activated fly ashes, A
cement for the future. Cement Concrete Res. 29, 1323–1329.
Pandey, V.C., Singh, N., 2010. Impact of fly ash incorporation in soil systems.
Agr. Ecosyst. Environ., 16–27.
Patel, M.A., Patel, H.S., 2013. Laboratory assessment to correlate strength
parameter from physical properties of subgrade. Procedia Engineering 51,
200–209.
Prabakar, J., Dendorkar, N., Morchhale, R.K., 2004. Influence of fly ash on
strength behaviour of typical soils. Constr. Build. Mater. 18, 263–276.
Reyes, A., Pando, M., 2007. Evaluation of CFBC fly ash for improvement of soft
clays. World of Coal Ash, Kentucky, USA 7/10 May 2007.
Sahu, B.K., 2001. Improvement in California bearing ratio of various soils in
Botswana by fly ash. International Ash Utilization Symposium, University of
Kentucky, USA.
Santos, F., Li, L., Li, Y., Amini, F., 2011. Geotechnical Properties of Fly Ash and
soil mixtures for use in highway embankments. World of Coal Ash, Denver, USA
9/12 May 2011.
Sato, A., Nishimoto, S., 2005. Effective Reuse of Coal Ash as Civil Engineering
Material. World of Coal Ash, Kentucky, USA 11/15 April 2005.
Senol, A., Edil, T.B., Bin-Shafique, M.S., Acosta, H., Benson, C.H., 2006. Soft
subgrades stabilization by using various fly ashes. Resour. Conserv. Recy. 46 (4),
365–376.
UKQAA, 2016. UKQAA Ash Availability ReportUnited Kingdom quality ash
association. (Accessed: 05 April 2016) http://www.ukqaa.org.uk/wp-content/
uploads/2016/01/UKQAA-Ash-Availability-Report-Jan-2016.pdf.
Wood, J., 2016. The Utilisation of Class F Fly Ash for Ground Improvement of
Sand. University of West London Final Year Project-BEng in Civil Engineering.
Zaliha, S.Z.S., Kamarudin, H., Al Bakri, A.M., Binhussain, M., Salwa, M.S.S.,
2013. Review on Soil Stabilization Techniques. Australian Journal of Basic and