Internet Multimedia Traffic Classification from QoS
Perspective Using Semi-supervised Dictionary
Learning Models
Zai-jian Wang
∗, Yu-ning Dong,
Member, IEEE
, Shiwen Mao,
Senior Member, IEEE
,
Xinheng Wang,
Senior Member, IEEE
* The corresponding author, email: [email protected]
Abstract—To address the issue of fine-grained classification of Internet multimedia traffic from a Quality of Service (QoS) perspective with a suitable granularity, this paper defines a new set of QoS classes and presents a modified K-Singular Value Decomposition (K-SVD) method for multimedia identification. After analyzing several instances of typical Internet multimedia traffic captured in a campus network, this paper defines a new set of QoS classes according to the difference in down-stream/upstream rates and proposes a modified K-SVD method that can automatically search for underlying structural patterns in the QoS characteristic space. We define bag-QoS-words as the set of specific QoS local patterns, which can be expressed by core QoS characteristics. After the dictionary is constructed with an excess quantity of bag-QoS-words, Locality Constrained Feature Coding (LCFC) features of QoS classes are extracted. By associating a set of characteristics with a percentage of error, an objective function is formulated. In accordance with the modified K-SVD, Internet multimedia traffic can be classified into a corresponding QoS class with a linear Support Vector Machines (SVM) classifier. Our experimental results demonstrate the feasibility of the proposed classification method.
Index Terms—Dictionary learning, traffic classication, multi-media traffic, K-singular value decomposition, Quality of Service.
I. INTRODUCTION
With the development of various Internet multimedia ap-plications, cross-layer optimization of network resource al-location for enhanced user experiences has attracted con-siderable interests in the research community [1]–[8]. On the other hand, Internet Service Providers (ISPs) need to consider different Quality-of-Service (QoS) requirements for data, voice and video applications because users need better, more personalized services. However, due to the heterogeneity
Z. Wang is with the College of Physics and Electronic Information, Anhui Normal University, Wuhu, 241000 China. Y. Dong is with the College of Communications and Information Engineering, Nanjing University of Posts and Telecommunications, Nanjing, 210003 China. S. Mao is with the Depart-ment of Electrical and Computer Engineering, Auburn University, Auburn, AL 36849-5201 USA. X. Wang is with the School of Computing, University of the West of Scotland, Paisley, PA1 2BE, UK. Email: [email protected], [email protected], [email protected], [email protected].
This work was supported in part by the National Natural Science Foundation of China (NO. 61401004, 61271233, 60972038), Plan of introduction and cultivation of university leading talents in Anhui (No.gxfxZD2016013), the Natural Science Foundation of the Higher Education Institutions of Anhui Province, China (No. KJ2010B357), Startup Project of Anhui Normal Uni-versity Doctor Scientific Research (No.2016XJJ129), the US National Science Foundation under grants CNS-1702957 and ACI-1642133, and the Wireless Engineering Research and Education Center at Auburn University.
of the definition of QoS/service classes with different levels of granularity for various types of multimedia traffic, ISPs still have difficulties guaranteeing the end-to-end QoS of multimedia services by allocating proper network resources, especially when they target high-bandwidth applications such as video streaming [9]–[12]. Granularity, in particular, should not be used when classifying, existing types of the multimedia traffic with new types of multimedia traffic.
For example, video traffic can be further classified as Peer-to-Peer (P2P)-based or non-P2P-based, each with different dynamic characteristics. To efficiently utilize limited network resources, it is important to classify Internet multimedia traffic using a finer granularity, so that Internet multime-dia services can be improved with better end-to-end QoS guarantee by ISPs. In order to effectively provide end-to-end QoS in heterogeneous networks, authors in [12] emplyed an Application Service Map (ASM) to classify traffic, while traffic was divided into eight Unified Communication (UC) classes in [13]. In addition, online allocation of communication and computation resources for different real-time multimedia services was considered in [14] to provide an optimal service to users.
In order to offer uninterrupted services when using a mobile Internet, a Flow Aggregation (FAg) concept was proposed in our previous work [15], which involved aggregating traffic flows with similar QoS requirements into a FAg. We show that the FAg may act as a bridge to help different network/QoS domains along the transmission path understand/translate QoS requirements with a unified view. However, how to utilize the FAg in an effective way is still an unresolved issue. In this paper we try to tackle this problem by using an appropriate, differentiating granularity of multimedia services from a QoS perspective to achieve the FAg objective.
the QoS domain.
In this paper, we define seven QoS categories with newly discovered features and propose a characteristic-based method which will classify Internet multimedia traffic by utilizing a modified K-Singular Value Decomposition (K-SVD) method. The K-SVD will learn the dictionary so that it can classify various Internet multimedia traffic with appropriate differ-entiating granularity of multimedia services by considering QoS requirements. By analyzing multimedia flows in a large-scale, real world network, we find that the new QoS-related features correlate with the bidirectional rates of different streams of Internet multimedia traffic. After investigating the sparse nature of the QoS of multimedia streams, we extract the training dictionary from training samples, utilize a modified K-SVD to learn the dictionary, and propose a characteristic-based method to classify multimedia traffic. Specifically, our main contributions in this paper are summarized as follows:
1) by extensive statistical analysis of traffic flow data collected from a real world network, we find that down-stream/upstream rates are suitable for differentiating Internet multimedia traffic (e.g., video and game traffic) from a QoS perspective;
2) based on the sparse property of the QoS characteristics, we show that the current types of Internet multimedia traffic (e.g., video and game traffic) can be classified into seven QoS based FAg (QFAg) categories;
3) we propose a modified, K-SVD-based Internet multime-dia traffic classification framework based on the concept of QFAg, which improves the classification performance significantly by employing a unified objective function incorporated with QoS features, for which the K-SVD algorithm can be utilized to efficiently solve the classi-fication problem.
The remainder of this paper is organized as follows. Sec-tion II presents related work in the literature. SecSec-tion III introduces the setup of our data collection from a real world network and presents the dataset. Section IV analyzes the related typical QoS characteristics, selects new QoS charac-teristics for differentiating Internet multimedia traffic streams, and presents the definition of the QoS class for Internet multimedia traffic. Section V develops a QoS class recognition framework based on modified K-SVD for Internet multimedia traffic and Section VI analyzes its complexity. Experimental results are given in Section VII, and Section VIII concludes the paper.
II. RELATEDWORK
The International Telecommunication Union (ITU), the In-ternet Engineering Task Force (IETF), and some other standard organizations, as well as network providers have stipulated a large number of typical QoS characteristics of Internet multimedia traffic [11]. For example, ITU-T Recommendation G.1010 primarily adopts error tolerance, delay and jitter, and packet loss as QoS criteria. IETF uses bandwidth, delay and jitter, and packet loss to classify services into IntServ and DiffServ models. The Third Generation Partnership Project (3GPP) defines four QoS classes based on delay. IEEE 802.11e
selects a maximum contention window, a minimum contention window, and an arbitration inter-frame space to classify the traffic classes. IEEE 802.16m adopts maximum sustained rate, maximum latency tolerance, jitter tolerance, etc. The classifications using these models are not ideal for existing networks. In particular, the online game traffic with various genres currently occupies the majority of network resources, especially in Asian countries. However, little research has been done using current QoS models for online games.
Typical classification methods utilize different features to construct classifiers for differentiating the specific types of traffic or protocols. These features include protocol, port, pay-load, packet/flow size, flow duration, Inter-Arrival Time (IAT), delay, jitter, and packet loss [18]. These characteristics are not suitable for effectively creating the QoS classes because they cannot reflect the differences within the QoS classes. For example, packet size, frequently described in the literature, is an important characteristic, but cannot be used to make a distinction between Closed Circuit Television (CCTV1) web video and BitTorrent2 video. Similarly, IAT also needs to be further processed before it can be applied to differentiate traffic types [19].
To contrast Skype3 with IPTV4, authors in [20]. studied the corresponding statistical characteristics of IAT and packet size by using an interactive mode and packet properties. Researchers in [21] showed that IAT and packet size may affect jitter, packet loss, and bandwidth. IAT, packet loss and jitter for Skype in UMTS were analyzed in [22]. The results indicated that QoS characteristics have different distributions in different flow directions. Researchers in [23] indicated that, in online gaming, there were obvious differences between downstream and upstream video traffic. However, related works only provided a simple comparison as opposed to QoS classification. Researchers in [24] proposed a flow aggregation method, which can effectively reduce the number of flows. Further research in [25] indicated that statistical characteristics of flow aggregation can be used to identify related traffic streams. Researchers in [26] tried to aggregate flows at the host/port level, but no implementation details were given. Reference [27] showed that flow could be aggregated based on some common characteristics to reduce the network operating costs.
Different from our works, the authors in [36] considered different classes of video flows, but focused on scheduling exe-cution time in Wireless Multimedia Sensor Network(WMSN). The authors in [37] focused on flow control to balance delivery fairness and efficiency over Heterogeneous Wireless Networks (HWNs). The authors in [38] presented an online unsupervised learning classification of pedestrians and vehicles for video surveillance, but not Internet multimedia. They extracted the moving objects with their features from the original video, but not QoS characteristics. The authors in [39] detailed a novel approach to solve the assignment problem of finding optimum thresholds for axle-based vehicle classifiers. The
authors in [40] proposed a bilevel feature extraction-based text mining that integrates features extracted at both syntax and semantic levels with the aim to improve the fault classification performance.
Traffic identification is an automatic classification process, and many methods have achieved good results as for exam-ple, K-SVD, Hidden Markov Model (HMM) [28], Support Vector Machine (SVM) [29], and Bayesian network based classification methods [30]. K-SVD, especially, has advantages over other algorithms in convergence rate and adaptability to complex data structure [31]. Based on the existing research work on SVD [31], this paper proposes a modified K-SVD algorithm for Internet multimedia traffic QoS class recognition. The proposed algorithm utilizes sparse coding to learn the dictionary, reduces the dimension of characteristics, and improve the accuracy of recognition.
III. DATASETPREPARATION
Since there are no suitable datasets available in which the multimedia traffic is classified into different categories according to QoS related characteristics, we capture the typical Internet multimedia traffic from a campus network to build a basic dataset with Wireshark [32]. After processing the raw data, the following statistical characteristics were obtained:
1) average upstream rate (Mbps): the amount of data per second sent to a server by clients; and
2) average downstream rate (Mbps): the amount of data per second sent to clients from the server.
We analyze the statistical characteristics of different types of Internet multimedia traffic. With the appropriate combination of QoS characteristics, we aim to differentiate Internet multi-media traffic flows with a natural granularity.
The datasets are collected from 25 kinds of multimedia traffic flows, each being 30 minutes long, on a machine with an AMD 2.10 GHz AthlonTM X2 DualCore QL-64 processor during day/night time in Spring 2014. We ran these traffic streams at the hosts several times and collected the traffic flows. When one of these is running, other applications are stopped. Each application flow is identified by a five-tuple: (source/destination IP address, source/destination port, and protocol). If their duration is longer than 0.1 second, they are marked as sub-flows (Usually one traffic flow has many sub-flows). Control packets were dropped from the raw data, leaving only the raw data to be analyzed. The types of multimedia traffic flows are summarized in Table I.5
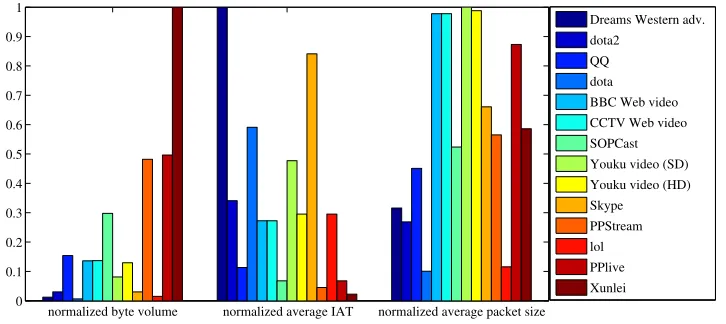
In order to construct a clear display, we select data of 14 types of video and gaming traffic, and compute the correspond-ing normalized byte volume, the normalized average IAT, and the normalized average packet size. The results are shown in Fig. 1. By analyzing the QoS characteristics of the dataset, we find that:
5http://www.icq.com; http://www.QQ.com; http://cn.msn.com/; http://dota. uuu9.com/; http://www.dota2.com.cn; http://lol.qq.com/; http://xyq.163.com/; http://nz.qq.com/; http://donkey4u.com/; http://www.emule.org.cn/; http:// www.uusee.com/; PPStream is a network television software; http://dl.xunlei. com/; http://www.sopcast.cn; http://tvants.en.softonic.com/; PPLive is a live p2p TV application; http://ppmate.com/.
TABLE I
COMPONENTS OF THE DATASET
Category Typical Multimedia Traffic Data volume (GB)
Real-time ICQ 16.128
interactive QQ 16.128
video MSN 16.128
Online Dota 0.692
gaming Dota2 3.203
Lol 1.592
Dreams Western adventure 1.285 Against War 1.285
Real-time eDonkey 104.48
streaming Emule 104.36
media UUSee 31.2
PPStream 50.49
Tudou video (standard-definition) 8.1327 Youku video (standard-definition) 8.5114 Tudou video (high definition) 13.3597 Youku video (high definition) 13.5831 BBC Web video 14.2819 CCTV Web video 14.3264
Xunlei 104.76
BitTorrent 104.81
SOPCast 31.2
TVAnt 31.2
Skype 3.1914
PPlive 52.02
PPMate 50.49
1) different types of traffic streams are notably different in data volume, e.g., Youku video Standard-Definition video (SD) has a smaller byte volume than Youku High-Definition (HD) video;
2) online games have a smaller byte volume and average packet size;
3) online games generally have larger average IAT since there are a lot of human computer interactions and local operations in online games.
It is necessary to further study QoS characteristics of multi-media traffic for obtaining a more suitable QoS class.
In addition, a lot of QoS related characteristics show locality to corresponding transform domain based on the above analy-sis results and [41]. According to [42], [43], locality can bring sparsity, which inspires that we can utilizes locality to define new QoS categories and sparsity to classify QoS categories for typical multimedia traffics.
IV. SELECTION OFTYPICALQOS RELATED
CHARACTERISTICS ANDCLASSIFICATION OFQOS CATEGORIES
Downstream/upstream rates embody differences of QoS resource requirements of traffic in time, space and direction, for the following reasons.
1) Validity: rate represents the number of bytes per sec-ond, and indicates the relationship between packet/flow size and time. Considering that the majority of traffic flows have direct requests to the bandwidth resources, it seems to be more effective to classify traffic with downstream/upstream rates.
normalized byte volume normalized average IAT normalized average packet size 0
0.1 0.2 0.3 0.4 0.5 0.6 0.7 0.8 0.9 1
Dreams Western adv. dota2
QQ dota BBC Web video CCTV Web video SOPCast Youku video (SD) Youku video (HD) Skype
PPStream lol PPlive Xunlei
Fig. 1. The columnar distribution of 14 types of traffic related characteristics.
Considering that new QoS classes should effectively cover and differentiate the existing QoS classes, we choose downstream/upstream rates to be consistent with most international standards to some extent.
3) Availability: since a typical QoS model provides op-erations of two directions for bandwidth allocation, downstream/upstream rates can be obtained easily. For example, broadcast operates the downstream and the Base Station (BS) controls the upstream by allocating resources to the traffic streams according to their QoS requirements in WiMAX.
4) Robustness: the dynamic network status has an obvious effect on QoS characteristics. Considering that the time intervals between the upstream and downstream data transmissions are very short, downstream/upstream rates seems to be affected by the same set of network factors. The ratio between the downstream/upstream rates seems to be insusceptible to the interference caused by changes in network status.
Therefore, downstream/upstream rates are selected to classify multimedia traffic in this paper since they can be an effective classification feature.
Since the network status is influenced by many known (such as routing and user’s active degree) and unknown factors that affect the related QoS characteristic, traffic acquisition should be carried out in a longer time span. The inherent relationship is quite complex and will be left to our future work.
To obtain good statistical characteristics, our experiments was continued for a period of four months to collect the traffic data. The maximum value of downstream/upstream rates is chosen to normalize all traffic rates. After normalization, the relative value is used to distinguish between different types of traffic. The specific normalization equation is as follows:
ri,u= Ri,u Rmax
, 1≤i≤N (1)
ri,d= Ri,d
Rmax, 1≤i≤N, (2)
where Ri,u denotes the upstream rate of traffic flow i, ri,u is the corresponding normalized rate; Ri,d denotes the downstream rate of traffic flow i, ri,d is the corresponding
normalized rate;N represents the number of traffic flows; and Rmax denotes the maximum value between Rm,u andRm,d, which is defined as
Rmax= max
{m} {Rm,u, Rm,d}, m= 1,2, . . . , N. (3)
In order to understand all the captured traffic streams, we plot the normalized logarithmic value of downstream/upstream rates in Fig. 2. The x-axis is the normalized downstream rate and the y-axis is the normalized upstream rate. For easy reading, Fig. 2 plots one out of every ten points. From Fig. 2, we can compare the distributions of normalized logarithmic value of downstream and upstream rates for all captured traffic. The entire distribution plane can be clearly divided into seven different zones, as shown in Fig. 2.
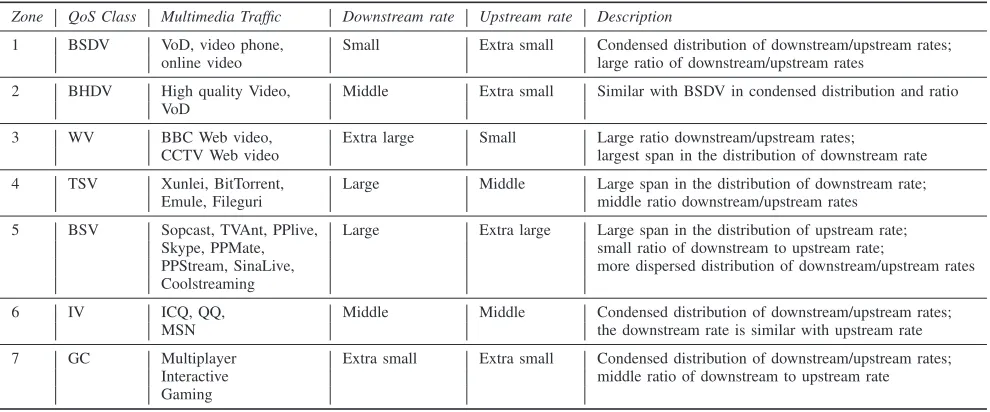
From the distribution of downstream/upstream rates shown in Fig. 2, the traffic flows can be broadly classified into the following seven distinct categories from the QoS level perspec-tive: broadcast standard-definition video (BSDV), broadcast high-definition video (BHDV), web video (WV), trade style video (TSV), barter style video (BSV), interactive video (IV), and game class (GC). The corresponding relationships are shown in Table II. To clearly describe the relationships, we divided the normalized value of downstream/upstream rates into five grades (extra small, small, medium, large, extra large), which are represented by numbers 1, 2, 3, 4, and 5, respectively. A larger number represents a higher grade with more stringent QoS requirements.
BSDV represents live standard-definition video multimedia traffic such as multimedia teleconferencing and video phone traffic. This class can achieve grade 1 for the upstream rate and grade 2 in downstream rate. The distribution of traffic charac-teristics is concentrated, and the amount of data generated is not sizable.
−8 −7 −6 −5 −4 −3 −2 −1 0 1 −9
−8 −7 −6 −5 −4 −3 −2
Normalized Downstream Bandwidth
Normalized Upstream Bandwidth
Zone 1 Zone 2 Zone 3 Zone 4 Zone 5 Zone 6 Zone 7
Fig. 2. The distributions of normalized logarithmic value of downstream/upstream rates (Mbps) for seven QoS categories.
TABLE II
PROPOSED NEW QOS CLASSES
Zone QoS Class Multimedia Traffic Downstream rate Upstream rate Description
1 BSDV VoD, video phone, Small Extra small Condensed distribution of downstream/upstream rates; online video large ratio of downstream/upstream rates
2 BHDV High quality Video, Middle Extra small Similar with BSDV in condensed distribution and ratio VoD
3 WV BBC Web video, Extra large Small Large ratio downstream/upstream rates;
CCTV Web video largest span in the distribution of downstream rate
4 TSV Xunlei, BitTorrent, Large Middle Large span in the distribution of downstream rate; Emule, Fileguri middle ratio downstream/upstream rates
5 BSV Sopcast, TVAnt, PPlive, Large Extra large Large span in the distribution of upstream rate; Skype, PPMate, small ratio of downstream to upstream rate;
PPStream, SinaLive, more dispersed distribution of downstream/upstream rates Coolstreaming
6 IV ICQ, QQ, Middle Middle Condensed distribution of downstream/upstream rates; MSN the downstream rate is similar with upstream rate
7 GC Multiplayer Extra small Extra small Condensed distribution of downstream/upstream rates; Interactive middle ratio of downstream to upstream rate Gaming
in the upstream rate since they adopt the same transmission mode.
WV is designated for web video traffic using the HTTP protocol, in which the HTTP server delivers the web objects embedded in the web page. For this class, the downstream rate is larger than the upstream rate since the video traffic embed-ded in HTTP has very few instructions to be transmitted in upstream direction. WV has similar downstream and upstream rates for different traffic flows since it maintains a stable rate and period of transmission.
TSV is ideal for traffic with the hybrid P2P model, which often perform near-optimally in terms of uplink bandwidth utilization, and download time except under certain extreme conditions. The traffic often generates a significant amount of upload traffic and presents high packet length values. The Hy-brid P2P model is currently one of the most common models for streaming video on the Internet, by which traffic is usually started by enabling multiple concurrent TCP connections, and the data is transmitted bidirectionally from multiple P2P nodes at the same time. Multiple tasks performed simultaneously
generally have a longer concurrent transmission time. Peers not only download content from the server but also serve it to other peers. Peers often can download more than they upload to the network when high bandwidth peers are present. This class is not sensitive to delay and bandwidth, and the upstream rate can be classified as grade 2 and the downstream rate as grade 4.
BSV is designated to traffic with typical P2P live traffic characteristics. In the traffic streams, there are more nodes available to obtain data from other nodes and provide data to other nodes. Since this class can preserve user satisfaction by using an adaptive multi-rate to guarantee QoS requirements, this class has a larger span than TSV in the distribution of the upstream rate, making the downstream rate far smaller than the upstream rate. The distribution of downstream and upstream rates is more dispersed since longer traffic delay and jitter can be tolerated. BSV can be classified as having a grade 5 in upstream rate and grade 4 downstream rate.
as ICQ, QQ and MSN. IV has a very condensed distribution of downstream and upstream rates, and the downstream rate is similar to the upstream rate. The traffic belonging to this class has little data fluctuation and bidirectional symmetrical data transmission. GC is designated for game data transmission including animation and real-time voice or video delivery to the players with very high fidelity. The traffic belonging to this class is different from other live traffic, and may adopt the Client/Server (C/S) or hybrid P2P mode. They generally have much smaller packet size and shorter inter-arrival time. This class needs more stringent QoS requirements regarding interactive action. Because they often have stored a lot of data when traffic software is installed, most of the data transmitted between server and client is instruction data with smaller packet size during playing, which results in the smallest values of data rate.
GC has the smallest values of downstream and upstream rates among the seven categories, since only a small amount of game data is sent to the client by the server that performs heavy-weight computations, and only the player’s actions are sent to the server by the client.
In typical QoS models, video traffic flows are usually placed into one category without considering that video traffic flows with different transmission modes (P2P, HTTP, C/S, and Broadcast) have obvious difference in QoS requirements. Moreover, video traffic with the same transmission mode and content also have different QoS requirements due to differ-ent display standards. Utilizing a distinct QoS classification scheme, this paper evaluates the above traffic characteristics in a new QoS classification framework. We are not simply creating QoS classes according to traffic types, but are refining existing QoS classification based on the actual distribution of characteristics in downstream and upstream rates of multime-dia traffic. The newly proposed QoS class is more convenient for network resource management. For example, an Internet Service Provider (ISP) can allocate corresponding bandwidth resources for one kind of data flow according to their common QoS requirements.
V. QOS CLASSCLASSIFICATIONFRAMEWORK BASED ON
MODIFIEDK-SVD
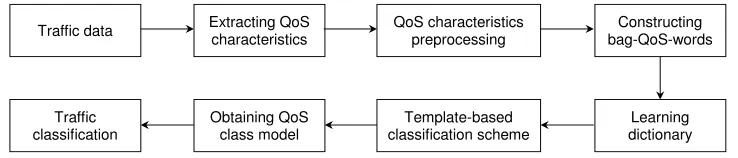
The proposed framework in this paper is illustrated in Fig. 3. In Fig. 3, QoS characteristics are extracted from traffic data. Since QoS characteristics have various parameter types, they need be preprocessed. After preprocessing, the core QoS characteristics of Internet multimedia traffic are obtained and mapped into QoS-Word, which denotes the specific QoS local pattern. According to the Bag-of-Words (BoW) model [17], bag-QoS-words, which employ a vector consisting of the weighted counts are constructed. Internet multimedia traffic can be described by a dictionary (codebook) constructed with bag-QoS-words.
Since K-SVD does not consider characteristic differences of data structures, the over-complete dictionary, trained by K-SVD, cannot provide detailed characteristics of data struc-tures. By introducing a characteristics-set from a training sample, a modified K-SVD is employed to efficiently learn the
over-completed dictionary constructed with bag-QoS-words. Through combining given probe traffic flows, QoS class sification models are obtained with a characteristic-based clas-sification scheme. Multimedia traffic flows can be classified into a corresponding QoS category/class with a linear SVM classifier. The proposed method can address the problems that challenged many traditional methods of improving QoS requirements.
A. QoS Model Parameters of K-SVD Algorithm
Based on [33], we assume that each of the QoS parameters adopts a real number or can be parameterized by a real number. Let X ∈ RM×N denote a set of N column traffic vectors xn ∈ RM, which is the only description of the nth traffic in the M-dimensional real number Euclidian space
RM, and consists of M corresponding QoS parameters. Let D= [d1, . . . , dK],dk∈RM×K, for allk, andK > M, be an over-completed dictionary withK characteristics (atoms) for a sparse representation ofX.
The goal of sparse modeling is to learn a reconstructive dictionaryD by solving the following objective function:
(A, D) = arg min
{A,D}
n
kX−DAk2Fo, s.t. kαnk0≤T0, ∀n,
(4)
where k•kF is a Frobenius norm and A = [α1, . . . , αN] ∈
RK×N is called a sparse coding of X for a fixed D, which can be obtained by employing a K-SVD algorithm.
The K-SVD algorithm directly generalizes the K-means algorithm, which is simple and highly efficient with an ef-fective sparse coding [34]. For reducing the objective values of the Dictionary Learning (DL) problem, K-SVD mainly repeats two steps: (i) sparse representations and (ii) updating the dictionary. Regarding the step of sparse representations, based on the well-defined dictionary, the sparse representations are computed by means of a pursuit method [34]. When updating the dictionary, both atoms and their coefficients are updated simultaneously. The algorithm continuously optimizes the dictionary and sparse coefficient until the termination condition is met.
It is an inherent issue of DL with the K-SVD algorithm to solve the following optimization problem.
min
{D,X}
n
kY −DXk2Fo, s.t. kxik0≤T0, ∀i, (5)
where Y ={yi}N
i=1 denotes a sample set,X ={xi}Ni=1 is a sparse coefficient matrix corresponding to its sample set vector Y, which contains the coefficients of the dictionary with xi being itsith column vector,Dis an over-completed dictionary matrix with dk being its kth column vector, which leads to sparse representations and can be designed by adapting its content to fit a given set of signal examples.T0stands for the sparsity of vector xi, which is the nonzero element bounded in vector xi. k•kF represents the Frobenius norm and k•k0 corresponds to theℓ0 norm.
vv Traffic data Traffic classification Extracting QoS characteristics Obtaining QoS class model QoS characteristics preprocessing Template-based classification scheme Constructing bag-QoS-words Learning dictionary
Fig. 3. The flowchart of the proposed QoS Class classification framework.
as to better fit the data. The update of the dictionary columns is done jointly with an update the sparse representation coef-ficients related to it, resulting in accelerated convergence [44]. By utilizing K-SVD algorithm to find the best dictionary, we can represent the data samples as sparse compositions. According to [44], the K-SVD procedure is given in detail as follows.
Step 0. This step is the initialization phase. Based on analysis results from captured dataset, we choose the classical QoS parameters and their combinations (in-cluding the downstream/upstream rates) with obvious difference degree as elements. After preprocessing the captured dataset (such as normalization), we generate a dictionary D by well-defined and holds it as constant. Meanwhile, we setJ = 1.
Step 1. This is the sparse representation step. K-SVD initializes dictionaryDby a random or well-defined dictionary matrix and holds it as a constant. Accord-ing to predefined dictionary D, K-SVD algorithm calculates sparse representationsxi for each sample vectoryiwith objective function (5) by means of the pursuit method in [34].
Step 2. In this step, we start to update the dictionary. Based on sparse coefficientxi obtained from the previous step, the K-SVD algorithm corrects the dictionary matrix column by column. Assuming to correct atom dk, the K-SVD algorithm isolates it by the following penalty term from the objective function (5).
kY −DXk2F =
Y − K X j=1 djxjT
2 F (6) =
Y −
K
X
j=1,j6=k djxjT
−dkxkT 2 F =
Ek−dkxkT
2 F,
wherexjT stands for thejth row in vectorY, andEk denotes the error caused by thekth atom removed. In order to meet the sparsity constraint by ensuring most of the elements are zeros in the new vectorxk
T, the K-SVD algorithm rectifies matrixEkas follows:
1) Definexk
T(i)as the corresponding vector when sample {yi} is represented by atom dk, and ωk =
i|1≤i≤K, xk
T(i)6= 0 as the index value of non-zero entries in the vector xk
T(i). Assuming that N × |ωk| matrix Ωk has ones
at the(ωk(i), i)th entries and zeros elsewhere, xk
R =xkTΩk andEkR =EkΩk. Eq. (6) can be transformed as follows:
EkΩk−dkxkTΩk
=
EkR−dkxkR
. (7)
2) SVD decomposes matrixER
k asEkR=U∆VT, in order to select both the maximum singular value and its corresponding singular vector for updating atom dk and sparse vector xkR, re-spectively. U is an N unitary matrix and its
1st column is used to updatedk. V is an |ωk| unitary matrix and ∆is a diagonal matrix.xk
R is updated with the1st column ofV multiplied by∆(1,1).
Step 3. Repeat Steps 1 and 2. The iterations will continue until the termination condition is met by a certain threshold or a maximum number of iterations.
B. Dictionary Learning in Modified K-SVD Algorithm
By formulating a new objective function by combining the original objective function and construction error, the problem of sparse representation of QoS classes can be addressed by solving the following new optimization problem for dictionary construction.
(A∗, D) = arg min
{A,D,T}k
X−DAk22+ηkT −DCk 2
2 (8)
relax
≈ arg min
{A∗,D}
kX∗−DA∗k22 (9)
s.t. kα∗nk0≤T, ∀n (10)
X∗= (X,√ηT) (11)
A∗= (A,√ηC), (12)
whereηdenotes the relative weight indicating the contribution between training sample reconstruction and characteristic-set reconstruction, T ∈ RM×L is the characteristic-set for traffic, C ∈ RK×L is the sparse coding of T. Note that the optimization ofmin{A,D,T}kX−DAk22+ηkT−DCk
2 2 in (8) is relaxed to a simpler form (9).
Applying K-SVD to update dk and the kth row in A is represented by ak
T at a time. Assuming that Ek = (X −
P
j6=kdja j T), a˜
j
T and Ek˜ represent the result of discarding the zero entries inajT andEk, respectively,dk and˜akT can be obtained by solving hte following problem:
(dk,˜akT) = arg min
{dk,akT}
Ek˜ −dk˜a
k T 2
After performing SVD for Ek, i.e.,˜ UΣVT = SVD( ˜Ek), we obtain dk and˜ak
T as:
dk=U(:,1) (14)
˜
akT = Σ(1,1)V(:,1). (15)
Lastly, the non-zero values in ak
T are replaced with˜akT. Here, we formulate the problem of classifying the Internet multimedia traffic with QoS features into a unified objective function constructed with the original objective function and reconstruction error. Obviously, it is a typical optimization problem that can be resolved efficiently with the K-SVD algorithm, while the classification performance could be sig-nificantly improved.
C. Locality Constrained Coding of QoS Characteristics
All QoS characteristics in this paper are coded with Locality Constrained Feature Coding (LCFC) based on [31]. The LCFC method needs to satisfy the following constraint:
min
{H}
(
kY −BHk22+γ·
exp
dist(Y, B)
σ
∗H
2
2
)
(16)
s.t. 1Thi=1, ∀i, (17)
where Y is a vector to be encoded, B is a dictionary, H is the coding obtained through LCFC, ∗ denotes the element-wise multiplication, dist(·,·) is the Euclidean distance, and
expdist(Y,B)σ is the weight vector for different codes, which is used to measure the relationship between each element and its corresponding columns in dictionary B.
After obtaining LCFC features by utilizing the dictionary learned by the modified K-SVD dictionary learning method (as described in the last section), the detailed description of characteristic-based classification scheme is given in the following.
Step 1. Selectntraffic flows per class randomly from traffic data for generating a set of characteristic-sets. Step 2. Extract QoS characteristics from traffic data, and
preprocess them, including quantization and normal-ization of parameter values;
Step 3. Calculate the QoS distance between the probe traffic and each of the traffic streams in the characteristic-set with the core function as follows:
Jri
P =K(ri, p) = exp
−kri2σ−2pk
,
ri=classi, i= 1,2, . . . , (18)
whereJri
p is the QoS distance of the probe traffic p and characteristic-set trafficri(riis theith traffic of characteristic-subsetr), andK(ri, p)is Radial Basis Function (RBF).
Step 4. According to (18), we now average row by row for obtaining the final representation of the network traffic for classification to reduce the dimensionality of the QoS distance matrix.
Zpr=mean
(K X
i=1 Jri
p
)
, ri=classi, i= 1,2, . . . .
(19)
TABLE III
AVERAGECOMPUTATIONTIMES
HMM SVM Naive Bayes K-NN Modified-K-SVD
43.1s 85.9s 17.5s 48.4s 671.3s
Step 5. Based on (19), the represented feature is normalized and SVM is selected to classify the traffic.
Zp= Zp
kZpk2
. (20)
VI. COMPLEXITYANALYSIS
To further analyze the efficiency of the proposed modified-K-SVD method, we study the time complexity of the proposed method. As described in Section V, the proposed method is constructed using the K-SVD approach. The dictionary learning problem in the proposed modified-K-SVD is casted as a regularized least-squares problem, where sparsity and reg-ularization terms are used. Following [45]–[48], in the training phase, since updating the coding coefficient for each sample is a traditional sparse coding problem, the corresponding time complexity for each traffic is approximately O(M2Kǫ), where ǫ ≥ 1.2 is a constant, M represents the feature dimensionality of the sample and K denotes the number of dictionary atoms. The time complexity of all N samples is O(N M2Kǫ). The time complexity of updating the dictionary atoms isO(PC
c=1M NǫK), whereC is the number of traffic classes and Nc is the number of training samples of class c. The overall time complexity of the proposed method is O(IN M2Kǫ+PC
c=1IM NǫK), where I is the number of the iterations.
According to [49], the time complexity of the HMM method isO(3QT), whereQis the number of states in the model and T denotes the number of symbols in the observation. Referring to [50], the time complexity of the SVM method is O(N3), whereN is the number of training samples. Referring to [51], the time complexity of the Naive Bayes method is O(N n), where N is the total number of samples andnstands for the number of features selected for the model. Referring to [52], the time complexity of the K-NN method isO(mT L), where mis the number of feature selected from the original feature set,T is the number of samples in the test set, andLdenotes the number of samples in the train.
VII. EXPERIMENTALRESULTS ANDDISCUSSIONS
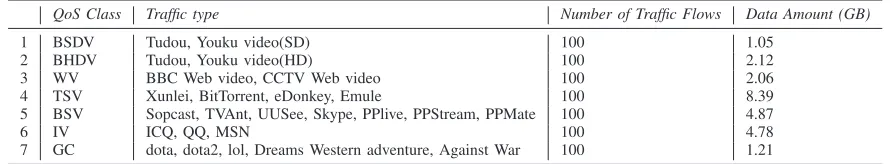
In this section, we focus our experiments on classifying mul-timedia traffic based on QoS characteristics from a QoS class perspective. We generate the datasets by capturing popular In-ternet multimedia traffic from a campus network. The datasets include 26 natural categories of multimedia traffic, which are divided into seven QoS classes as shown in Table IV.
Different from that of the existing works [28]–[30], our novel research issue is to effectively utilize QoS characteristics to classify traffic into the appropriate QoS class. In simu-lations, we process the raw data captured by the Wireshark software tool, while the following characteristics are obtained, including protocol, port, payload, packet/flow size, flow dura-tion, arrival time, IP address, and etc. After analyzing their statistical characteristics including average upstream rate, av-erage downstream rate, byte volume, Inter-arrival Time (IAT), delay, jitter, the different combination of QoS characteristics (such as sub-flows), the different transforms corresponding to characteristics (such as Discrete Fourier Transform ) and etc. We extract QoS characteristics with obvious difference from above characteristics (including down/up-stream rate) and preprocess them including quantization and normalization of parameter value to obtain corresponding parameter values. After the dictionary is constructed with an excess quantity of bag-QoS-words, Locality Constrained Feature Coding (LCFC) features of QoS classes are extracted. Referring to [31], we set the dictionary size to be 100 by using an SVM classifier. We randomly partition the dataset into 50 training traffic flows per class and the rest into testing traffic flows. Then, we evaluate our method according to new QoS classes introduced in Table II.
In order to evaluate the effectiveness of our method, in combination with selected characteristics, we generate a char-acteristics vector to label the original Internet multimedia traffic flow. On a Matlab platform, we compare our method against HMM [28], SVM [29], Naive Bayes and K-Nearest Neighbor (K-NN) [30] in terms of accuracy, precision, Recall, and F1-measure. The results are obtained from 50 runs.
The following performance metrics are used in the experi-mental evaluation.
1) Accuracy (Ac). For the given test datasets, accuracy is determined by finding the ratio of the number of samples correctly classified by the classifier to the total number of samples.
Ac= T PΣ
SU M, (21)
where T PΣ denotes the number of samples correctly classified by the classifier, andSU M represents the total number of samples in the dataset.
2) Precision (P) [35]. It is represented by the formula as follows:
P = T P
T P+F P, (22)
where T P denotes the total number of samples which are distinguished correctly by the classifier and are the correct samples indeed, and F P denotes the total
number of samples which are distinguished correctly by the classifier and are the incorrect samples indeed. 3) Recall (R). It is expressed by the formula as follows:
R= T P
T P +F N, (23)
where F N denotes the total number of samples which are distinguished incorrectly by the classifier and are the correct samples indeed.
4) F1-measure (F1) [35]. It is represented by the formula as follows:
F1= 2×P R
P+R . (24)
The experimental results are presented in Table V. We can see that our method achieves the best performance among all the methods and has higher classification accuracy than the next best result by nearly 3.43%. Since Naive Bayes, HMM, and SVM are affected by the training dataset in the learning stage, they are dependent on the dataset’s specific characteristics, and have different recognition effects for dif-ferent traffic streams belonging to the same QoS class. For example, BitTorrent has a higher accuracy than eDonkey for Naive Bayes although both of them belong to TSV. SVM has a very poor recognition performance for PPlive, but has an extremely good performance for BitTorrent and eDonkey. PPStream has higher classification accuracy than Sopcast in HMM. Since K-NN only calculates the “nearest” neighbor samples, the recognition performance is also influenced by training set samples in the classification process.
In QoS class classification, different QoS classes may utilize the same protocol, such as BSDV, BHDV, TSV and BSV classes all being able to use P2P mode, and the same QoS class may access different protocols, such as GC using both P2P and C/S modes. Since Naive Bayes, HMM, SVM and K-NN are used to classify specific protocols that are not of the QoS class, they have poor performance in QoS class classification due to the existing identification error rate, in which some traffic is classified with an inappropriate QoS class with the same protocol, as in the exampling traffic belonging to the BSDV class being classified as traffic of the BHDV class, and traffic belonging to the BHDV class being classified as traffic of the BSDV class. This is because the difference between BSDV and BHDV classes is not very obvious as SD and HD standards constantly change in network.
TABLE IV
COMPONENTS OF THE EXPERIMENTAL DATASET
QoS Class Traffic type Number of Traffic Flows Data Amount (GB)
1 BSDV Tudou, Youku video(SD) 100 1.05
2 BHDV Tudou, Youku video(HD) 100 2.12
3 WV BBC Web video, CCTV Web video 100 2.06
4 TSV Xunlei, BitTorrent, eDonkey, Emule 100 8.39 5 BSV Sopcast, TVAnt, UUSee, Skype, PPlive, PPStream, PPMate 100 4.87
6 IV ICQ, QQ, MSN 100 4.78
7 GC dota, dota2, lol, Dreams Western adventure, Against War 100 1.21
TABLE V
COMPARISON OF TRAFFIC CLASSIFICATION METHODS IN TERMS OF ACCURACY
Classification Method Proposed method Naive Bayes HMM SVM K-NN
Accuracy (%) 98.29 88 89.71 94.86 92.85
TABLE VI
COMPARISON OF TRAFFIC CLASSIFICATION METHODS IN TERMS OF PRECISION
Classification Method BSDV BHDV WV TSV BSV IV GC
Proposed method 0.9796 0.9608 1 0.9608 0.98 1 1 Naive Bayes 0.8125 0.7885 0.9574 0.8333 0.8654 0.92 1 HMM 0.8511 0.8113 0.9583 0.8654 0.8846 0.9216 1 SVM 0.9167 0.8846 0.9796 0.9231 0.96 0.98 1 K-NN 0.8980 0.8824 0.96 0.92 0.9038 0.94 1
BSDV BHDV WV TSV BSV IV GC 0
0.2 0.4 0.6 0.8 1
Traffic Type
F1−measure
Proposed Naive Bayes HMM SVM
K−NN
Fig. 4. Comparison of traffic classification methods in term of F1-measure.
Unlike existing work [28]–[30], our method takes into account feature selection from the point of view of QoS class, which can effectively improve the classification accuracy. In the proposed method, downstream/upstream rates reflect the essential QoS characteristics of multimedia traffic and help improve recognition accuracy. As a result, with our method, it is possible to obtain potential QoS patterns to improve the classification performance.
VIII. CONCLUSIONS
This paper addressed the problem of effective classifying multimedia traffic with a suitable granularity, and presented a modified K-SVD Internet multimedia traffic identification framework based on the concept of QFAg. Based on statistical
analysis of multimedia flows collected from a large-scale, real network, we defined seven QoS categories with features of downstream/upstream rates. By investigating the sparsity property of the multimedia streaming QoS characteristic, this paper utilized a modified K-SVD to train dictionary extracted from training samples. By learning a characteristic-set to ob-tain sparse representation for multimedia traffic, we proposed a characteristic-based method to classify multimedia traffic. Experimental results reveal that the proposed method can improve the performance significantly compared to other state-of-the-art methods.
REFERENCES
[1] Z. He, S. Mao, and T. Jiang, “A survey of QoE driven video streaming over cognitive radio networks,”IEEE Network, vol. 29, no. 6, pp. 20–25, Nov./Dec. 2015.
[2] Y. Xu and S. Mao, “A survey of mobile cloud computing for rich media applications,”IEEE Wireless Communications, Special Issue on Mobile Cloud Computing, vol. 20, no. 3, pp. 46–53, June 2013.
[3] Z. He, S. Mao, and S. Kompella, “Quality of Experience driven multi-user video streaming in cellular cognitive radio networks with single channel access,”IEEE Transactions on Multimedia, vol. 18, no. 7, pp. 1401–1413, July 2016.
[4] Z. He and S. Mao “Adaptive multiple description coding and trans-mission of uncompressed video over 60GHz networks,” ACM Mobile Computing and Communications Review (MC2R), vol. 18, no. 1, pp. 14–24, Jan. 2014.
[5] D. Hu and S. Mao, “Streaming scalable videos over multi-hop cognitive radio networks,”IEEE Transactions on Wireless Communications, vol. 9, no. 11, pp. 3501–3511, Nov. 2010.
[6] S. Lin, Y. Wang, S. Mao, S.S. Panwar, “Video transport over ad hoc networks using multiple paths,” inProc. IEEE ISCAS 2002, Scottsdale, AZ, May 2002, pp. 57–60.
[8] Y. Huang and S. Mao, “Downlink power control for multi-user VBR video streaming in cellular networks,”IEEE Transactions on Multime-dia, vol. 15, no. 8, pp. 2137–2148, Dec. 2013.
[9] S. Mao, S. S. Panwar, and Y. T. Hou, “On minimizing end-to-end delay with optimal traffic partitioning,”IEEE Transactions on Vehicular Technology, vol. 55, no. 2, pp. 681–690, Mar. 2006.
[10] S. Mao, S. S. Panwar, and Y. T. Hou, “On optimal traffic partitioning for multipath transport,” inProc. IEEE INFOCOM 2005, Miami, FL, Mar. 2005, pp. 2325–2336.
[11] Q.M. Qadir, A.A. Kist, and Z. Zhang, “A novel traffic rate measurement algorithm for Quality of Experience-Aware video admission control,”
IEEE Transactions on Multimedia, vol. 17, no. 5, pp. 711–722, May 2015.
[12] R. Misun, Y. Kim Youngmin, and H. Park, “Systematic QoS class mapping framework over multiple heterogeneous networks,” inProc. 8th International Conference on Next Generation Teletraffic and Wired/Wireless Advanced Networking, St. Petersburg, Russia, Sept. 2008, pp. 212–221.
[13] A. Elnaka and Q.H. Mahmoud, “QoS traffic mapping for a multi-participant session in unified communications networks,” inProc. 26th IEEE Canadian Conference on Electrical and Computer Engineering, Regina, Canada, May 2013, pp. 1–5.
[14] J. Liao, P.A. Chou, C. Yuan, Y. Hu, and W. Zhu, “Online allocation of communication and computation resources for real-time multimedia services,”IEEE Transactions on Multimedia, vol. 15, no. 3, pp. 670–683, Apr. 2013.
[15] Z.-J Wang, Y.-N. Dong, and X. Wang, “A dynamic service class mapping scheme for different QoS domains using flow aggregation,”
IEEE Systems Journal, vol. 9, no. 4, pp. 1299–1310, Dec. 2014. [16] J. Zhang, C. Chen, X. Yang, W. Zhou, and X. Yong, “Internet traffic
classification by aggregating correlated naive Bayes predictions,”IEEE Transactions on Information Forensics and Security, vol. 8, no. 17, pp. 5–15, Jan. 2013.
[17] S. Samanta and B. Chanda, “Space-time facet model for human activity classification,”IEEE Transactions on Multimedia, vol. 16, no. 6, pp. 1525–1535, Oct. 2014.
[18] S.-H. Yoon, J.-S. Park, M.-S. Kim, C. Lim, and J. Cho, “Behavior signature for big data traffic identification,” inProc. 2014 International Conference on Big Data and Smart Computing(BIGCOMP), Bangkok, Thailand, Jan. 2014, pp. 261–266.
[19] M. Jaber, R.G. Cascella, and C. Barakat, “Can we trust the inter-packet time for traffic classification?” inProc. IEEE ICC 2011, Kyoto, Japan, June 2011, pp. 1–5.
[20] N.M. Markovich and U.R. Krieger, “statistical analysis and modeling of peer-to-peer multimedia traffic,”Next Generation Internet, LNCS 5233, pp. 70–97, Springer-Verlag: Berlin Heidelberg, 2011.
[21] N.M. Markovich and U.R. Krieger, “Statistical characterization of QoS aspects arising from the transport of Skype VoIP flows,” in Proc. First International Conference on Evolving Internet, Cannes/La Bocca, France, Aug. 2009, pp. 9–14.
[22] H. Tobias and A. Binzenhofer, “Analysis of Skype VoIP traffic in UMTS: End-to-end QoS and QoE measurements,”Elsevier Computer Networks, vol. 52, no. 3, pp. 650–666, Feb. 2008.
[23] M. Claypool, D. Finkel, A. Grant, and M. Solano, “Thin to win? Network performance analysis of the OnLive thin client game system,” inProc. 2012 Annual Workshop on Network and Systems Support for Games(NetGames), Venice, Italy, Nov. 2012, pp. 1–6.
[24] M. Sanli, E.G. Schmidt, and H.C. Guran, “A flow aggregation method for the scalable and efficient quality of service support in Next Generation Networks,” in Proc. IEEE GLOBECOM’13, Atlanta, GA, Dec. 2013, pp. 2243–2248.
[25] G. Thatte, U. Mitra, and J. Heidemann, “Parametric methods for anomaly detection in aggregate traffic,” IEEE/ACM Transactions on Networking, vol. 19, no. 2, pp. 512–525, Apr. 2011.
[26] S. Valenti and D. Rossi, “Identifying key features for P2P traffic classification,” inProc. 2011 IEEE International Conference on Com-munications(ICC), Kyoto, Japan, June 2011, pp. 1–6.
[27] L. Noirie, E. Dotaro, G. Carofiglio, A. Dupas, P. Pecci, D. Popa, and G. Post, “Semantic networking: Flow-based, traffic-aware, and self-managed networking,”Bell Labs Technical Journal, vol. 14, no. 2, pp. 23–38, Apr. 2009.
[28] S. Maheshwari, S. Mahapatra, C.S. Kumar, and K. Vasu, “A joint parametric prediction model for wireless internet traffic using Hidden Markov Model,”Springer Wireless Networks, vol. 19, no. 6, pp. 171– 1185, Aug. 2013.
[29] J. He, Y. Yang, Y. Qiao, and C. Tang, “Accurate classification of P2P traffic by clustering flows,”IEEE/CIC China Communications, vol. 10, no. 11, pp. 42–51, Nov. 2013.
[30] H. Dibeklioglu, A.A. Salah, T. Gevers, “Recognition of genuine smiles,”
IEEE Transactions on Multimedia, vol. 17, no. 3, pp. 279–294, Mar. 2015.
[31] Q. Li Qun, H. Zhang, J. Guo, B. Bhanu, and A. Le, “Reference-based scheme combined with K-SVD for scene image categorization,”IEEE Signal Processing Letters, vol. 20, no. 1, pp. 67–70, Jan. 2013. [32] S. Gold, “Hacking on the hoof,”IET Engineering and Technology, vol.
7, no. 3, pp. 80–83, Apr. 2012.
[33] K. Nahrstedt and J. Smith, “The QoS broker,”IEEE Multimedia, vol. 2, no. 1, pp. 53–67, Mar. 1995.
[34] Z. Zhu, F. Guo, H. Yu, and C. Chen, “Fast single image super-resolution via self-example learning and sparse representation,”IEEE Transactions on Multimedia, vol. 16, no. 8, pp. 2178–2190, Dec. 2014.
[35] Z. Yu, G.B. Kil, Y.-D. Choi, and S.-H. Kim, “Traffic classification based on visualization,” inProc. 2011 IEEE 2nd International Conference on Networked Embedded Systems for Enterprise Applications (NESEA), Perth, Australia, Dec. 2011, pp. 1–6.
[36] L. Zhou, Z. Yang, H. Wang, and M. Guizani, “Impact of execution time on adaptive wireless video scheduling,”IEEE Journal on Selected Areas in Communications, vol. 32, no. 4, pp. 760–772, Apr. 2014.
[37] C. Xu, Z. Li, J. Li, H. Zhang, and G.-M. Muntean, “Cross-layer fairness-driven concurrent multipath video delivery over heterogeneous wireless networks,” IEEE Transactions on Circuits and Systems for Video Technology, vol. 25, no. 7, pp. 1175–1189, July 2015.
[38] Y. He, N. Sang, C. Gao, and J. Han, “Online unsupervised learning classification of pedestrian and vehicle for video surveillance,”Chinese Journal of Electronics, no. 26, no. 1, pp. 145–151, Jan. 2017. [39] N. Bitar, and H.H. Refai, “A probabilistic approach to improve the
accuracy of axle-based automatic vehicle classifiers,”IEEE Transactions on Intelligent Transportation Systems, vol. 18, no. 3, pp. 537–544, Mar. 2017.
[40] F. Wang, T. Xu, T. Tang, M. Zhou, and H. Wang, “Bilevel feature extraction-based text mining for fault diagnosis of railway systems,”
IEEE Transactions on Intelligent Transportation Systems, vol. 18, no. 1, pp. 49–58, Jan. 2017.
[41] Y.-T. Han and H.-S. Park, “Game traffic classification using statistical characteristics at the transport layer,”ETRI Journal, vol. 32, no. 3, pp. 22–32, Feb. 2010.
[42] S. Bu and Y. Zhang, “Single-frame and multi-frame image super-resolution based on locality-constrained linear coding,”Journal of Jilin University( Engineering and Technology Edition), vol. 43, no. 1, pp. 365–370, Mar. 2013.
[43] J. Wang, J. Yang, K. Yu, F. Lv, T. Huang, and Y. Gong, “Locality-constrained linear coding for image classification,”IEEE Conference on Computer Vision and Pattern Recognition (CVPR) 2010, San Francisco, CA, June 2010, pp. 3360–3367.
[44] M. Aharon, M. Elad, and A. Bruckstein, “K-SVD: An algorithm for designing overcomplete dictionaries for sparse representation,” IEEE Transactions on Signal Processing, vol. 54, no. 11, pp. 4311–4322, Nov. 2006.
[45] G. Somasundaram, R. Sivalingam, V. Morellas, and N, Papanikolopou-los, “Classification and counting of composite objects in traffic scenes using global and local image analysis,”IEEE Transactions on Intelligent Transportation Systems, vol. 14, no. 1, pp. 69–81, Mar. 2013. [46] R. Rubinstein, M. Zibulevsky, and M. Elad, “Efficient implementation
of the K-SVD algorithm using batch orthogonal matching pursuit,”Tech. Rep., Dept. Comput. Sci., Technion, Haifa, Israel, Apr. 2008. [47] R. Ptucha and A.E. Savakis, “LGE-KSVD: Robust sparse representation
classification,”IEEE Transactions on Image Processing, vol. 23, no .4, pp. 1737–1750, Apr. 2014.
[48] X. Shu, J. Tang, G.-J. Qi, Z. Li, Y.-G. Jiang, and S. Yan, “Image classification with tailored fine-grained dictionaries,”IEEE Transactions on Circuits and Systems for Video Technology, vol. PP, no. 99, pp. 1–1, Sept. 2016.
[49] J.R. Deller and R.K. Snider, “Reducing redundant computation in HMM evaluation,”IEEE Transactions on Speech and Audio Processing, vol. 1, no. 4, pp. 465–471, Oct. 1993.
[50] H. Chen, P. Tino, and X. Yao, “Probabilistic classification vector machines,”IEEE Transactions on Neural Networks, vol. 20, no. 6, pp. 901–914, June 2009.
[52] Z.-H. Wang, Z.-S. Hou, Y. Gao, and Q. Liu, “Study on scale devel-opment of boolean medicine data based on the GA and improved k-NN algorithm,” inProc. 2008 International Conference on BioMedical Engineering and Informatics, Sanya, China, May 2008, pp. 367–371.
Zai-jian Wangreceived his BE degree (2002) from Anhui Polytechnic University, MSc degree (2005) from University of Science and Technology of China, and PhD degree (2015) from Nanjing Univer-sity of Posts and Telecommunications. His current research interests focus on multimedia big data, end-to-end QoS provisioning and wired/wireless multi-media streaming. He is currently an associate profes-sor at College of Physics and Electronic Information, An’hui Normal University, Wuhu, China.
Yuning Dong(M’07), received his B.E and M.E de-grees from Nanjing University of Posts & Telecom-munications (NUPT), his Ph.D degree from South-east University, all in electrical engineering, and his M.Phil degree in Computer Science from The Queen’s University of Belfast (QUB). He is currently a professor with the College of Communications and Information Engineering at NUPT. He was a British Council postdoctoral fellow at Imperial College Lon-don, 1992-93; a visiting scientist at University of Texas, 1993-95; and a research fellow at QUB and the University of Birmingham, 1995-98. His research interests include wireless networking, multimedia communications and network traffic identification.
Shiwen Mao (S’99-M’04-SM’09) received his Ph.D. in electrical and computer engineering from Polytechnic University, Brooklyn, NY in 2004. Cur-rently, he is the Samuel Ginn Distinguished Profes-sor and Director of Wireless Engineering Research and Education Center at Auburn University, Auburn, AL, USA. His research interests include wireless networks, multimedia communications, and smart grid. He is a Distinguished Lecturer of IEEE Vehicu-lar Technology Society. He is on the Editorial Board of IEEE Transactions on Multimedia, IEEE Internet of Things Journal, IEEE Multimedia, IEEE/CIC China Communications, among others, and a Steering Committee Member of IEEE Transactions on Multimedia and IEEE Transactions on Network Science and Engineering. He serves as TPC Chair of IEEE INFOCOM 2018, Area TPC Chair of IEEE INFOCOM 2017 and 2016, Technical Program Vice Chair for Information Systems (EDAS) of IEEE INFOCOM 2015, symposium co-chairs for many conferences, including IEEE ICC, IEEE GLOBECOM, ICCCN, among others, and Steering Committee Voting Member of IEEE ICME and AdhocNets. He is the Chair of IEEE ComSoc Multimedia Communications Technical Committee. He received the 2015 IEEE ComSoc TC-CSR Distinguished Service Award, the 2013 IEEE ComSoc MMTC Outstanding Leadership Award, and the NSF CAREER Award in 2010. He is a co-recipient of the Best Demo Award of IEEE SECON 2017, the Best Paper Awards of IEEE GLOBECOM 2016, IEEE GLOBECOM 2015, IEEE WCNC 2015, and IEEE ICC 2013, and the 2004 IEEE Communications Society Leonard G. Abraham Prize in the Field of Communications Systems.
![TABLE Iauthors in [40] proposed a bilevel feature extraction-based textCOMPONENTS OF THE DATASET](https://thumb-us.123doks.com/thumbv2/123dok_us/1007227.1600591/3.612.314.558.74.336/table-iauthors-proposed-bilevel-feature-extraction-textcomponents-dataset.webp)