Article
A Robust Symmetric Nonnegative Matrix
Factorization Framework for Clustering Multiple
Heterogeneous Microbiome Data
Yuanyuan Ma 1,4, Xiaohua Hu 2,3, Tingting He 2 and Xingpeng Jiang 2,*
1 School of Information Management, Central China Normal University, Wuhan 430072, China 2 School of Computer, Central China Normal University, Wuhan 430072, China
3 College of Computing & Informatics, Drexel University, Philadelphia, PA 19104, USA 4 Anyang Normal University, Anyang 455000, China
* Corresponding author: [email protected]
Abstract: Integration of multi-view datasets which are comprised of heterogeneous sources or different representations is challenging to understand the subtle and complex relationship in data. Such data integration methods attempt to combine efficiently the complementary information of multiple data types to construct a comprehensive view of underlying data. Nonnegative matrix factorization (NMF), an approach that can be used for signal compression and noise reduction, has aroused widespread attention in the last two decades. The Kullback–Leibler divergence (or relative entropy) information distance can be used to measure the loss function of NMF. In this article, we propose a fast and robust framework (RSNMF) based on symmetric nonnegative matrix factorization (SNMF) and similarity network fusion (SNF) for clustering human microbiome data including functional, metabolic and phylogenetic profiles. Many existing methods typically utilize all the information provided by each view to create a consensus representation, which often suffers a lot from noise in data and cannot provide a precise representation of the latent data structures. In contrast, RSNMF combines the strength of SNMF and the advantage of SNF to form a robust clustering indicator matrix thus can reduce the noise influence. We conduct experiments on one synthetic and two real dataset (microbiome data, text data) and the results show that the proposed RSNMF has better performance over the baseline and the state-of-art methods, which demonstrates the potential application of RSNMF for microbiome data analysis.
Keywords: symmetric nonnegative matrix factorization; similarity network fusion; human microbiome; multi-view clustering
1. Introduction
In recent years, advances in high-throughput sequencing technologies have made the collection of the multiple heterogeneous microbiome data on an unprecedented scale become available. Microbiome studies investigate the relationship among microorganisms and the interaction between microbiota and the host environments, which have shown increasingly important values in understanding the principles and mechanisms of microbiota-associated health and disease and other biological questions including environmental science, bio-energy production and so on[1, 2].Many microbiome projects including Human Microbiome Project (HMP)[3], Metagenomics of the Human Intestinal Tract (MetaHIT)[4], Tara Oceans Project[5], have generated large amount of data which can be processed to represent the composition profiles of microbiome community, for example phylogenetic profile and abundance profile. However, these composition profiles are often analyzed individually in order to investigate the variety among samples.
Using metagenomics data from MetaHIT, Arumugam et al. classified microbiome into enterotypes and highlighted the significance of a functional analysis to understand the interactions among microbes[6, 7]. Koren et al. utilized the clustering methods and distance metrics to demonstrate that how different factors exerted influence on the detection of enterotypes, and pointed not all clustering
methods accurately identified such enterotypes or clusters[8]. Ma et al. conducted research on the microbiome function profile data from HMP so as to find the difference among samples[9]. Nevertheless, many other studies suggested that either additional dataset should be considered or more rigorous approaches should be provided to draw an unbiased conclusion from microbiome data. These researches are all based on clustering methods. So far, there are rare methods to integrate multiple measurements together to study the microbial community. Adopting different sequencing technology, for example, 16S rRNA sequencing or shotgun metagenomics sequencing, a microbial sample or the DNA sequences of a sample can be probed to measure its phylogenetic profile, functional profile, metabolic pathway, protein families and so on. However, due to the noise existed in the raw data, heterogeneous and dynamic properties of microbiome data[10], it is difficult to combine different views of data to provide an overall understanding of microbiome samples. Novel data integrating methods are eagerly needed to disentangle complex microbial community.
In the field of text mining and image processing, there emerging many novel methods to integrate multi-view dataset [11-15]. Co-training spectral clustering algorithm[16] attempts to find compatible clustering solution by updating iteratively discriminative eigenvectors of each view. Similarity Network Fusion (SNF)[17] efficiently constructs a fused network that represents the underlying data structure across different views. SNF is an effective approach and has applied to many fields, such as image retrieval[18], cancer subtypes and survival prediction[17]. However, at the stage of building similarity networks for each view’s data type, SNF uses the Gaussian kernel and K-Nearest Neighborhoods (KNN) approaches, which is not all appropriate and feasibility for all types of data, for instance, text data.
Recently, information theory in machine learning and data science has already attracted extensive attention. For example, Nonnegative Matrix Factorization (NMF) adopts relative entropy to measure the signal compression ratio and obtain good performance. NMF can be considered as a signal compression and noise reduction method which can approximate original data signal by its low-rank factorization. The relative entropy or the Kullback–Leibler divergence between the original data matrix and the low-rank approximation reflects the maximum compression possible[19]. Small relative entropy represents that the original matrix (information source) has high redundancy. Multi-view Nonnegative Matrix Factorization (multi-NMF)[12] and Joint Nonnegative Matrix Factorization (JNMF)[20] are the variants of NMF and they are efficient clustering algorithms by searching a consensus and meaningful solution shared by all views.
Another efficiently clustering method is Symmetric Nonnegative Matrix Factorization (SNMF). Kuang et al. indicated that SNMF could be used for graph clustering and often performed better than spectral methods and NMF[21]. SNMF takes a nonnegative similarity matrix as input, and outputs two low-rank matrix (H, HT). The performance of SNMF relies on the affinity matrix which is
measured by various distance metrics. Zhu et al. established robust affinity graph based on clustering random forest (ClustRF). Although ClustRF is capable of capturing subtle and weak relevant information distributed among the discriminative features[10, 11], it’s an extraordinarily time-consuming process. The complexity of ClustRF algorithms increases exponentially with the size of samples and the number of features and training trees.
Fig 1. Illustrative example of RSNMF. (a) Example representation of the abundance profile and the phylogenetic profile for the same cohort of samples. (b) Sample similarity matrices for each view. (c) SNF iteratively updates each similarity matrix with information from the other similarity matrix, forming the last fused matrix. (d) By conducting RSNMF on the final fused matrix, the clustering indicator matrix is obtained and each sample is assigned to a reliable membership label.
The contributions of this study rest with: an efficient clustering approach to integrate multiple heterogeneous microbiome data has been proposed. The proposed method can be easily extended to other fields if the samples have multiple measurements. The rest of the paper is organized as below: in next section, we describe what dataset we used in this study, and a brief overview of NMF and SNF is provided, then followed by the RSNMF algorithm. At last, experimental results and the conclusion are described.
2. Materials and Methods
2.1. Experimental Data
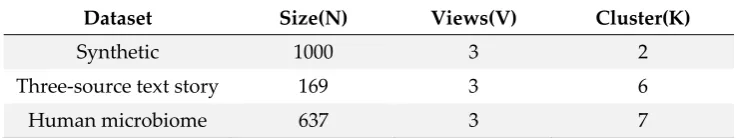
Three datasets are used in our experiment. The first is a synthetic dataset, the second is the three-source text story dataset and the last is the human microbiome data. Table 1 is the important statistics summary of these three datasets.
Table 1. Statistics of the three datasets used in the study
Dataset Size(N) Views(V) Cluster(K)
Synthetic 1000 3 2
Three-source text story 169 3 6
Human microbiome 637 3 7
Synthetic dataset: This artificial data includes three views generated from a two-component Gaussian mixture model. Each view of data has two clusters. Detailed information and parameters was given in [16].
Table 2. Statistics of three-source dataset
Label # Documents(N)
Business 56
Entertainment 21
Health 11
Politics 18
Sport 51
Technology 12
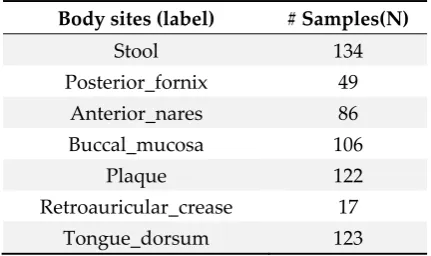
Human microbiome dataset: This public dataset includes three compositional profiles: the phylogenetic, transporter and metabolic profiles from HMP (http://hmpdacc.org/). It contains 637 samples drawn from seven body sites (see Table 3 for the detailed information). The phylogenetic profile is comprised of the microbe relative abundances which was estimated by MetaPh1An at species level. The transporter and metabolic profiles data are also downloaded from HMP site, please refer to http://hmpdacc.org/ to get more information[23].
Table 3. Statistics information of the human microbiome samples
Body sites (label) # Samples(N)
Stool 134
Posterior_fornix 49
Anterior_nares 86
Buccal_mucosa 106
Plaque 122
Retroauricular_crease 17
Tongue_dorsum 123
2.2. Nonnegative Matrix Factorization (NMF)
In NMF, given an original matrix V(n×m), we seek to find two low-rank matrices W(n×k) and H(k×m) to approximate V by minimizing an objective function(Eq.1) where k is the underlying clusters number or the degree of factorization, W and H is nonnegative. The objective function of NMF is the least squares:
= Min
, ‖ − ‖ (1)
Where, ∈ × , ∈ × , ∈ × , and ‖. ‖ denotes Frobenius norm.
NMF can not only be used for data representation, but also for clustering. In the first case, the linear additional combination of basis vectors ( , , ⋯ , ) can be used to represent each row of V, where denotes the i-th row of H. At the same time, each column of V can also be represented by the linear additional combination of ( , , ⋯ , ) where denotes the j-th column of W. In the second case, by conducting the hard clustering approaches such as Kmeans on the basis matrix H, all samples will be assigned to corresponding clustering membership labels. Xu el al. used NMF to cluster document and obtained better performance[24], which further indicated the latent application of NMF in data clustering.
2.3. Symmetric Nonnegative Matrix Factorization (SNMF)
nonlinear structure or lies on a complicated manifold (for example ring structure), the performance of NMF will not be satisfactory consistently. SNMF is an effective approach to cluster data with nonlinear structure. It only concerns with the symmetric matrix which can be constructed by various similarity metrics and factorizes the matrix into two low-rank matrices (H, HT). SNMF is also an approach based on graph clustering. The objective function of SNMF is defined as below:
= Min‖ − ‖ (2)
Where, ∈ × is the similarity matrix measured by certain distance metric, and ∈ × , k is the degree of factorization or the default number of clusters. , the ij-th element of A, denotes the similarity between i-th and j-th data points.
The similarity between each pair of nodes can be measured by many approaches, for example, heat kernel function, inner product kernel function, correlation coefficient methods and so on. In this study, we experimentally adopt inner-product kernel for normalized text data and Gaussian kernel for other data type.
2.4. Constructing Affinity Graphs based on Different Kernels
Given a matrix ∈ × , denotes i-th sample point. The sample-by-sample similarity matrix or the affinity graph can be established by two ways: sparse graph and full graph. Sparse graph adopts KNN approach to preserve the locality among one specific sample and its k-th nearest neighborhoods [17]. For microbiome data, we use the Gauss kernel function and sparse manner to construct the similarity matrix. For text data, we utilize the Cosine distance and full graph to build the weight matrix. The Cosine similarity between two samples can be defined as below:
=
‖ ‖ × (3) Where, denotes the similarity between two nodes, ‖ ‖ denotes the norm of i-th text vector. We can also transform the Eq.3 into inner-product form by normalizing each sample vector making ‖ ‖ = 1 for ∀ .
For HMP data, the similarity is defined as:
= exp − −
μ (4)
Where, µ is a parameter that can be empirically set and is used to eliminate the scaling problem[17]. can be defined as below:
= + ( , ) + ( , )
3 (5) Where, denotes the distance between i-th and j-th data points, ( , ) is the average value of distance among i-th node and its neighbors.
Furthermore, the obtained weight matrix can be transformed into a normalized one:
= / / (6)
Where, D is a degree matrix whose diagonal element is = ∑ and other elements equals to zeros.
2.5. The Weighted Symmetric Nonnegative Matrix Factorization
SNMF has been described in the section above. For Eq.2 the updating rule of SNMF is[26]:
← 1 − + (( )) (7)
Where, 0 < ≤ 1. In this study, the values of are set in the range between 0 and 1.
In general, SNMF requires the similarity matrix to be semi-positive definite (s.p.d). However, not all of the nonnegative matrices are s.p.d. So, a more generalized algorithm was proposed in [27]:
the indefiniteness can pass onto S. So, Eq.8 has better approximation than Eq.2, which is well-known in Cholesky factorization.
Eq.8 is also called weighted SNMF. Its advantage lies in: H is closer to the form of clustering indicator and S provides a good representation for the clustering quality. If the clusters are separated well, respectively the diagonal elements of S will be much larger than the off-diagonal elements[26].
The updating rules of the weighted SNMF are:
← ( )
( ) (9) ← 1 − + ( )
( ) (10) A fast algorithm, called NNDSVD, can be used to enhance the initiation stage of SNMF. NNDSVD can readily to be combined with SNMF and leads to rapid reduction of the approximation error of many NMF algorithms[28].
2.6. Similarity Network Fusion (SNF)
SNF is an effective method to integrate multiple heterogeneous data types[17]. It utilizes heat kernel function to construct similarity matrices and iteratively updates each affinity matrix with the information from other matrices to form a final matrix. Then, spectral clustering is used to obtain network clusters.
After the weight matrix W is established (Eq.4), a well-normalized affinity matrix P can be derived from:
= 2 ∑ , ( ≠ ) 1
2, ( = )
(11)
To certain degree, this normalization can avoid suffering from numerical instability involving self-similarity. Note that P encodes the global information between each sample and any other sample. To capture local structures of graphs, [17] used KNN methods to define a kernel matrix M as below:
= ∑ ∈ , ( ∈ )
0, ℎ
(12)
Where, denotes the neighborhood of i-th sample. In contrast to P, M only carries the local similarity to the k nearest neighbors of each sample. SNF process always starts from P as initial state using M as the kernel matrix. More details can be obtained by[17].
Let and represent similarity matrices from v-th view which can be obtained from Eq.11 and Eq.12, respectively. SNF steps iteratively update affinity matrix as follows:
= ∑
− 1 ( ) , = 1,2, ⋯ , (13) Where, j is the number of distinct views. We can see that similarity information is propagated and accumulated through the fusion process. Each view’s data utilizes all other views’ information by interchanging diffusion processes.
At last, the affinity matrix that fuses each data type is defined as:
= 1 (14)
SNF can reduce some noise between samples by using KNN approach to construct sub-graph M. So, SNF is robust to noise existed in affinity matrix. In graph theory, global silencing[29] and network deconvolution[30] are also efficient methods to eliminate noise. For future study, we will consider to adopt these two approaches to remove indirect correlation (or similarity).
2.7. The Robust Symmetric Nonnegative Matrix Factorization (RSNMF)
appropriate kernel functions to construct the similarity matrices according to different data types. Then, SNF is used to integrate the similarity matrices or networks obtained in the previous step, forming the last fused matrix. At last, by conducting the weighted SNMF on the final fused matrix, the clustering indicator matrix is obtained and all samples can be assigned to corresponding membership labels. Figure 1 clearly elucidates the process of RSNMF.
Because RSNMF combines the strength of SNMF and SNF to form a robust clustering indicator matrix, it achieves better performance in terms of two metrics as are mentioned below. The subsequent experimental results also elucidates the effectiveness and efficiency of RSNMF.
2.8. Evaluation Metrics
In our experiments, two widely adopted metrics, Accuracy (AC) and Normalized mutual information (NMI) are used to evaluate the clustering quality by comparing the cluster labels derived from various algorithms with the ground-truth[24]. High values of AC and NMI show better cluster performance.
2.9. Detection of the Noisy views
As described, SNF takes advantage of the complementary information presented in different views to construct a comprehensive representation that reflects the full spectrum of latent data. The final fused matrix P can be used to measure the compatibility between two similarity matrices obtained from different views. That NMI measures the information agreement between two clustering results is an appropriate method to filters out noisy views. If the value of NMI between one similarity matrix and P is much smaller than others, it may contain more noise.
3. Results and Discussion
3.1. Experimental results
We conduct extensive experiments on one synthetic and two real-world datasets, and compare the proposed RSNMF algorithm with a number of baselines. These baseline algorithms include:
Single view (BSV and WSV)[12]: Running each view using the SNMF algorithm. BSV refers to the most informative view which can achieve the best clustering performance. In contrast to BSV, WSV refers to the worst view of the data. By running SNMF on single view, we can obtain the clustering results, respectively.
Co-training Spectral Clustering (Co-training SC): Appling the idea of co-training[31] to the framework of spectral clustering. By iteratively using the discriminative eigenvectors from one view to modify the graph structure of the other view. Ultimately, the underlying clusters of both views tend to agree with each other.
Multi-view NMF: Integrating different coefficient matrices learnt from all views to obtain a common consensus solution[12]. The consensus matrix reflects the latent data structure shared by each view. The objective function of Multi-view is:
= ‖ − ‖ + ‖ − ∗‖ (15)
s.t. , , ∗≥ 0.
By introducing auxiliary matrix = (∑ , , ∑ , , ⋯ , ∑ , ), the coefficient
matrices s from different views are comparable which guarantees the fusion of all views is meaningful and interpretable.
SNF: Constructing sample-by-sample similarity networks for all data types and integrating them into a final affinity graph which captures both shared and complementary information provided by distinct views. More details have been described in section SNF[17].
integrate all the affinity graphs from different views to create a fused network[10]. At last, spectral clustering is employed to partition nodes in the graph.
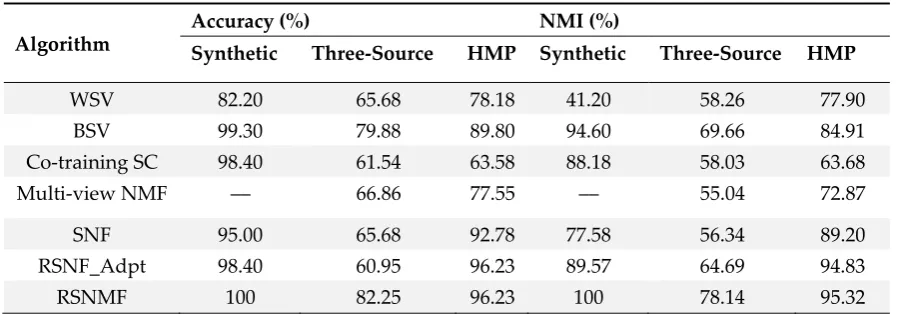
Experimental results are reported on one synthetic and two real-world dataset. Table 4 shows the clustering results of RSNMF compared with the baseline algorithms above on these three datasets. As Table 4 shown, RSNMF significantly outperforms other algorithms in terms of AC/NMI.
Table 4. The clustering performance on three datasets (%)
Algorithm
Accuracy (%) NMI (%)
Synthetic Three-Source HMP Synthetic Three-Source HMP
WSV 82.20 65.68 78.18 41.20 58.26 77.90
BSV 99.30 79.88 89.80 94.60 69.66 84.91
Co-training SC 98.40 61.54 63.58 88.18 58.03 63.68
Multi-view NMF –– 66.86 77.55 –– 55.04 72.87
SNF 95.00 65.68 92.78 77.58 56.34 89.20
RSNF_Adpt 98.40 60.95 96.23 89.57 64.69 94.83
RSNMF 100 82.25 96.23 100 78.14 95.32
*For Muti-view NMF, the clustering results on Three-source and HMP datasets are obtained when α = 0.01 and
0.05, respectively. –– indicates that the result is unavailable due to the negative elements in this dataset. For RSNF_Adpt, the number of neighborhoods and sub tree on three datasets is set to be 12 and 200, respectively. µ, a hyperparameter, is set as 0.5 empirically.
On these three datasets, RSNMF achieves much improvement in two metrics compared with other algorithms. Surprisingly, on the synthetic data, RSNMF obtains the perfect performance (100%/100%) in terms of AC/NMI. RSNMF outperforms the best single view (BSV) as 3.37%/8.48% on Three-source data, and 6.43%/10.41% on HMP data. The difference between RSNMF and SNF is also significantly, where RSNMF has 82.25%/78.14%, 96.23%/95.32% in AC/NMI, but SNF only possesses 65.68%/56.34%, 92.78%/89.20% on the two realistic datasets, respectively (see Table 4). One of the possible reasons is that RSNMF provides extra degrees of freedom via S that allows H to be much closer to the form of cluster indicator than spectral clustering based methods (SNF, RSNF_Adpt, Co-training SC)[26]. Furthermore, RSNMF utilizes more flexible way to construct affinity matrix for distinct data types. Therefore, the proposed RSNMF algorithm can effectively and exactly find the true clustering.
3.2. Parameter tuning
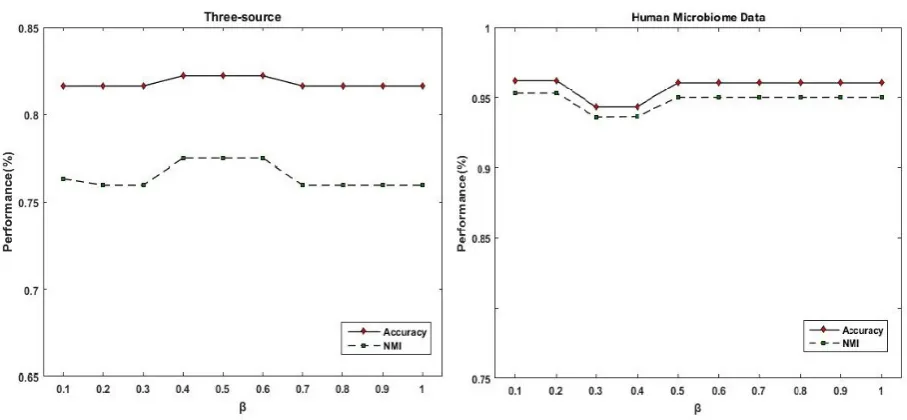
There are several parameters in the proposed RSNMF framework. µ is a hyperparameter, it is set to be 0.4 on Synthetic and Three-source data and to be 0.45 on HMP data. For other values, RSNMF still outperforms other algorithms in most case. The number of iteration and neighbors in SNF, RSNF_Adpt and RSNMF is set to be 20. The value of β varies between 0 and 1. By conducting extensive experiments on these three data, we find that RSNMF is insensitive to these parameters and runs efficiently.
Fig 2. Performance of RSNMF versus βon Three-source and HMP datasets. In two evaluation metrics (AC and NMI), RSNMF has stable and reliable performance. When βequals to 0.5 and 0.2 on Three-source and HMP data, respectively, RSNMF obtains the highest values in terms of AC/NMI. For other values of β, the fluctuation of RSNMF is much smaller.
3.3. Computational complexity study
In this subsection, we will discuss the computational complexity of RSNMF. Based on the updating rules summarized in Eq.9 and Eq.10, the overall cost of RSNMF after running SNF on different data source is
(3 + 5 + )
Where, k is the latent number of clusters and ≪ , . Therefore, the computational cost can be simplified as ( + ). It is worth noting that the number of samples n is generally much smaller than the features in bioinformatics. Additionally, RSNMF adopts a faster initialization algorithm (NNDSVD) in the first stage of iteration which guarantees the inner loop converges very quickly[28]. For large-scale data, the whole running time is approximately linear with respect to the number of samples. In contrast to RSNMF, ClustRF is very costly and computationally infeasible to generate the similarity matrix when the number of data points increases dramatically.
3.4. Analysis on HMP data
In Eq.8, S provides a good description of the quality of clustering and has a special implication[26]. By conducting Kmeans on H, we can obtain vigorous cluster indicators. Assuming = and setting the derivative . 8⁄ = 0, we acquire:
= or = ℎ ℎ =
∈ , ∈ (16)
Where, denotes i-th cluster, denotes the number of samples in . More details can be found in [26]. S represents the normalized sum of weights between two clusters. If the clusters are well-separated, the diagonal elements will be much larger than the off-diagonal elements.
Fig 3. The 6×6 matrix S1 derived from Three-source data indicates that the distinct clusters are well-separated. The result is obtained when β is set as 0.5, for other values of β,RSNMF still has analogous performance.
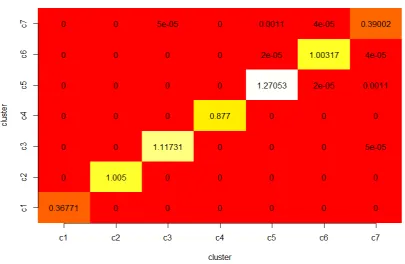
Fig 4. The 7×7 matrix S2 derived from HMP data indicating to what extent two clusters are well-separated. This matrix is filled with many zeros, illustrating the sum of weights between clusters is very small. The result above is obtained when βequals to 0.2.
elements of S denote between-cluster sum of weights. As we can see, the off-diagonal elements are much smaller compared with the diagonal elements, demonstrating the boundary between two clusters is evident. That is to say these clusters are well separated.
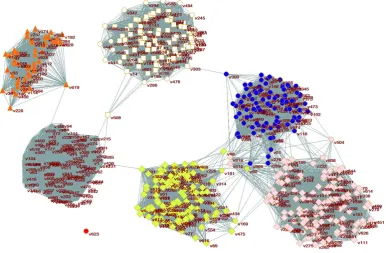
Fig.5 illustrates the clear clustering patterns on HMP data. As RSNMF and other variants of NMF are soft-clustering based methods, the coefficient matrix H (637×7) which is a low-dimension representation of microbiome samples can be transformed into a rigid cluster indicator with Kmeans. This figure clearly identifies clustering structure corresponding to microbiome samples from distinct body sites. As also seen in Table 4, the proposed method can achieve 96.23%/95.32% in terms of AC/NMI which is the highest record according to our best knowledge. From Fig.5 we can see that the connection with-in cluster is very strong, however, the edges between-cluster are very sparse, which is consistent with the description of S2 (see Figure 4). RSNMF successfully divides nodes presented in this graph into different clusters, simultaneously has small loss of weights. This suggests RSNMF is a more versatile framework for integrating multiple heterogeneous data.
Fig 5. Clusters of microbiome samples after integrating three sources of data (phylogenetic, transporter and metabolic profiles). This result is obtained when the threshold of edge (or weight) is set as 3e-3 andβ equals to 0.2 empirically.
The shape of vertices indicates truth clustering label of samples (in this picture, only ‘box’, ‘ellipse’, ‘diamond’, ‘triangle’ and ‘empty’ is used, but it does not affect the analysis of microbiota), then colors denote different clusters derived from RSNMF. Green: Plaque, Blue: Buccal_mucosa, Pink: Tongue_dorsurm, Orange: Posterior_fornix, Red: Retroauricular_crease, Empty: Stool, Light white: Anterior_nares.
Anterior_nares (light white, box) and Retroauricular_crease (light white, ellipse) have high similarities. Possibly, we attribute this cause to the fact that they are both from skins. In this case RSNMF cannot clearly make a distinction between these two sites. This may be due to the noise existed in raw data and the following establishment of network which is based on this noise.
On the other hand, RSNMF can exactly detects the modules so that the cut-off between clusters has a minimum weight loss (see S2). In RSNMF, the quality of the clustering and community detection depends on the construction of similarity network. If there is a robust affinity graph, RSNMF will successfully identify the cluster structure. In this study, although community detection is not our focus, RSNMF could be also viewed as a novel method for community finding.
4. Conclusions
In this paper, we introduce a novel framework (RSNMF) for data integration based on similarity network fusion (SNF) and symmetric nonnegative matrix factorization (SNMF). We extend the similarity measurement approaches of SNF according to different data type and achieve much improvement in performance. On human microbiome data, we combine phylogenetic, metabolic, and transporter profiles into RSNMF framework to analyze the correlations among microbiome samples. Due to the delicate and complex interactions among microbiota and host environment, the nonlinear method is more appropriate for modeling microbial community. RSNMF, a graph clustering approach, can be used to construct network in any reasonable manner, including but not limited to Euclidean behavior-based methods.
The proposed RSNMF is a robust method for clustering text and microbiome data efficiently and effectively. The performance of RSNMF on these two data type is quite stable. We also show that RSNMF converges with nearly linear computational time. Experimental results on one synthetic and two realistic datasets demonstrate RSNMF is a more versatile framework compared with other baseline and state-of-art approaches, which suggests the potential application of RSNMF for microbiome data analysis. At the same time, RSNMF can also be applied in community finding. The analysis on HMP data shows RSNMF has capability to identify distinct modules presented in complex network. In the future, we will focus on the new community detection algorithm based on RSNMF.
Acknowledgments
This research is supported by the National Natural Science Foundation of China (No.61532008), the China Scholarship Council, the International Cooperation Project of Hubei Province (No.2014BHE0017), the Self-determined Research Funds of CCNU from the Colleges’ Basic Research and Operation of MOE (No.CCNU1004A028, No.CCNU16KFY04).
Author Contributions:
Conceived and designed the experiments: YM XJ. Performed the experiments: YM XJ. Analyzed the data: YM XJ. Contributed reagents/materials/analysis tools: YM XJ XH TH. Wrote the paper: YM XJ XH TH. All authors have read and approved the final manuscript.
Conflicts of Interest
The authors declare no conflict of interest.
References
1. Jiang, X.; Hu, X.; Xu, W., Microbiome Data Representation by Joint Nonnegative Matrix Factorization
with Laplacian Regularization. IEEE/ACM Transactions on Computational Biology and Bioinformatics
2015, PrePrints, http://dx.doi.org/10.1109/TCBB.2015.2440261.
2. Knights, D.; Costello, E. K.; Knight, R., Supervised classification of human microbiota. FEMS
microbiology reviews 2011, 35, (2), 343-359.
3. Peterson, J. L.; Garges, S.; Giovanni, M.; Mcinnes, P.; Wang, L.; Schloss, J. A.; Bonazzi, V.; Mcewen, J.
(12), 2317-2323.
4. Ehrlich, S. D.; Consortium, T. M., MetaHIT: The European Union Project on Metagenomics of the
Human Intestinal Tract. Metagenomics of the Human Body 2011, 25, (73), 968.
5. Zhang, H.; Ning, K., The Tara Oceans Project: New Opportunities and Greater Challenges Ahead.
Genomics, Proteomics & Bioinformatics 2015, 13, (5), 275.
6. Arumugam, M.; Raes, J.; Pelletier, E.; Le Paslier, D.; Yamada, T.; Mende, D. R.; Fernandes, G. R.; Tap, J.; Bruls, T.; Batto, J.-M., Enterotypes of the human gut microbiome. nature 2011, 473, (7346), 174-180.
7. Siezen, R. J.; Kleerebezem, M., The human gut microbiome: are we our enterotypes? Microbial
biotechnology 2011, 4, (5), 550-553.
8. Koren, O.; Knights, D.; Gonzalez, A.; Waldron, L.; Segata, N.; Knight, R.; Huttenhower, C.; Ley, R. E., A guide to enterotypes across the human body: meta-analysis of microbial community structures in
human microbiome datasets. PLoS Comput Biol 2013, 9, (1), e1002863.
9. Ma, Y.; Hu, X.; He, T.; Jiang, X., Hessian regularization based symmetric nonnegative matrix
factorization for clustering gene expression and microbiome data. Methods 2016, 111, 80-84. 10. Zhang, Y.; Hu, X.; Jiang, X., Multi-view Clustering of Microbiome Samples by Robust Similarity Network
Fusion and Spectral Clustering. IEEE/ACM Transactions on Computational Biology and Bioinformatics
2015, PrePrints, http://dx.doi.org/10.1109/TCBB.2015.2474387.
11. Zhu, X.; Change Loy, C.; Gong, S. In Constructing robust affinity graphs for spectral clustering,
Proceedings of the IEEE Conference on Computer Vision and Pattern Recognition, 2014; pp
1450-1457.
12. Liu, J.; Wang, C.; Gao, J.; Han, J. In Multi-view clustering via joint nonnegative matrix factorization, Proc. of SDM, SIAM: 2013; pp 252-260.
13. Huang, L.; Lu, J.; Tan, Y.-P., Co-learned multi-view spectral clustering for face recognition based on
image sets. IEEE Signal Processing Letters 2014, 21, (7), 875-879.
14. Li, L., MPGraph: multi-view penalised graph clustering for predicting drug-target interactions. IET
systems biology 2014, 8, (2), 67-73.
15. Eaton, E.; Jacob, S., Multi-view constrained clustering with an incomplete mapping between views.
Knowledge and information systems 2014, 38, (1), 231-257.
16. Kumar, A.; Daumé, H. In A co-training approach for multi-view spectral clustering, Proceedings of the
28th International Conference on Machine Learning (ICML-11), 2011; pp 393-400.
17. Wang, B.; Mezlini, A. M.; Demir, F.; Fiume, M.; Tu, Z.; Brudno, M.; Haibe-Kains, B.; Goldenberg, A.,
Similarity network fusion for aggregating data types on a genomic scale. Nature methods 2014, 11, (3), 333-337.
18. Wang, B.; Jiang, J.; Wang, W.; Zhou, Z.; Tu, Z. In Unsupervised metric fusion by cross diffusion,
computer vision and pattern recognition, 2012; pp 2997-3004.
19. Shannon, C. E., A mathematical theory of communication. Bell System Technical Journal 1948, 27, (3), 379-423.
20. Greene, D.; Cunningham, P. In A matrix factorization approach for integrating multiple data views,
Joint European Conference on Machine Learning and Knowledge Discovery in Databases; Springer:
2009; pp 423-438.
21. Kuang, D.; Yun, S.; Park, H., SymNMF: nonnegative low-rank approximation of a similarity matrix for
graph clustering. Journal of Global Optimization 2015, 62, (3), 545-574.
22. Greene, D.; Cunningham, P. In A Matrix Factorization Approach for Integrating Multiple Data Views,
european conference on principles of data mining and knowledge discovery, 2009; pp 423-438.
A. M.; Fitzgerald, M.; Fulton, R. S., Structure, function and diversity of the healthy human microbiome. Nature 2012, 486, (7402), 207-214.
24. Xu, W.; Liu, X.; Gong, Y. In Document clustering based on non-negative matrix factorization,
international acm sigir conference on research and development in information retrieval, 2003; pp 267-273.
25. Kuang, D.; Ding, C.; Park, H. In Symmetric Nonnegative Matrix Factorization for Graph Clustering, siam international conference on data mining, 2012; pp 106-117.
26. Ding, C.; He, X.; Simon, H. D.; Jin, R. In On the Equivalence of Nonnegative Matrix Factorization and K-means- Spectral Clustering, Siam International Conference on Data Mining, 2005; pp 606-610.
27. Li, T.; Ding, C., The Relationships Among Various Nonnegative Matrix Factorization Methods for
Clustering. 2006; 362-371.
28. Boutsidis, C.; Gallopoulos, E., SVD based initialization: A head start for nonnegative matrix
factorization. Pattern Recognition 2008, 41, (4), 1350-1362.
29. Barzel, B.; Barabasi, A., network link prediction by global silencing of indirect correlations. Nature Biotechnology 2013, 31, (8), 720-725.
30. Feizi, S.; Marbach, D.; Medard, M.; Kellis, M., Network deconvolution as a general method to
distinguish direct dependencies in networks. Nature Biotechnology 2013, 31, (8), 726-733.
31. Blum, A.; Mitchell, T. M. In Combining labeled and unlabeled data with co-training, computational