Rothamsted Research is a Company Limited by Guarantee Registered Office: as above. Registered in England No. 2393175.
Rothamsted Repository Download
A - Papers appearing in refereed journals
MacLaren, C., Swanepoel, P., Bennett, J., Wright, J. and
Dehnen-Schmutz, K. 2019. Cover Crop Biomass Production Is More Important
than Diversity for Weed Suppression. Crop Science. 59 (2), pp. 733-748.
The publisher's version can be accessed at:
•
https://dx.doi.org/10.2135/cropsci2018.05.0329
•
https://dl.sciencesocieties.org/publications/cs/articles/59/2/733
The output can be accessed at:
https://repository.rothamsted.ac.uk/item/8wqv8
.
© 24 January 2019, Please contact library@rothamsted.ac.uk for copyright queries.
Cover crop biomass production is more important than diversity for weed
suppression
Chloe MacLaren*, Pieter Swanepoel, James Bennett, Julia Wright, Katharina Dehnen-Schmutz
C. MacLaren, J. Bennett, J. Wright and K. Dehnen-Schmutz, Centre for Agroecology, Water &
Resilience; Coventry University; Ryton Gardens, Wolston Lane, Coventry CV8 3LG, United
Kingdom. P. Swanepoel, Department of Agronomy, Stellenbosch University; Welgevallen
Experimental Farm, Suidwal St, Stellenbosch, South Africa. C. MacLaren, current address:
Rothamsted Research, West Common, Harpenden AL5 2JQ, United Kingdom.
*Corresponding author: (chloe.maclaren@rothamsted.ac.uk)
Abstract
Biotic resistance theory suggests that diverse cover crop mixes may be more effective at weed
suppression than a cover crop monoculture. However, evidence for this has so far been
inconsistent. To investigate, we designed a trial to explicitly test the role of cover crop diversity in
weed suppression, through comparing eight cover crop mixes that varied in species diversity,
functional diversity, and composition. Mixes contained either one, four or eight species, in equal
proportions. Three mixes contained only cereal species, three contained only legumes, and two
contained a mix of cereals, legumes and brassicas. Research was conducted on two farms in
South Africa’s winter rainfall region, replicated over two years. Indicators of resource uptake by
each mix in terms of light, soil nitrogen and water were measured at three time points throughout
the season, approx. 50, 85 and 110 days after establishment (DAE). Aboveground biomass (dry
weight) of cover crops and weeds within each mix was measured twice, at approximately 70 and
120 DAE. Regression analyses indicated that cover crop biomass was key to resource uptake
strongest influence on weed biomass. Neither species diversity nor functional diversity affected
resource uptake or weed suppression by cover crops. These results indicate that it is important
to consider the competitiveness of individual species when designing cover crop mixes. Diverse
mixes remain valuable to perform multiple functions, but may contribute to weed problems if
composed of poorly competitive species.
Introduction
Cover crops, defined as crops planted for a purpose other than harvest, are integrated into
cropping systems to achieve a variety of goals. Cover crops can be used to conserve and
enhance soil quality, provide resources to biodiversity, break pest and disease cycles, and
suppress weeds (Snapp et al 2005, Blanco-Canqui et al 2015). Recently, cover crops comprising
mixes of different species have become popular, as combining species with different properties
creates a single crop that can perform multiple functions (Storkey et al 2015, Finney et al 2017).
Combining multiple species may also increase the capacity of a cover crop to perform individual
functions. This concept has not yet been extensively tested in cover crops, and there is mixed
evidence so far (e.g. Döring et al 2012a, Finney et al 2016). However, in general, increased plant
diversity is known to be associated with increased provision of several specific ecosystem
functions (Isbell et al 2017), including productivity (Tilman et al 2012), soil carbon storage (Lange
et al 2015), nutrient cycling (Oelmann et al 2011) and the support of further biodiversity
(Scherber et al 2010). Diversity is thought to increase the magnitude and resilience of an
ecosystem function because each species performs the function in a different way, or at different
rates under different conditions, leading to a higher overall capacity to consistently perform the
function (Díaz and Cabido 2001, Isbell et al 2011). Functional diversity (the diversity of species’
traits that influence ecosystem functioning; Tilman 2001) is considered to have a stronger effect
on ecosystem functioning compared with species diversity. Functionally different species are
more likely to have distinct strategies (distinct niches) to perform the function, so their strategies
are more likely to be complementary rather than overlapping, and lead to greater functioning
(Díaz and Cabido 2001).
One function of cover crops that has potential to be improved by increased diversity is weed
suppression. Cover crops primarily suppress weeds by competing with them for resources
(although allelopathy can also play a role; Blanco-Canqui et al 2015). Thus, combining different
species that acquire resources from their surrounding environment in different ways could result
concept has been explored in invasion ecology, where it was first put forward by Elton (1958)
and forms a central pillar of the ‘biotic resistance’ or ‘diversity-invasibility’ hypothesis (Richardson
and Pyšek 2006, Jeschke 2014). Biotic resistance can be defined as a resident community’s
capacity to resist invasion by alien species, and in the context of plant communities, diversity
may contribute in two ways (Shea and Chesson 2002, Funk et al 2008). First, according to the
niche differentiation hypothesis, the additive effect of each species acquiring resources in
different ways could result in more efficient overall resource capture. Second, the sampling effect
hypothesis states that a diverse community would be more likely to contain a few species that
are particularly effective at resource capture, thereby lowering overall resource availability and
reducing opportunities for invasion. The sampling effect may also manifest as an increased
likelihood of limiting similarity, where the community contains species that use resources in
similar a fashion to the invader, and these species are thus more likely to suppress the invader
through competitive exclusion (limiting similarity) (Funk et al 2008).
Empirical support for a positive relationship between species diversity and biotic resistance via
either niche differentiation, limiting similarity and/or the sampling effect has been inconsistent
(Levine and D’Antonio 1999, Jeschke 2014). The current consensus in the literature is that
diversity can play a role, but its effect is often obscured by other variables such as abiotic
disturbance and fluctuating resource availability (Richardson and Pyšek 2006). Several authors
have noted a scale-dependent pattern, where resident diversity increases biotic resistance at
small spatial and temporal scales, but at landscape scales and over decades resident diversity is
often the result of high resource availability and frequent resource fluctuations, conditions that
also promote invasion by alien species (Levine 2000, Nunez-Mir et al 2017). However, the
findings that diversity can increase resistance at small scales suggests that the principle could be
applied to increase cover crop suppression of weeds at the scale of a farm field.
Few studies so far have investigated the relationship between the diversity of cover crop mixes
and their capacity for weed suppression, and their findings have been inconsistent. Some
Döring et al 2012a), while others suggest that the biomass produced by a cover crop is the main
predictor of weed suppression, and that diversity does not play a role (Brennen and Smith 2005,
Smith et al 2014, Smith et al 2015, Finney et al 2016). These latter studies suggest that whilst
the sampling effect may play a role in natural systems by increasing the chances that a
particularly competitive species will be present, in agricultural systems we could simply choose to
sow the most competitive species, or pick the species most likely to suppress locally abundant
weeds through limiting similarity.
Another potential role of cover crop diversity in weed management is that diverse cover crops
may help to promote a more beneficial weed community. Although weeds are considered
primarily detrimental to crop production, weeds can benefit agroecosystem functioning by
supporting other beneficial organisms (Petit et al 2011), and the provision of this service is
expected to be higher when the weed community is more diverse (in this context, a low
abundance of diverse weeds could perhaps be considered an unplanned but nonetheless
beneficial component of a cover crop). A study by Palmer and Maurer (1997) indicated that
diverse cover crop mixtures may promote weed diversity, possibly through the creation of diverse
microhabitats and/or by combining different crops that promote or facilitate different groups of
weeds. However, a more recent trial by Smith et al (2015) found no evidence for such a
relationship.
Overall, there is a promising theoretical basis that increasing cover crop diversity could improve
weed management, but inconsistent results from previous studies indicate a need for further
experimental evidence. To investigate how cover crop diversity influences weed abundance and
community composition, this paper presents a field trial designed to systematically test the
effects of different levels of both species diversity and functional diversity on weeds, and to
investigate whether any effect can be explained by increased resource capture. Specifically, we
(A) increased cover crop species diversity and/or increased cover crop functional
diversity increases weed suppression;
(B) the capacity of a cover crop mix to suppress weeds can be explained by its ability to
capture resources;
(C) specific cover crop functional types are more effective at suppressing weeds of
comparable functional types;
(D) a more diverse cover crop mixture promotes a more diverse weed community;
(E) cover crops that are more effective in weed suppression result in higher cash crop
yields in the following year.
2. Methods
2.1 Trial overview, location and layout
To test our five hypotheses, we designed a field experiment consisting of cover crop mixes that
differed in species diversity, functional diversity, and the functional types of species included in
the mix. We assessed the effect of each mix on overall weed biomass, and identified whether the
species diversity, functional diversity, composition or biomass of each cover crop mix best
explained the effect on weed biomass (hypothesis A). To understand whether these cover crop
mix characteristics influenced weed biomass through reducing resource availability to weeds, we
explored how cover crop characteristics related to the availability of light, moisture and nitrogen
throughout the season, and also investigated whether or not weed biomass responded to the
availability of these resources (hypothesis B). To assess whether limiting similarity played a role
(hypothesis C) we explored whether different cover crop functional types reduced the biomass of
weeds of similar functional types to a greater degree. We also investigated whether weed
species diversity increases as cover crop diversity increases (hypothesis D). Lastly, to assess
mixes and their ability to suppress weeds was linked to cash crop yields in the following year
(hypothesis E).
The trial took place on two farms in South Africa’s Western Cape winter rainfall region,
Langgewens (33°17'0.78"S, 18°42'28.09"E) and Tygerhoek (34° 9'31.76"S, 19°54'36.77"E)
Research Farms (Figure 1) of the Western Cape Government Department of Agriculture.
Langgewens receives an average annual rainfall of 408 mm (SD = 109 mm) of which
approximately 80% falls between April and September, while Tygerhoek receives an average
annual rainfall of 511 mm (SD = 101 mm) with approximately 60% falling between April and
September (based on rainfall records between 1996-2016). The dominant weed species at both
sites are Lolium species, with the local population thought to be a hybrid complex of L. rigidum,
L. multiflorum and L. perenne (Ferreira et al 2013). These research farms are representative of
field cropping systems in the region, where most farms follow conservation agriculture practices,
including no-tillage or minimum-tillage, crop rotation, and crop residue retention. The main crops
are winter cereals, canola (Brassica napus), and legume forages. Due to the annual rainfall
distribution, only one crop per year can be grown in the winter months, so a cover crop replaces
a cash crop. Vineyards and orchards are also major cropping systems in the Western Cape
winter rainfall region, and annual cover crops are used to protect soil and suppress weeds in
winter. Findings from this trial are applicable to both annual field crop and perennial fruit and
wine crop systems in the region.
The trial was laid out in randomised blocked design, with three blocks on each farm. Each
treatment plot was 4.2 m wide by 20 m long. At Langgewens, the blocks were located on three
separate fields that had been continuously cropped with wheat (Triticum aestivum) since 1996,
and the trials were surrounded by wheat. At Tygerhoek, all blocks were located in a single field
with a mixed cropping history and the field around the trial was left fallow. Cover crops were
sown directly into the residue of the previous year’s crop using a Kuhn Neo 13 no-tillage
double-disc planter (manufactured in Brazil), following typical practice in conservation agriculture
summer weeds, particularly from the knotweed Polyganum aviculare. In 2016, the trial at
Tygerhoek was planted on 11 May and at Langgewens on 18 May; in 2017 Tygerhoek was
planted on 3 May and Langgewens on 12 May. The first substantial rainfall of the season was
unusually late at both farms in both years (late May in 2016 and early June in 2017), so the trials
were planted into dry soil. In 2016, seedling emergence occurred approximately 15 days after
planting, and in 2017 approximately 25 days after planting. At the end of the season (late
September/early October), the cover crops were rolled using a roller-crimper to terminate their
growth and prevent them from setting seed (the effectiveness of this termination was not formally
assessed but will be considered in the discussion section). The roller-crimper used was
constructed by staff in the Western Cape Government Department of Agriculture.
In 2017, cash crops were also planted into the cover crop plots of 2016, to investigate the effects
of the mixes on subsequent yield, and whether any effects were linked to weed suppression
during the cover crop year. At Langgewens the cash crop was wheat, and forage oats (Avena
sativa) were used at Tygerhoek. The wheat was sown with a Piket Implements 20-row fine seed
planter (manufactured in South Africa) and the forage oats with the Kuhn Neo 13 (manufactured
in Brazil). Neither fertiliser nor herbicides were used throughout the season, to avoid obscuring
the impact of the previous cover crop treatments. The wheat grain at Langgewens was harvested
on 6th November 2017 (using a HEGE 140 combine plot harvester manufactured in Germany)
and oat biomass samples collected by hand at Tygerhoek on 25th October 2017. The oat grain
was not harvested at Tygerhoek as a forage cultivar was used, and thus the grain yield may not
be reflective of growth conditions.
2.2 Species selection and mix composition
The trial consisted of nine treatments: a weed fallow or ‘bare ground’ (BG) control where no
cover crops were planted, two monoculture controls (a single cereal, 1C; and a single legume,
1L), three four-species mixes (four cereals, 4C; four legumes, 4L; and a diverse mix, 4D), and
Treatments differed slightly between the two years of the trial. In the first year (2016), a total of
21 different species was used, and the HL and HD mixes contained 12 species each (Tables 1
and 2). In 2017, the number of species in the H mixes was reduced to eight: species that did not
establish well in 2016 were excluded from the trial in 2017. In 2016 not enough cereal species
could be obtained to create an HC mix (seed suppliers did not have these in stock), so this
treatment was only implemented in 2017. The HC mix included two rye (Secale cereale)
varieties, a spring variety and a stooling variety, in addition to six other cereal species. These two
varieties were suggested by local agronomists to vary in phenology and growth habit as much as
two different cereal species.
The selection of species to include in the trial was informed by common practices in the Western
Cape (the species used for the 1C and 1L mixes are typical cover crops) and on advice from
local experts, including government agronomists and commercial seed suppliers. Sowing rates
were also based on advice from local experts. To create the mixes, the recommended sowing
rate was divided by the proportion of the mix made up by each species; for example, in a four
species mix, each species was sown at 25% of its recommended sowing rate (Table 1).
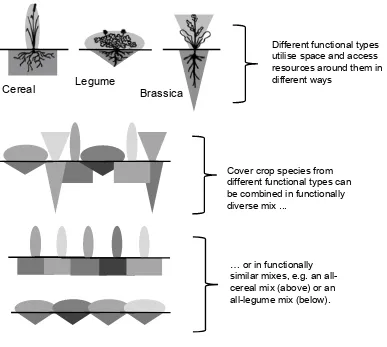
The functional diversity investigated in this study was diversity in spatial resource capture
strategy: the species included differed in their growth forms and root architectures. Although
plants do not compete for space per se, plants compete for the resources within a space (Booth
et al 2003), and thus a group of plants capable of more completely occupying the
three-dimensional space around them would be expected to deplete resources more uniformly from
that space and thus more effectively reduce resource availability to weeds. Specifically, diversity
in growth form was expected to allow the cover crops to create a more complete canopy cover to
restrict light availability to weeds, and diversity in root architecture to allow the cover crop to
more effectively deplete the soil of moisture, nitrogen and other key nutrients (Figure 2).
Species were divided into the functional types of ‘cereal’, ‘legume’, ‘brassica’ and ‘other’. These
strategies to acquire resources from that space (Figure 2). All cereal species included in the trial
had a tufted, upright growth form and fibrous roots. Most legumes had prostrate or spreading
growth forms, with a taproot and spreading lateral roots (with the exception of lupins, included in
2016 only, which had a more upright growth form). The two brassica species (white mustard and
forage radish) had upright growth forms and deep taproots, while the ‘other’ consisted of chicory)
in 2016 and flax in 2017 (this substitution was made given the very poor establishment of chicory
in 2016). Chicory forms a rosette with a deep taproot, while flax has a shallow root system and
slender upright growth form. In accordance with limiting similarity, cover crops with specific
growth forms and root architectures were expected to suppress weeds with similar growth forms
and root architectures, given that they are more likely to compete for resources within the same
space. Weeds were divided into functional types that corresponded with those of the cover
crops: ‘grasses’ (similar root architecture and growth form to cereals), ‘short or prostrate herbs’
(similar to legumes), and ‘tall upright herbs’ (similar to brassicas).
2.3 Data collection
2.3.1 Cover crop and weed biomass, diversity and composition
Aboveground dry-weight biomass of both cover crops and weeds was sampled twice in each
year of the trial, once at ‘mid-season’ approximately 65 days after emergence (DAE) and once at
‘end-season’ approximately 140 DAE (just prior to termination). Biomass was not sampled prior
to 65 DAE as competition between crops and weeds was not expected to be strong while plants
were small and resources therefore not limiting (in the region, crop growth is typically slow in the
cold winter months of June and July and begins to increase in August). A 0.5-m2 biomass sample
was cut from each plot, from two 0.25-m2 sub-samples located a random number of paces from
each end of the plot (placed either to the left or right to avoid cutting the same area in both
sample events). To determine botanical composition, biomass was sorted into each species of
For both cover crop and weed species diversity and functional diversity we used the Shannon
index (Magurran 2004) based on the biomass of each species:
―
∑
𝑖
𝑝𝑖ln𝑝𝑖
where p is the proportion of biomass in species i. For functional diversity, the Shannon index was
calculated using the biomass of each of the four functional types of cereal, legume, brassica and
chicory/flax, and the matching weed functional types of grasses (cf. cereals), short/prostrate
herbs (cf. legumes), and tall upright herbs (cf. brassicas). The Shannon index was used because
it is relatively sensitive to the presence of rare species, and the weed community in the trial
locations was largely dominated by Lolium spp. (Magurran 2004). Mix composition was
determined by the biomass of the different functional types in each sample, for both weeds and
cover crops.
2.3.2 Resource availability and capture
To investigate resource use by different cover crop mixes, we measured soil gravimetric water
content, total mineral nitrogen, and percent of the ground covered by cover crops and by weeds
(canopy cover), in each plot at three points throughout the season: approximately 50, 85 and 110
DAE. At each time point, four soil cores of a 4-cm diameter and 10-cm depth were taken from
each plot and combined to form a representative soil sample. These soil samples were weighed
wet, then dried at 60˚C for at least 72 hours, then weighed again to obtain the gravimetric water
content. These samples were then tested for ammonium and nitrate content following
indophenol-blue test (Keeney and Nelson 1982) and the salicylic acid method (Cataldo et al
1975), respectively. These two values were added together to obtain a value for total mineral
nitrogen.
Canopy cover was visually estimated according to the Domin scale (Kent 2011) in three 1-m2
quadrats in each plot, that were in fixed positions throughout the season to ensure biomass was
the edge (to avoid edge effects) on alternating sides of the plot; this meant quadrats were not
disturbed during soil sampling down the centreline of the plots. Domin cover estimates were
converted to the midpoint of each cover score (Lepš and Hadincová 1992), then these midpoints
from the three quadrats were averaged to one representative value for each plot. Estimates were
made by the same person to avoid observer bias.
In 2016, soil samples taken on the date of sowing in late April and again just prior to harvest in
late September (one representative sample per plot per time point) were also tested for
extractable phosphorus and sulphur, exchangeable calcium, magnesium and potassium, copper,
zinc, manganese and boron content, according to methods set out by the Non-Affiliated Soil
Analysis Work Committee (1990). These measurements were used to calculate differences in
the soil nutrient content between the beginning and end of the season, to explore whether any
treatments used more or less of each mineral, and thus to infer whether they may have played a
role in competition between weeds and cover crops.
2.3.4 Subsequent cash crop year
Just prior to cash crop planting (in late April 2017) and at approximately 80 DAE for each cash
crop, ground cover by cover crop and weed residue from the previous year was visually
estimated in each plot (using the average of Domin estimates of two 1 m2 randomly located
quadrats). Also during the April pre-planting assessment, four soil cores (4-cm in diameter,
10-cm deep) were collected and combined to form a representative sample, then tested for total
mineral nitrogen (as in Section 2.3.2).
In November, wheat grain from each plot at Langgewens was harvested using a plot combine
harvester, with only a central 1m strip in each plot harvested to avoid edge effects. The grain
was weighed to obtain a yield value in kg ha-1 (wet grain weight was standardized to 14%
moisture). Final oat biomass samples were cut at Tygerhoek from three 0.25-m2 quadrats
representative sample for each plot. Oat biomass was separated from weed biomass, dried at
60˚C for 72 hours, and weighed.
2.4 Data analysis
All analyses were undertaken in the software R, version 3.4.3 (R Core Team, 2017). To detect
differences between mid and end-season weed and cover crop biomass, composition, species
diversity and functional diversity, type III analysis of variance (ANOVA) F tests on linear mixed
effects regression models fitted with restricted maximium likelihood (REML) using Satterthwaite
approximations for degrees of freedom (R package lmerTest) (Bolker et al 2008). For all models,
block nested within farm and block nested within year were included as random intercept effects,
and the relevant predictors for each hypothesis were included as fixed effects. Post-hoc pairwise
comparisons were conducted from estimated marginal means using the Tukey adjustment (R
package emmeans). Marginal and conditional R2 values for all models are provided in the results
as an indication of how well variation in the data is described by both fixed and random effects in
each model (R package MuMIn) (Nagasaka and Schielzeth 2014). The marginal R2 indicates the
proportion of variance explained by the fixed effects, while the conditional R2 indicates variance
explained by the entire model including both fixed effects and random effects.
Prior to analyses, all explanatory and response variables were standardised by subtracting the
dataset mean and dividing by the standard deviation, so increase ease of interpretability of the
relative effects of different variables (Schielzeth 2010). All models were checked to ensure they
fulfilled assumptions of normality and equal variance by assessing trends in the residuals, and
where necessary log transformations were used to correct for these. Models were also checked
for influential outliers; any issues are reported in the results.
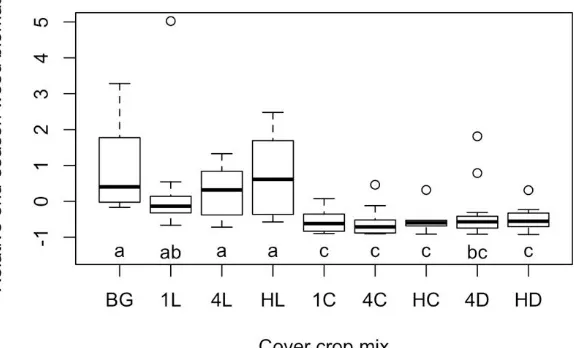
Differences between treatments are visualised using boxplots calculated in R’s graphics
package. The centre band shows the group median, the box represents the interquartile range,
range on each side of the mean, where minimum and maximum values exceed this. Points
indicate outliers that are more than 1.5 times the interquartile range away from the mean. Letters
shown on the boxplots indicate pairwise differences according to the post-hoc comparisons (see
above): treatments that are different to one another do not share a letter.
For those cover crop characteristics found to differ (P<0.05) between mixes, mixed effects linear
regression models following the above procedure were then used to explore whether these were
linked to differences in weed biomass (hypothesis A), and to resource levels: soil nitrogen
content, moisture content, and cover crop canopy cover at different points throughout the
season, and with differences in soil mineral levels between the start and end of the season. We
also investigated whether weed biomass was related to these resource levels (hypothesis B). To
explore limiting similarity (hypothesis C) we modelled whether the amount of each functional type
of weed varied proportionally in response to the amount of different cover crop functional types in
each mix, and we also tested whether weed diversity was linked to cover crop diversity
(hypothesis D). To investigate cash crop yields in the subsequent years (hypothesis E), ANOVA
and Tukey’s HSD were employed to test for differences between mixes, and regression models
used to explore relationships between cover crop biomass and weed biomass in the cover crop
year, residue cover at the start of the cash crop year, mid-season weed cover during the cash
crop year, and cash crop yield. Relationships between these continuous variables are graphically
presented using the functions of R’s effects package.
3. Results
3.1 Weed suppression by different mixes
Lower final weed biomass was observed in the cereal and diverse mixes compared with most
all cereal and diverse mixes, whilst none of the legume mixes had fewer weeds than the
bareground control.
3.2. Diversity, composition and productivity of different mixes
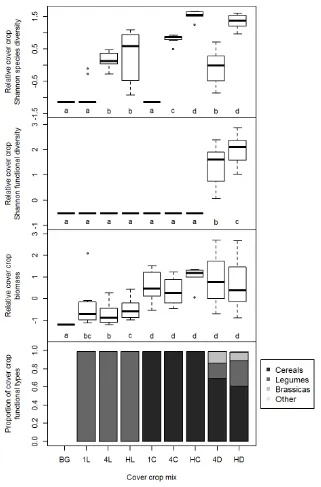
The species diversity (Shannon index) of the cover crop mixes was as intended: the controls had
low relative diversity, the four-species mixes had an intermediate diversity, and the high species
mixes had a higher diversity (Figure 4a; ANOVA F = 95.11, P < 0.001). However, the HL mix did
not have a higher diversity than the 4-species mixes, as many of the legume species did not
establish well, whilst the 4C mix had higher diversity than both other four-species mixes, and the
HL mix. The Shannon index of functional diversity confirms that the 4D mix and HD mix were the
only two mixes containing functional diversity, and furthermore that the HD mix had a higher
functional diversity than the 4D mix (Figure 4b; ANOVA F = 116.95, P < 0.001). Biomass
production differed substantially among mixes, with the cereal and diverse mixes producing more
cover crop biomass than the legume mixes (Figure 4c; ANOVA F = 142.24, P < 0.001). The
composition of the mixes varied as intended, with legume (L) mixes containing only legumes and
cereal (C) mixes containing only cereals. The diverse mixes contained a mixture of cereals,
legumes and brassicas, but their cereal components tended to be over-represented (Figure 4d).
3.3 Mix characteristics and weed suppression
Of the cover crop characteristics of species diversity, functional diversity, composition and
biomass production, both total biomass production and the proportion of cereal biomass were
associated with a reduction in weed biomass (P<0.05, Table 3, Figures 5a and 5b). Weed
biomass was log-transformed to reduce unequal variance in model residuals. The cover crop
composition variables of cereal, legume and brassica proportional biomass were collinear with
one another (variance inflation factor > 2.5), and were not included in the same model. Including
cereal biomass resulted in the best model fit (lowest AIC), and so results from the model
as fixed effects are reported (Table 3). Increasing the proportion of brassica biomass had a
similar effect to increasing the proportional of cereal biomass, resulting in reduced weed
biomass, while increasing the proportion of legume biomass had the opposite effect and was
linked to increased weed biomass (results not shown).
3.4 Mix characteristics and resource capture
Overall, the two cover crop characteristics associated with weed suppression, total cover crop
biomass and the proportion of cereals, explained only a small amount of variance in nitrogen and
moisture availability within the experiment (Table 4). The majority of variance was explained by
differences between experiment blocks, farms and years. However, mixes containing a higher
proportion of cereals did reduce nitrogen and moisture availability slightly at 50 DAE (Table 4,
Figure 6). Further nitrogen and moisture capture later in the season may have been obscured as
rainfall increased, which raises soil moisture and thus also stimulates the release of nitrogen
through mineralisation of crop residue and soil organic matter. However, by 110 DAE cereal
biomass proportion had a small but significant positive relationship with moisture availability
(Table 4), suggesting that mixes containing more cereals were using less moisture toward the
end of season.
Higher total cover crop biomass was associated with increased canopy cover throughout the
season, although with stronger effects at 85 and 110 DAE (Table 4, Figure 6c). Mixes with more
cereals also had a slightly higher canopy cover at 85 DAE (Table 4). None of the soil minerals
measured apart from nitrogen were observed to decrease in response to cover crop biomass or
composition (results not shown), indicating that the capacity of cover crops to suppress weeds
was not related to the capture of any of these minerals. Overall, these results suggest that more
productive cover crop mixes were more able to capture light throughout the season, and mixes
with a higher cereal content were additionally able to capture more nitrogen and moisture early in
3.5 Weed biomass and resource availability
Resource availability at 50 DAE was used to predict the increase in weed biomass from
mid-season to end-mid-season, to assess whether more weed biomass was produced where more
resources were available. Weed biomass increased most where nitrogen was highest and where
cover crop canopy was lowest at 50 DAE (Table 5), indicating that nitrogen and light availability
allowed weeds to be more productive. The resource availability model predicted 20% of the
observed variation in weed biomass between plots, with random location effects explaining
another 50% of the variation (Table 5).
3.6 Limiting similarity and weed diversity
Thirty-six weed species were recorded in this study (Table 6). The weed community was
overwhelmingly dominated by Lolium spp., which contributed 67% of total weed biomass in this
study, across both farms and years. Proportions of different weed functional types did not vary
(P>0.05) in response to variation in the proportion of their corresponding cover crop functional
types (results not shown), indicating that limiting similarity in terms of spatial resource capture
traits did not occur. Cover crop diversity also did not increase weed diversity, either in terms of
species or functional diversity (P>0.05, results not shown).
3.7 Cover crop effects on cash crop yield in the following year
There were no effects of cover crop biomass or composition on conditions at the start of the
subsequent cash crop season, in terms of soil mineral nitrogen, cover crop residue or weed
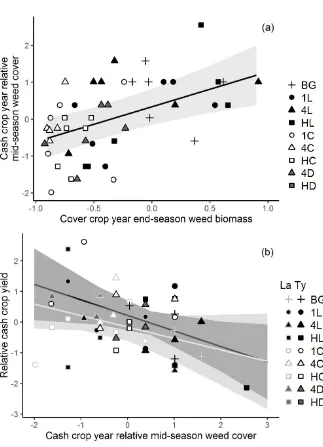
cover (results not shown). However, weed cover in the middle of the cash crop season was
higher where weed biomass at the end of the cover crop year was higher (P<0.05), and where
cover crop biomass and cereal proportion were lower (P<0.05) (Table 7). Cash crop yield was
not affected by start-of-season nitrogen, residue or weeds (P>0.05, results not shown), but was
Tygerhoek than on wheat grain yield at Langgewens (Table 8, Figure 7). The two were modelled
separately due to the different types of crops grown at each site.
4. Discussion
4.1 Cover crop diversity, resource capture, weed suppression and weed diversity
This study confirms that cover crops can be effective in suppressing weed biomass through
reducing the availability of resources to weeds. However, neither species diversity nor functional
diversity (in terms of the spatial resource capture traits explored in this study) increased the
efficacy of cover crops in this regard (hypotheses A and B). There was also no evidence to
suggest that cover crops with a particular growth form and root architecture suppressed weeds
with comparable traits, and thus no evidence for limiting similarity (hypothesis C), nor any
evidence that diverse cover crop mixes promoted weed diversity (hypothesis D). Our results
indicate that the cover crop mixes composed mostly or entirely of cereals produced more
biomass, captured more resources, and suppressed more weed biomass.
These findings agree with previous trials of cover crops that found that species able to produce a
large quantity of biomass quickly are most capable of suppressing weeds (Palmer and Maurer
1997, Brennan and Smith 2005, Storkey et al 2011, Brust et al 2014, Smith et al 2014, Smith et
al 2015), and that diversity does not necessarily result in increased function in this regard
(Finney et al 2016). Additionally, recent studies on biotic resistance to alien plant invasions
suggest that fitness differences between resident species and invaders determine resistance to a
greater extent than resident diversity, or the functional similarity of dominant resident species to
the invader (Byun et al 2013, Funk and Wolf 2016). In the context and conditions of this study,
cereal and brassica species were most capable of capturing resources and producing biomass
However, some studies of cover crop mixes have found an increased ability of diverse mixes to
suppress weeds (Linares et al 2008, Döring et al 2012a), and several studies on plant invasions
have found some evidence that functional group diversity increases resistance to invasion at
scales comparable with this study, albeit less so than the fitness of dominant resident species
(Richardson and Pyšek 2006, Byun et al 2013). It is possible that this effect of diversity would be
seen in cover crops if all species included in a diverse mix are adequately competitive. This idea
is supported by the findings of Wortmann et al (2012) and Smith et al (2014) that cover crop
mixes typically have a Land Equivalent Ratio > 1, producing more biomass than can be
accounted for by the productivity of each species grown in monoculture. Therefore, creating
mixes containing only highly productive species may result in more effective weed suppression
than a monoculture, whilst also increasing opportunities for cover crops to perform multiple
functions through diversity. In this study both functionally diverse mixes contained at least two
legume species, which produced substantially less biomass than the cereal and brassica
species, and may therefore have negated any effect of diversity.
Previous trials on diverse cover crops and forage crops suggest that functional diversity in terms
of phenology, rather than the spatial resource capture traits tested in this study, may be more
important to weed suppression (Porqueddu et al 2008, Döring et al 2012b, Finn et al 2013). In
this regard, it is the capacity of different species to capture resources and produce biomass at
different points in the season (or in subsequent years in long-term leys) that results in greater
overall weed suppression. This suggests that if limiting similarity does occur between crops and
weeds, it may also be a largely phenological phenomenon, and that crops and weeds with high
simultaneous resource demands may be most likely to compete with one another.
4.2 Differences between cover crop types
The cereal species included in this study were found to suppress weeds more effectively than
the legume species (the brassicas and ‘other’ species were included in too few treatments to
cereal cover crops a fitness advantage over weeds was rapid nitrogen, moisture and light
capture early in the season, followed by restricting light availability to weeds later in the season.
However, the availability of these resources could only explain approximately 20% of the
variation in weed biomass between mixes (with a further 50% in variation linked to site and year
effects), suggesting that competition for other resources, or allelopathy, may also have played a
role in causing the remaining variation. There is evidence from other studies that several of the
cover crop species included in this trial, particularly the cereals, are allelopathic (Jabran et al
2015, Rueda-Ayala et al 2015). Thus, it is plausible that cover crops suppressed weeds through
both allelopathy and competition for resources. It is also possible that legumes confounded the
suppressive effects of cereals through a facilitative effect on weeds: although most nitrogen fixed
by legumes becomes available in the following season as their residues decompose, some
nitrogen can be transferred from legumes to other plants within the first growing season
(Pirhofer-Walzl et al 2012). However, given the overall low biomass produced by legumes, it is
expected that any facilitative effect would be small.
The faster resource uptake and greater weed suppression of cereals compared with legumes
was linked to differences in biomass production. This may be explained by life-strategy
differences between these two crop types, with cereals appearing to have a ‘faster’ life strategy
(Reich 2014) than legumes, which may have been enhanced by breeding for yield and
competitiveness. Typically, plant species with a faster growth rate invest fewer resources in
resilience to stress and disturbance, and thus would be capable of using those resources to
produce more biomass to further enhance resource uptake (Garnier and Navas 2012, Reich
2014). Legumes may be constrained in their growth relative to cereals due to the need to direct
sugars to feed their rhizobial mutualists and by investment in mechanisms that allow them to
recover from grazing, as many of the legume species included in this trial were forage species.
However, a study by Tribouillois et al (2015) on cover crop traits found no evidence to suggest
that cereals inherently grow faster or capture more nitrogen than legume crops in conditions of
legumes compared with cereals, brassicas and weeds. Sowing depth may have been a
constraint: in this trial the disc planter placed the seeds at approximately 15 mm below the soil
surface, which is considered shallow for cereals but deep for legumes, apart from the
larger-seeded legumes (vetch and pea), which typically performed better. The weather conditions
during the trial may also have played a role, with the first rainfall arriving later into winter in both
years than is usual for the region. Legume varieties used in the region may not have been bred
to tolerate such low soil temperatures when sufficient moisture becomes available for
germination and establishment. Thus, we would not conclude from this study that cereal cover
crops would always outperform legumes in competition against weeds.
4.3 Weeds and resource availability
That we were able to predict a substantial proportion of variation in weed biomass based on
resource availability confirms the need to consider resource uptake capacity when choosing
which species to include in a mix. In this regard, a cover crop’s capacity to produce biomass is
an important trait of interest, as shown in this study and confirmed by other trials of weed
suppression by cover crops (Palmer and Maurer 1997, Brennan and Smith 2005, Storkey et al
2011, Brust et al 2014, Smith et al 2014, Finney et al 2016). The timing of that productivity may
also be important (Döring et al 2012b, Finn et al 2013), but was not investigated in this trial. Our
results also indicate that the functional type of the cover crop may play an additional role to
biomass production, given that both cover biomass and cereal proportion were associated with
reduced weed biomass. This suggests that different types of crops capture more resources per
unit biomass, which is supported by our finding that a higher proportion of cereal cover crops
was linked to a decrease in nitrogen, but total cover crop biomass was not (Table 4). It is also
possible that certain crop types increase their competitiveness through other tactics such as
allelopathy.
The weed response to resource availability observed in this study also has implications for other
weeds should be considered and reduced wherever possible. The finding is also relevant to
breeding of both cover crops and cash crops: rapid early growth and resource capture may be
the best defence against weed competition throughout the season.
4.4 Cover crops, weeds, and cash crop yield in the following year
This study suggested a weak link between cover crop performance in weed suppression and
subsequent cash crop yield, mediated by reduced weed cover following productive cover crops
(hypothesis E). That a stronger effect on yield was not observed may have been partially related
to several of the most weed-suppressive cover crop species (the cereals) returning as volunteer
weeds in the subsequent cash crop, thus countering their contribution to weed suppression.
Cover crop mixes present a challenge for non-chemical termination, as the roller-crimper
technique is only effective in a short time window when cover crop plants are mature enough to
be vulnerable, but have not yet set seed, and this time window may not overlap between all
species in a mix. This effect may have allowed the cereals in this trial to either produce viable
seed before termination, or recover to set seed afterwards.
There are also other characteristics of cover crops that contribute to subsequent cash crop yields
aside from weed suppression (Snapp et al 2005, Blanco-Canqui et al 2015, Wittwer et al 2017).
The addition of nitrogen to the soil by legumes is an important factor (Bedoussac et al 2015), and
thus what the legume mixes lacked in weed suppressive capacity they may have made up for by
providing nitrogen, or by reducing pathogen survival. Although soil nitrogen content at the start of
the cash crop season was not associated with cash crop yield, further nitrogen may have been
released to the cash crop from legume residues throughout the season.
4.5 Implications for design of cover crop mixes
The results of this study indicate that the recent enthusiasm for diverse cover crop mixes should
key functions effectively. In this regard, our results agree with those of Storkey et al (2015) who
found that cover crop mixes best achieve their desired functions when species are included that
each perform a specific function well. Finney et al (2016) suggest that biomass-driven functions
of cover crops, such as weed suppression, are best achieved by selecting the most productive
species rather than basing mixes on functional complementarity.
A diverse cover crop mix can offer advantages to farmers in terms of their capacity to perform
multiple functions, such as building soil organic matter, fixing nitrogen, and supporting beneficial
insects (Malézieux et al 2009, Isbell et al 2017, Finney et al 2017). Therefore, rather than
avoiding diversity for the sake of weed suppression, we recommend that multi-species mixes are
composed with a strong emphasis on the competitive ability of each species included in the mix.
This will ensure that diverse cover crop mixes planted for the purpose of providing multiple
functions can also adequately suppress weeds. It is important that cover crop mixes
recommended to farmers do not promote weeds, and thus risk discouraging farmers from using
cover crops, given the advances in agricultural sustainability offered by cover crops (Anderson
2015, Wittwer et al 17). Future research on improving cover crop mixes for weed suppression
could therefore focus on the identification of highly productive (and therefore weed-suppressive)
cover crop species and cultivars from a variety of plant families that could be combined in
multispecies mixes that are appropriate to the farming systems in question. For example, our
finding that cereals and perhaps brassicas are the most effective weed-suppressing cover crops
in the Swartland and southern Cape of South Africa is not the most practical recommendation for
the region’s farmers, whose main cash crops are wheat, barley and canola. Closely related cover
crop species run the risk of bridging pests and pathogens between cash crop years (Krupinksy et
al 2002), and avoiding legumes leaves farmers burdened with the environmental and economic
costs of synthetic nitrogen fertiliser (Bedoussac et al 2015). Research on identifying and
developing new cover crops is ongoing in central Europe (eg. Brust et al 2014,
Thorup-Kristensen and Rasmussen 2015), but similar efforts will be needed in other regions to develop
Acknowledgements
We thank the Western Cape Department of Agriculture for providing space and facilities on the
Langgewens and Tygerhoek Research Farms, and we are grateful for the advice and assistance
from Johann Strauss, Samie Laubscher, and Willie Langenhoven. Thanks also to the research
farm staff who assisted with the trials, and to all staff and students from the Stellenbosch
University Agronomy Department who contributed to fieldwork and sample processing. Jaco
Kellerman of Barenbrug and Simon Hodgson of Advance Seed advised on species selection,
and Advance Seed and Overberg Agri donated some seed. This study was financially supported
by the EcoDry Project (612686 FP7-PEOPLE-2013-IRSES), and CM is the recipient of a
Coventry University Doctoral Studentship.
Author contributions
CM designed the study with contributions all authors. CM undertook the data collection and
analysis with advice and assistance from PS, and CM drafted the article. All authors contributed
to critically revising and improving the article.
Conflicts of interest: none.
References
Anderson, R.L., 2015. Integrating a complex rotation with no-till improves weed management in
organic farming. A review. Agron. Sustain. Dev. 35, 967–974.
https://doi.org/10.1007/s13593-015-0292-3
Bedoussac, L., Journet, E., Hauggaard-Nielsen, H., Naudin, C., Corre-Hellou, G., Jensen, E.S.,
legume intercrops in organic farming. A review. Agron. Sustain. Dev. 35, 911–935.
https://doi.org/10.1007/s13593-014-0277-7
Blanco-Canqui, H., Shaver, T.M., Lindquist, J.L., Shapiro, C.A., Elmore, R.W., Francis, C.A.,
Hergert, G.W., 2015. Cover crops and ecosystem services: insights from studies in
temperate soils. Agron. J. 107, 2449–2474. https://doi.org/10.2134/agronj15.0086
Booth, S., Murphy, S.D., Swanton, C.J., 2003. Weed ecology in natural and agricultural systems.
CABI Publishing.
Bolker, B. M., Brooks, M. E., Clark, C. J., Geange, S. W., Poulsen, J. R., Stevens, M. H. H., &
White, J. S. S. (2008). Generalized linear mixed models: a practical guide for ecology and
evolution. Trends Ecol Evol 24, 127–135. https://doi.org/10.1016/j.tree.2008.10.008
Brennan, E.B., Smith, R.F., 2005. Winter Cover Crop Growth and Weed Suppression on the
Central Coast of California. Weed Technol. 19, 1017–1024.
https://doi.org/10.1614/WT-04-246R1.1
Brust, J., Claupein, W., Gerhards, R., 2014. Growth and weed suppression ability of common
and new cover crops in Germany. Crop Prot. 63, 1–8.
https://doi.org/10.1016/j.cropro.2014.04.022
Byun, C., Blois, S. De, Brisson, J., 2013. Plant functional group identity and diversity determine
biotic resistance to invasion by an exotic grass. J. Ecol. 101, 128–139.
https://doi.org/10.1111/1365-2745.12016
Cataldo, D., Haroon, H., Schrader, L., Young, V., 1975. Rapid colorometric determination of
nitrate in plant tissue by nitrate of salicylic acid. Commun. Soil Sci. Plant Anal.71–80.
Diaz, S., Cabido, M., 2001. Vive la difference: plant functional diversity matters to ecosystem
processes: plant functional diversity matters to ecosystem processes. Trends Ecol. Evol. 16,
Döring, T.F., Baddeley, J.A., Storkey, J., Crowley, O., Howlett, S.A., McCalman, H., Pearce, H.,
Roderick, S., Jones, H.E., 2012b. Legume based plant mixtures for delivery ecosystem
services: an overview of benefits. Agric. Environ. IX, Valuing Ecosyst. Policy, Econ. Manag.
Interact. 150–155.
Döring, T.F., Storkey, J., Baddeley, J.A., Crowley, O., Howlett, S.A., McCalman, H., Pearce, H.,
Roderick, S., Jones, H.E., 2012a. Legume based plant mixtures for delivery of multiple
ecosystem services: weed diversity and weed control. Agric. Environ. 9, 163–168.
Elton, C.S. 1958: The ecology of invasions by animals and plants. Chicago: University of
Chicago Press.
Ferreira, M. I., Reinhardt, C. F., Lamprecht, S. C., Sinclair, M., MacKenzie, L., & van Coller, G.
(2015). Morphological identification of the ryegrass hybrid Lolium multiflorum× Lolium
perenne and isolation of the pathogen Fusarium pseudograminearum in the Western
Cape. South African Journal of Plant and Soil, 32(1), 9-15.
Finn, J.A., Kirwan, L., Connolly, J., Sebastia, M.T., Helgadottir, A., Baadshaug, O.H., Bélanger,
G., Black, A., Brophy, C., Collins, R.P., Cop, J., Dalmannsdóttir, S., Delgado, I., Elgersma,
A., Fothergill, M., Frankow-Lindberg, B.E., Ghesquiere, A., Golinska, B., Golinski, P., Grieu,
P., Gustavsson, A.M., Höglind, M., Huguenin-Elie, O., Jørgensen, M., Kadziuliene, Z., Kurki,
P., Llurba, R., Lunnan, T., Porqueddu, C., Suter, M., Thumm, U., Lüscher, A., 2013.
Ecosystem function enhanced by combining four functional types of plant species in
intensively managed grassland mixtures: a 3-year continental-scale field experiment. J.
Appl. Ecol. 50, 365–375. https://doi.org/10.1111/1365-2664.12041
Finney, D.M., Murrell, E.G., White, C.M., Baraibar, B., Barbercheck, M.E., Bradley, B.A.,
Cornelisse, S., Hunter, M.C., Kaye, J.P., Mortensen, D.A., Mullen, C.A., Schipanski, M.E.,
2017. Ecosystem services and disservices are bundled in simple and diverse cover cropping
Finney, D.M., White, C.M., Kaye, J.P., 2016. Biomass production and carbon/nitrogen ratio
influence ecosystem services from cover crop mixtures. Agron. J. 108, 39–52.
https://doi.org/10.2134/agronj15.0182
Funk, J.L., Wolf, A., 2016. Testing the trait-based community framework: do functional traits
predict competitive outcomes? Ecology 97, 2206–2211. https://doi.org/10.1002/ecy.1484
Funk, J.L., Cleland, E.E., Suding, K.N., Zavaleta, E.S., 2008. Restoration through reassembly:
plant traits and invasion resistance. Trends Ecol. Evol. 23, 695–703.
https://doi.org/10.1016/j.tree.2008.07.013
Garnier, E., Navas, M.L., 2012. A trait-based approach to comparative functional plant ecology:
concepts, methods and applications for agroecology. A review. Agron. Sustain. Dev. 32,
365–399. https://doi.org/10.1007/s13593-011-0036-y
Isbell, F., Adler, P.R., Eisenhauer, N., Fornara, D., Kimmel, K., Kremen, C., Letourneau, D.K.,
Liebman, M., Polley, H.W., Quijas, S., Scherer-Lorenzen, M., 2017. Benefits of increasing
plant diversity in sustainable agroecosystems. J. Ecol. 105, 871–879.
https://doi.org/10.1111/1365-2745.12789
Isbell, F., Calcagno, V., Hector, A., Connolly, J., Harpole, W.S., Reich, P.B., Scherer-Lorenzen,
M., Schmid, B., Tilman, D., Ruijven, J. Van, Weigelt, A., Wilsey, B.J., Zavaleta, E.S., Loreau,
M., 2011. High plant diversity is needed to maintain ecosystem services. Nature 477, 199–
203. https://doi.org/10.1038/nature10282
Jabran, K., Mahajan, G., Sardana, V., Chauhan, B.S., 2015. Allelopathy for weed control in
agricultural systems. Crop Prot. 72, 57–65. https://doi.org/10.1016/j.cropro.2015.03.004
Jeschke, J.M., 2014. General hypotheses in invasion ecology. Divers. Distrib. 20, 1229–1234.
Kent, M. (2011) Vegetation Description and Data Analysis: A Practical Approach. 2nd edn.
Keeney, D. & Nelson, D., 1982. Ammonium by colorimetric methods. In A. Page, R. Miller, & D.
Keeney, eds. Methods of Soil Analysis, Part 2; chemical and microbiological properties.
American Society of Agronomy, pp. 643–698.
Krupinsky, JM, KL Bailey, MP McCullen, BD Gossen, and TK Turkington. 2002. Managing plant
disease risk in diversified cropping systems. Agron. J. 94, 198–209.
Lange, M., Eisenhauer, N., Sierra, C.A., Bessler, H., Engels, C., Griffiths, R.I., Malik, A.A., Roy,
J., Scheu, S., Steinbeiss, S., Mellado-va, P.G., Thomson, B.C., Trumbore, S.E., Gleixner,
G., 2015. Plant diversity increases soil microbial activity and soil carbon storage. Nat.
Commun. 6, 6707. https://doi.org/10.1038/ncomms7707
Lepš, J., Hadincová, V., 1992. How reliable are our vegetation analyses? J. Veg. Sci. 3, 119–
124.
Levine, J.M., 2000. Species diversity and biological invasions: relating local process to
community pattern. Science, 288, 852–854.
Levine, J.M., D’Antonio, C.M., 1999. Elton revisited: a review of evidence linking diversity and
invasibility. Oikos 87, 15–26. https://doi.org/10.2307/3546992
Linares, J., Scholberg, J., Boote, K., Hall, N., Chase, C.A., Ferguson, J.J., Hall, F., McSorley, R.,
2008. Use of the cover crop weed index to evaluate weed suppression by cover crops in
organic citrus orchards. HortScience 43, 27–34.
Magurran AE (2004) Measuring Biological Diversity. Blackwell, Oxford
Malézieux, E., Crozat, Y., Dupraz, C., Laurans, M., Makowski, D., Ozier-Lafontaine, B., Rapidel,
B., De Tourdonnet, S., Valantin-Morison, M., 2009. Mixing plant species in cropping
systems: concepts, tools and models. A review. Agron. Sustain. Dev. 29, 43–62.
Non-Affiliated Soil Analysis Work Committee, 1990. Handbook of standard soil testing methods
for advisory purposes. Soil Science Society of South Africa. Pretoria.
Nunez-Mir, G.C., Liebhold, A.M., Qinfeng, G., Brockerhoff, E.G., Jo, I., Ordonez, K., Fei, S.,
2017. Biotic resistance to exotic invasions: its role in forest ecosystems, confounding
artifacts, and future directions. Biol. Invasions 19, 3287–3299.
https://doi.org/10.1007/s10530-017-1413-5
Oelmann, Y., Richter, A.K., Roscher, C., Rosenkranz, S., Temperton, V.M., Weisser, W.W.,
Wilcke, W., 2011. Does plant diversity influence phosphorus cycling in experimental
grasslands? Geoderma 167–168, 178–187. https://doi.org/10.1016/j.geoderma.2011.09.012
Palmer, M., Maurer, T., 1997. Does diversity beget diversity? A case study of crops and weeds.
J. Veg. Sci. 8, 235–240.
Petit, S., Boursault, A., Guilloux, M., Munier-Jolain, N., Reboud, X., 2011. Weeds in agricultural
landscapes. A review. Agron. Sustain. Dev. 31, 309–317.
https://doi.org/10.1051/agro/2010020
Pirhofer-Walzl, K., Rasmussen, J., Høgh-Jensen, H., Eriksen, J., Søegaard, K., Rasmussen, J.,
2012. Nitrogen transfer from forage legumes to nine neighbouring plants in a multi-species
grassland. Plant Soil 350, 71–84. https://doi.org/10.1007/s11104-011-0882-z
Porqueddu C., Dettori G.P., Maltoni S., Brophy C., Connolly J. Pure stands vs four-species
mixtures: agronomic and ecological implications in Mediterranean rainfed conditions. In :
Porqueddu C. (ed.), Tavares de Sousa M.M. (ed.). Sustainable Mediterranean grasslands
and their multi- functions . Zaragoza : CIHEAM / FAO / ENMP / SPPF, 2008. p. 153-156
(Options Méditerranéennes : Série A. Séminaires Méditerranéens; n. 79)
R Core Team (2017). R: A language and environment for statistical computing. R Foundation for
Reich, P.B., 2014. The world-wide “fast–slow” plant economics spectrum: a traits manifesto. J.
Ecol. 102, 275–301. https://doi.org/10.1111/1365-2745.12211
Richardson, D.M., Pyšek, P., 2006. Plant invasions: merging the concepts of species
invasiveness and community invasibility. Prog. Phys. Geogr. 30, 409–431.
https://doi.org/10.1191/0309133306pp490pr
Rueda-Ayala, V., Jaeck, O., Gerhards, R., 2015. Investigation of biochemical and competitive
effects of cover crops on crops and weeds. Crop Prot. 71, 79–87.
https://doi.org/10.1016/j.cropro.2015.01.023
Scherber, C., Eisenhauer, N., Weisser, W.W., Schmid, B., Voigt, W., Schulze, E.-D., Roscher,
C., Weigelt, A., Allan, E., Beßler, H., Bonkowski, M., Buchmann, N., Buscot, F., Clement,
L.W., Ebeling, A., Engels, C., Fischer, M.S., Halle, S., Kertscher, I., Klein, A.-M., Koller, R.,
König, S., Kowalski, E., Kummer, V., Kuu, A., Lange, M., Lauterbach, D., Middelhoff, C.,
Migunova, V.D., Milcu, A., Müller, R., Partsch, S., Petermann, J.S., Renker, C., Rottstock,
T., Sabais, A., Scheu, S., Schumacher, J., Temperton, V.M., Tscharntke, T., 2010.
Bottom-up effects of plant diversity on multitrophic interactions in a biodiversity experiment. Nature
468, 553–556.
Schielzeth, H. 2010. Simple means to improve the interpretability of regression coefficients.
Methods Ecol Evol 1, 103–113. https://doi.org/10.1111/j.2041-210X.2010.00012.x
Shea, K., Chesson, P., 2002. Community ecology theory as a framework for biological invasions.
Trends Ecol. Evol. 17, 170–176. https://doi.org/10.1016/S0169-5347(02)02495-3
Smith, R.G., Atwood, L.W., Pollnac, F.W., Warren, N.D., 2015. Cover-crop species as distinct
biotic filters in weed community assembly. Weed Sci. 63, 282–295.
Smith, R.G., Atwood, L.W., Warren, N.D., 2014. Increased productivity of a cover crop mixture is
not associated with enhanced agroecosystem services. PLoS One 9, e97351.
https://doi.org/10.1371/journal.pone.0097351
Snapp, S.S., Swinton, S.M., Labarta, R., Mutch, D., Black, J.R., Leep, R., Nyiraneza, J., O’Neil,
K., 2005. Evaluating cover crops for benefits, costs and performance within cropping system
niches. Agron. J. 97, 322–332.
Storkey, J., Döring, T., Baddeley, J., Collins, R., Roderick, S., Jones, H., Watson, C., 2015.
Engineering a plant community to deliver multiple ecosystem services. Ecol. Appl. 25, 1034–
1043. https://doi.org/10.1890/14-1605.1
Storkey, J., Doring, T., Baddeley, J., Marshall, A., Roderick, S., Jones, H., 2011. Modelling the
ability of legumes to suppress weeds. Asp. Appl. Biol. 109, 53–58.
Tilman, D., 2001. Functional diversity, in: Levin, S.A. (Ed.), Encyclopaedia of Biodiversity.
Academic Press, San Diego, pp. 109–120.
Tilman, D., Reich, P.B. & Isbell, F., 2012. Biodiversity impacts ecosystem productivity as much
as resources, disturbance, or herbivory. PNAS, 109(26), pp.10394–10397.
Thorup-Kristensen, K., Rasmussen, C.R., 2015. Identifying new deep-rooted plant species
suitable as undersown nitrogen catch crops. J. Soil Water Conserv. 70, 399–409.
Tribouillois, H., Fort, F., Cruz, P., Charles, R., Flores, O., Garnier, E., Justes, E., 2015. A
functional characterisation of a wide range of cover crop species: growth and nitrogen
acquisition rates, leaf traits and ecological strategies. PLoS One 10, 1–17.
https://doi.org/10.1371/journal.pone.0122156
Wittwer, R.A., Dorn, B., Jossi, W., Van Der Heijden, M., 2017. Cover crops support ecological
intensification of arable cropping systems. Sci. Rep. 7, 41911.
Wortman, S.E., Francis, C., Lindquist, J.L., 2012. Cover crop mixtures for the western corn belt:
opportunities for increased productivity and stability. Agron. J. 104.
FIGURES AND TABLES
Figure 1: The location of Langgewens and Tygerhoek Research Farms in South Africa.
Johannesburg
Cape Town
Langgewens Research Farm
Tygerhoek Research Farm
Cereal Legume Brassica
Cover crop species from different functional types can be combined in functionally diverse mix ...
… or in functionally similar mixes, e.g. an all-cereal mix (above) or an all-legume mix (below).
Different functional types utilise space and access resources around them in different ways
‘others’ (S.E. = 0.004; chicory or flax). This small proportion of ‘others’ is barely visible at the top of the HD bar.
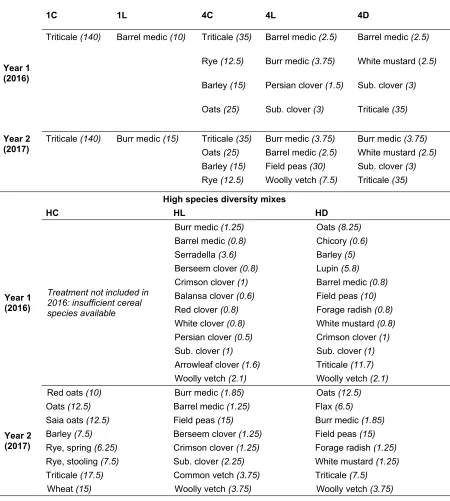
Table 1: cover crop species included in each of the mixes containing either one or four species, and their sowing rates in kg ha-1 (indicated in italics). Refer to Table 2 for species names, cultivars and functional types (NB. Sub. clover = Subterranean clover). Mixes were the same on both farms in each year, but differed between years (see main text). Mix names refer to the number of species (1 or 4), and to their functional composition, C = cereal, L = legume, and D = diverse (cereals, legumes and brassicas).
Single species and four species mixes
1C 1L 4C 4L 4D
Triticale (140) Barrel medic (10) Triticale (35) Barrel medic (2.5) Barrel medic (2.5)
Rye (12.5) Burr medic (3.75) White mustard (2.5)
Barley (15) Persian clover (1.5) Sub. clover (3)
Year 1 (2016)
Oats (25) Sub. clover (3) Triticale (35)
Triticale (140) Burr medic (15) Triticale (35) Burr medic (3.75) Burr medic (3.75)
Oats (25) Barrel medic (2.5) White mustard (2.5)
Barley (15) Field peas (30) Sub. clover (3)
Year 2 (2017)
Rye (12.5) Woolly vetch (7.5) Triticale (35)
High species diversity mixes
HC HL HD
Burr medic (1.25) Oats (8.25)
Barrel medic (0.8) Chicory (0.6)
Serradella (3.6) Barley (5)
Berseem clover (0.8) Lupin (5.8)
Crimson clover (1) Barrel medic (0.8)
Balansa clover (0.6) Field peas (10)
Red clover (0.8) Forage radish (0.8)
White clover (0.8) White mustard (0.8)
Persian clover (0.5) Crimson clover (1)
Sub. clover (1) Sub. clover (1)
Arrowleaf clover (1.6) Triticale (11.7)
Year 1 (2016)
Treatment not included in 2016: insufficient cereal species available
Woolly vetch (2.1) Woolly vetch (2.1)
Red oats (10) Burr medic (1.85) Oats (12.5)
Oats (12.5) Barrel medic (1.25) Flax (6.5)
Saia oats (12.5) Field peas (15) Burr medic (1.85)
Barley (7.5) Berseem clover (1.25) Field peas (15)
Rye, spring (6.25) Crimson clover (1.25) Forage radish (1.25)
Rye, stooling (7.5) Sub. clover (2.25) White mustard (1.25)
Triticale (17.5) Common vetch (3.75) Triticale (7.5)
Year 2 (2017)
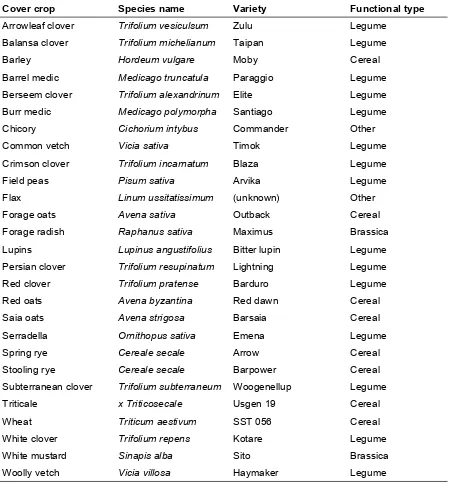
Table 2: The species names, cultivars and functional type of all cover crops used in this study.
Cover crop Species name Variety Functional type
Arrowleaf clover Trifolium vesiculsum Zulu Legume
Balansa clover Trifolium michelianum Taipan Legume
Barley Hordeum vulgare Moby Cereal
Barrel medic Medicago truncatula Paraggio Legume
Berseem clover Trifolium alexandrinum Elite Legume
Burr medic Medicago polymorpha Santiago Legume
Chicory Cichorium intybus Commander Other
Common vetch Vicia sativa Timok Legume
Crimson clover Trifolium incarnatum Blaza Legume
Field peas Pisum sativa Arvika Legume
Flax Linum ussitatissimum (unknown) Other
Forage oats Avena sativa Outback Cereal
Forage radish Raphanus sativa Maximus Brassica
Lupins Lupinus angustifolius Bitter lupin Legume
Persian clover Trifolium resupinatum Lightning Legume
Red clover Trifolium pratense Barduro Legume
Red oats Avena byzantina Red dawn Cereal
Saia oats Avena strigosa Barsaia Cereal
Serradella Ornithopus sativa Emena Legume
Spring rye Cereale secale Arrow Cereal
Stooling rye Cereale secale Barpower Cereal
Subterranean clover Trifolium subterraneum Woogenellup Legume
Triticale x Triticosecale Usgen 19 Cereal
Wheat Triticum aestivum SST 056 Cereal
White clover Trifolium repens Kotare Legume
White mustard Sinapis alba Sito Brassica
Table 3: Model estimates and statistical significance of the effects of different cover crop characteristics on log weed biomass. The relationships of weed biomass with cover crop biomass and with cereal biomass proportion are illustrated in Figure 5.
Weed biomass dry weight kg ha-1 (log)
Mid-season Mid to end-season increase End-season
Cover crop characteristics† Estimate P-value Estimate P-value Estimate P-value
Biomass 0.17 0.089 -0.15 0.105 -0.23 0.033*
Species diversity 0.05 0.583 -0.15 0.096 -0.09 0.251
Functional diversity 0.09 0.357 -0.08 0.370 0.02 0.832
Cereal biomass proportion -0.54 <0.001* 0.38 <0.001* -0.46 <0.001*
Marginal (conditional) R2 0.16 (0.51) 0.27 (0.54) 0.33 (0.68)
*Significant at the 0.05 probability level.