Persistence and Availability of Floating Content
in a Campus Environment
Shahzad Ali
1,2, Gianluca Rizzo
3, Vincenzo Mancuso
1,2, and Marco Ajmone Marsan
1,41
IMDEA Networks Institute, Madrid, Spain
2University Carlos III of Madrid, Spain
3
HES SO Valais, Sierre, Switzerland
4Politecnico di Torino, Italy
Abstract—This work presents the first experimental evaluation of the Floating Content (FC) communication paradigm in a campus/large office setting. By logging information transfer events we have characterized mobility patterns, and we have assessed the performance of services implemented using the FC paradigm. Our results unveil the key relevance of group dynamics in user movements for the FC performance. Surprisingly, in such an environment, our results show that a relatively low user density is enough to guarantee content persistence over time, contrarily to predictions from available models. Based on these experimental findings, we develop a novel simple analytical model that accounts for the peculiarities of the mobility patterns in such a setting, and that can accurately predict the effectiveness of FC for the implementation of services in a campus/large office setting.
I. INTRODUCTION
Several of the recent trends in networking seem to be push-ing the implementation of ICT services closer to the end user. On one hand, Software Defined Networking (SDN) [1] and the new paradigm of Fog Computing [2] bring personalized services to end users, which take into account the context in which the user is immersed, expanding the well-known concept of Location-Based Services [3]. On the other, the emergence of the Internet of Things (IoT) and even of the Internet of Everything (IoE) concepts increases connectivity to levels at which the centralization of services, processing and storage will become impossible [4].
This drive towards locality calls for the exploitation of data which are sensed locally, and which are relevant for the user profile, location and context; in addition, it also calls for the exploitation of localized opportunistic terminal-to-terminal infrastructureless communications, to disseminate locally those data which might become irrelevant, when brought to the network core or to other periphery areas, and to offload information transfers with local relevance from the bandwidth-hungry infrastructured wireless access and network core transit. This justifies the growing interest in terminal-to-terminal connectivity and in opportunistic communications.
An interesting example of opportunistic communication scheme for the local dissemination of information to end users through direct terminal-to-terminal connectivity is Floating Content (FC) [5]. FC was conceived to support infrastructure-less distributed content sharing over a certain geographic area
called Anchor Zone (AZ). The objective of FC is to ensure
the availability of some pieces of content within the AZ for a given time period by replicating the pieces of content opportunistically to users which come in contact within the AZ, so that contents can “float” within the AZ.
Previous works on performance of the FC service fo-cused on determining the conditions under which a piece of content floats with high probability [5] and on application-level performance modeling [6]. These works are based on simplifying assumptions for user mobility, and on a simplified model for data exchange. Such models give indications about the potential and limitations of FC, but they are only first-order predictions of performance in realistic settings. Indeed, important aspects, such as the combined impact of the actual mobility patterns of users, of the communication protocols, of the specific propagation characteristics in the chosen area, of localization accuracy, are difficult to investigate analytically and to evaluate by simulation. Moreover, it is important to understand the impact of the limitations and of the specific features of available protocols for opportunistic terminal-to-terminal communications (such as Bluetooth and WiFi Direct) on the performance of the FC service.
In this paper we present the first experimental study of the operation of FC in a university campus context. We describe the development of a smartphone app to support FC, as well as the experimental setting used for the collection of real data traces. We present and discuss a selection of the results that were collected over one week of operation of FC. We characterize some critical performance aspects which are relevant for applications based on FC, such as content persistence, availability and efficiency with which the content is accessed by users. Finally, we propose a simple analytical model which accurately captures the key behaviors that emerged from the experiment.
$QFKRU =RQH
1RGHZLWKFRQWHQW 1RGHZLWKRXWFRQWHQW 1RGHZLWKGHOHWHGFRQWHQW
Fig. 1. Operation of a Floating Content service.
some related work, and Section VIII concludes the paper.
II. THEFLOATINGCONTENTSERVICE
Floating Content (FC) is an information sharing paradigm that allows the implementation of a class of infrastructure-less services based on opportunistic wireless terminal-to-terminal communications. Each wireless node participating in a given FC service produces information which is of interest for users within a limited geographical area, i.e., in the AZ, for a given interval of time. Therefore, content is generated inside the AZ and is destroyed when a node exits the AZ [5]. Whenever a node having a piece of content in the AZ comes within the transmission range of some other node which does not have it, the piece of content is replicated through opportunistic message exchanges, as shown in Fig. 1. In this way, pieces of contents “float” within the AZ, i.e., they are available on a set of nodes which move within the AZ. The set of nodes carrying each piece of content varies over time, even after the node which generated the content has left the AZ.
Through this geographically constrained opportunistic repli-cation mechanism, a given piece of content is stored proba-bilistically in a spatial region, typically without the support of fixed infrastructure, and it is made available to users traversing the AZ through opportunistic exchanges with nodes in the AZ. Specifically, the theory shows that, within the AZ, contents
float over time with high probability, based on a criticality
condition, which accounts for the average number of nodes in the AZ, the average node contact rate, and the average node sojourn time in the AZ [5, 7]. When the criticality condition is satisfied, the expected lifetime of a piece of content is infinite under the fluid limit approximation of [5]. In practice, this implies large average content lifetimes.
However, the sole condition of floating does not provide service guarantees. In fact, a piece of content needs to be
availablefor new nodes to obtain it when they enter the AZ, and it needs to reach the nodes transiting through the AZ with suitably high probability [6]. More in detail, the following definitions are key to the formulation of performance metrics for FC services.
Definition 1 (Availability). The availability of a piece of content afterttime units after its generation is the fraction of
users inside the AZ holding a copy of the piece of content.
Definition 2 (Success ratio). The success ratio of a piece of content is the ratio between the number of nodes that received the content during the content lifetime and the number of nodes that had the opportunity to obtain the piece of content either because they were present in the AZ at content generation time or because they entered the AZ during the content lifetime.
III. EXPERIMENTALSETUP
In this section we describe our experience with FC services in a large university campus scenario. The experimental FC
services were running on Floaty, an Android application we
developed and tested in the Leganés campus of the University Carlos III of Madrid, Spain.
A. Floaty: a Floating Content Mobile App for Android
In order to perform our tests, we implemented the FC
ser-vice on an Android smartphone application, namedFloaty. We
chose to implement the FC app on Android because of its wide diffusion among existing mobile users. Floaty implements op-portunistic communications over Bluetooth, which we selected because it is presently available in almost all smartphones in the market. WiFi Direct was the possible alternative to Bluetooth, but it was discarded because it typically consumes much more energy [8], and poses severe technical problems, due to the lack of transparent user authentication modes.
The pieces of content generated by Floaty are lightweight. They are composed of an identifier of the device which generated the contents (its MAC address and Bluetooth name), a timestamp (the time at which a piece of content was gener-ated), and a sequence number. As a consequence of the small size of each piece of content, during the whole experiment, a single Bluetooth message was sufficient to transfer all of the contents that were transmitted from one node to another. This allowed us to neglect the effect of content size over transfer time, and, in general, over the performance of the FC service. When a device running Floaty is in the AZ, the app generates a new piece of content every 15 minutes, and contents are transferred to all the other nodes which come within the radio transmission range of such device, and which are running the same app. A piece of content does not expire until the end of the day when it was generated, so every day we generate a fresh population of pieces of content. Note that the availability of several pieces of content generated by each user during its sojourn inside the AZ allowed the test of FC services performance with a fine granularity over time and space in the experimental setting.
In order to detect the presence of floating contents, every 60 seconds Floaty performs a Bluetooth scan, and builds a list
of available Bluetooth peers running the same app.1Whenever
the list of peers is nonempty, the app chooses one of them, and tries to establish a Bluetooth connection with it. If it succeeds, the two peers exchange all pieces of content they store. However, due to Bluetooth limitations, the app connects
to one peer at a time, and spends a few seconds to transfer the available pieces of content between connected peers (up to 12 seconds in our experiments, almost 100% of which due to Bluetooth connection protocols, rather than to data transfer, as we have experimentally verified). Therefore, it is important to optimize the choice of the peers, to improve content diffusion in dynamic settings. To this end, Floaty ranks peers in radio range according to the time of the last content exchange, starting from the oldest ones, so that the peers that were never met before have absolute precedence.
For the FC mechanism to operate correctly, the most rele-vant information is whether a user is inside the AZ, rather than its exact position in space. Therefore, instead of exploiting GPS signals or the like, the Floaty app just makes use of a coarse localization method based on WiFi signals. Specifically, to decide whether a node is inside the AZ, every 60 seconds the Floaty app scans for signals of surrounding access points. If it detects at least one reference access point (any of the ones present on campus), then it assumes to be inside the AZ. Therefore, our experiment covers a slightly larger area than the university campus. However, being the campus quite large, and being the access points located inside the buildings, the difference is negligible.
All scanning intervals and content generation intervals have been chosen so as to achieve a reasonable tradeoff between the performance of FC services and the energy consumed by the devices. In particular, we have quantified the average energy
consumption for a test set of smartphones in ∼ 5% battery
discharge per hour. Generating contents more frequently, or scanning WiFi and Bluetooth on a sub-minute basis would have made terminals incur excessive battery costs. However, we have experimentally evaluated our test set of devices using different scanning and content generation intervals. As a result, we have found that, given the slow dynamics of the campus environment, the performance of FC services was not benefitting much from higher scanning frequencies or more frequent content generation.
Floaty logs all events related to content transfer between nodes, including timestamps, connection durations, lists of transferred contents. The app also logs all events relating to AZ ingresses and egresses, as well as all failed message transfers. These logs are periodically uploaded to a remote server.
B. The Experiment
After having tested Floaty with a reduced test set of ter-minals and users, we advertised the experiment on campus, trying to convince students, researchers, and professors to download and install Floaty on their smartphones and tablets. In particular, we had access to the Computer Science building, where we were allowed to use fliers and mailing lists, and to drop by classrooms at the end of classes to talk with students. In total, among the people frequenting the building, 62 volunteered to download and install Floaty on their per-sonal devices. However, only 48 devices produced valid logs. Moreover, a tiny fraction of these users never exchanged any piece of content during the whole duration of the experiment.
8AM 1PM 6PM
0 4 8 12 16 20
N
o
d
e
s
Time
0 8 16 24 32 40
C
o
n
ta
c
ts
Number of nodes Contacts Nodes entered Nodes exited
Fig. 2. Behavior of users over a day (average over 5 days). Data refers to number of nodes, number of contacts, arrivals and departures counted in intervals of 15 minutes.
The experiment lasted 5 days (Monday to Friday) from 8 AM
to 6 PM, in May 2014. During the whole experiment, 1117
pieces of content were generated.
As we will show in Section IV, we verified that users had a peculiar mobility pattern, i.e., they moved between home and the university, and, once on campus, they had the tendency to form stable groups and spend long intervals in the same place (as expected for students attending classes). The result of such mobility pattens is scarce spatial interaction with most of the other users. Indeed, this is a trivial but important aspect of the performance of FC services. In this regard, the experiment confirmed that infrastructure-less FC is a reasonable choice even for applications meant for users with reduced spatial interactions. However, for our evaluations, we considered only those pieces of content that got a chance to be replicated at least once, which consists in a population of 923 pieces of content.
IV. EXPERIMENTALRESULTS
In this section we report the main results of our experiments. We first use the collected logs to characterize the behavior of users participating in the experiments, in terms of mobility, connectivity, and generation of pieces of content. Afterwards, we show the performance figures achieved by the FC service, mainly in terms of content availability and success probability.
A. Characterization of User Behavior
During the experiments, users dynamically enter and exit the AZ, and generate pieces of content only when they are within the AZ, so that the number of nodes present in the AZ, as well as the number of pieces of content floating in the AZ changes over time. Fig. 2 illustrates the dynamics of number of nodes and contacts observed in the AZ over the day, averaged over the logs collected during the five days of experiments. For ease of presentation, arrivals, departures, number of nodes, and
number of contacts are counted with a time resolution of 15
minutes.
From the figure, it emerges that the average number of nodes does not change drastically over the day, although it is
possible to identify five regions in the graph:(i)the leftmost
01 02
03
04
05
06 07
0
8
0
9
1
0
1
1
1 2
13
14
15
16
17
18
19
20
2 1
2
2
2
3 2
4 25
2 6
27 28
29 30
31
(a) 11 AM to 12 PM.
01 02
03
04
05
06 07
0
8
0
9
1
0
1
1
1 2
13
14
15
16
17
18
19
20
2 1
2
2
2
3 24 25
26 27
28 29
30 31
(b)1 PM to 2 PM.
Fig. 3. Connectivity graph for different times of the day. Each point corresponds to a node, and a link represents one or more contacts between two nodes during the considered hour of the day.
arrivals are more numerous than departures (8AM - 10AM);
(ii) from 10AM to 2PM, the number of nodes in the AZ
changes very little, after which (iii)the curve shows a drop,
corresponding to lunch time (2PM - 3PM);(iv)from 3PM to
5PM the number of nodes is again practically stable, while(v)
after 5PM there is a prevalence of users leaving the campus and thus the AZ.
The number of contacts between nodes does not follow exactly the same trajectory as the number of nodes, because users within the AZ often move in groups, attend classes, meet in shared areas and cafeterias, so that the connectivity pattern is more irregular over time. In particular, note that nodes present in the AZ at the beginning and at the end of the day do not experience many contacts, which is a symptom of scarce mobility of users arriving early and/or leaving late (probably these are professors or researchers sitting in their offices, where they are under campus WiFi coverage). In general, Fig. 2 shows that contacts are, on average, not very frequent. For instance, about 16 users experience in total 33 contacts at 1PM (i.e., between 1PM and 1:15PM), which is a symptom of limited mobility on the time scale of minutes.
Fig. 3 gives more insight on the occurrence of contacts between users. The figure depicts two snapshots of the connec-tivity graph between users in the AZ. Every link between two users means that those users had a contact in the considered time interval, in the first day of the experiment. Clearly, connectivity exhibits drastic changes over the day, which can affect the performance of FC services in terms of users that can be reached, and probability of the piece of content floating within the AZ. Notably, the figure unveils that one or two components are practically sufficient to cover the full set of users experiencing contacts, so that we can infer a clusterization of user contacts in which two clusters are practically enough to describe the process. Indeed, one of the most prominent differences between the main mobility models which have been applied to the analysis of FC, and mobility patterns in a realistic experimental setting is the fact that the latters generate nonuniform user distributions in space. As it is common experience, confirmed by our logs, real user mobility is characterized by correlation in locations and trajectories of users, often resulting in the formation of clusters.
Our logs also show that only 85%of the contacts generate
a successful transfer of pieces of content. This behavior is due
0 100 200 300 400 500 600
0 0.1 0.2 0.3 0.4 0.5 0.6 0.7 0.8 0.9 1
Time [min]
C
D
F
Time to get content Time spent inside AZ
Fig. 4. Empirical CDFs of user sojourn time and of time to get content.
to users trying to exchange pieces of content while actually moving, e.g., walking through a corridor, and, in general, when there is not enough time to complete the Bluetooth connection procedure and the actual message exchange. Indeed, consid-ering that the rate of unsuccessful content transfers is low, and that the number of contacts logged in our experiments is limited and shows clusterization effects, we infer that, in our experiments, users tend to move quickly from a place to another and then spend long intervals at their destination (as expected for students attending classes on campus).
To further characterize the mobility pattern of users, we plot the CDF of the sojourn times of the users within the AZ in
Fig. 4. From the figure, it emerges that about50%of the users
spend 2 hours or less inside the AZ before leaving (although they possibly come back later, e.g., after lunch). The figure also reports the CDF for the time to get a piece of content once a node enters the AZ, or after a new piece of content is generated while a node was already in the AZ. Notably, most of the pieces of content are replicated within a few tens
of minutes (70% of those nodes which get a given piece of
content do it within 40 minutes), i. e., much faster than the
typical time spent by a node inside the AZ. Therefore, we can conclude that, notwithstanding the limited frequency of contacts, the mobility of users is still suitable to make the pieces of content float within the AZ. We empirically validate this statement by analyzing the floating behavior of pieces of content in the next subsection.
To conclude the empirical evaluation of the user behavior, we report a comparison between the empirical CDF of content lifetimes, and the corresponding ideal CDF for the case of constant number of nodes in the AZ generating pieces of content at regular intervals in Fig. 5. Notably, the two CDFs do not differ significantly, although it is possible to notice in the experimental CDF a bias (higher slope in the curve) in favor of the number of pieces of content with lifetime longer than 5 hours and shorter that 8 hours. In general, from our experiments we note that the longer a piece of content floats, the lower the probability that the piece of content will die out (of course, all pieces of content will die out at the end of the
0 100 200 300 400 500 600 0
0.1 0.2 0.3 0.4 0.5 0.6 0.7 0.8 0.9 1
Time [min]
Empirical CDF of lifetime CDF of lifetime, arrivals at 8 AM
Fig. 5. CDF of content lifetime compared with the ideal case of uniform arrivals of users and content generation.
experiment).
B. FC Performance Evaluation
In Section IV-A we have already mentioned the fact that the time to get a piece of content is typically short with respect to the time spent by a user in the AZ, and that users exhibit scarce mobility on short timescales. However, from the perspective of an application using FC, content floating lifetime is one of the most studied features of the service, perceived as one of the main measures of its feasibility. Indeed, in a real scenario, all pieces of content naturally disappear at some point in time, not only because of day/night mobility patterns, but also because of stochastic fluctuations in population density and in mobility pattern. Among all pieces of content generated over the five days of the experiment and replicated at least once,
only5%died out before the end of the day. For those pieces
of content that do get replicated, but do not reach the end of the day, Fig. 6 shows that the vast majority disappears in the early stages of the diffusion process, while the number of floating content replicas has not reached a critical mass.
Conversely, when the number of replicas gets sufficiently
high, the replication mechanism proves efficient enough to
compensate content replicas lost due to users leaving the AZ. This observation allows us to compare our experimental data with results from available models. For mobility patterns such as the ones in our experiment, with relatively few “on-the-fly” content exchanges, from [9] the mean number of nodes
in range of a given node should be larger than1.19for content
to float indefinitely with high probability. But despite the very low content mortality in our experiments, in our settings the
mean number of nodes in range has been 0.612, well below
the criticality condition.
The net result of the content dynamics described above is that the average availability of pieces of contents grows over time, counting from the content generation time, as shown in Fig. 7. Indeed, as mentioned in Section II, one of the main indicators of the effectiveness with which content fluctuates in the AZ is availability, i.e., the fraction of users with a copy of the piece of content. Observing Fig. 7, content spreading appears to occur at two speeds over content lifetime.
0 10 20 30 40 50 60 70 80 90 100 0
0.1 0.2 0.3 0.4 0.5 0.6 0.7 0.8 0.9 1
Time from content generation [min]
C
D
F
Fig. 6. Empirical CDFs of content lifetime, conditioned to content being replicated at least once, and dead before 17.00.
0 50 100 150 200 250
0 0.1 0.2 0.3 0.4 0.5 0.6 0.7 0.8 0.9 1
Time from content generation [min]
A
v
a
il
a
b
il
it
y
Average Average + σ
Average - σ
Fig. 7. Mean content availability over content lifetime, for one seeder. In background, per-content availability is plotted for all contents generated during our experiments.
0 50 100 150 200 250
0 0.1 0.2 0.3 0.4 0.5 0.6 0.7 0.8 0.9 1
Time from content generation [min]
A
v
a
il
a
b
il
it
y
1 seeder, # of replications >=1 1 seeder, # of replications >=2 1 seeder, # of replications >=3 2 seeders
3 seeders
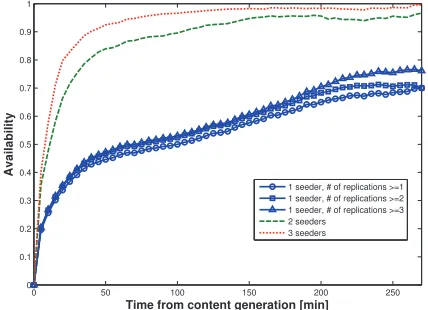
Fig. 8. Mean content availability over content lifetime, for different number of seeders.
Specifically, a quick initial diffusion phase is followed by a phase of slower but steady spreading among the rest of the users. This behavior is supported by our clusterization hypothesis, since diffusion within a cluster of contacts would be fast, while spreading a content across clusters would take longer, due to the limited mobility of users.
de-0 0.1 0.2 0.3 0.4 0.5 0.6 0.7 0.8 0.9 1 0
0.1 0.2 0.3 0.4 0.5 0.6 0.7 0.8 0.9 1
Success ratio
C
D
F
1 seeder 2 seeders 3 seeders
Fig. 9. Experimental CDF of success ratio, for different number of seeders.
picted in Fig. 7, we notice that while the pieces of content float, only about half of the users in the AZ possess a copy of the floating contents. To validate the hypothesis that also this behavior is due to the occurrence of clusters, we parse once again our logs to build the following functions of time: the availability of pieces of content replicated at least once, the one of pieces of content replicated at least twice, and the one of pieces of content replicated at least three times. Furthermore, we build the availability of pairs and triples of pieces of content, i.e., the availabilities obtained by considering the joint availability of respectively two or three pieces of content generated roughly at the same time. In this way, we simulate
the presence of multipleseedersfor a same piece of content.
The resulting curves are reported in Fig. 8. The figure confirms the non-uniformity in user distribution in space. In fact, multi-seeder curves exhibit high availability levels, while little difference can be noticed between the singe-seeder curves. In practice, since seeders are chosen at random among all users present in the AZ at the time of content generation, having more seeders improves the probability to reach more clusters within a given time from content generation. In contrast, if the initial replicas reside on users which are in range of each other, the effect on availability is negligible. The little difference between the case with two seeders and the one with three seeders, tells us that the mobility pattern in our experimental settings gives rise to a clustered structure that could be modeled with as few as two clusters.
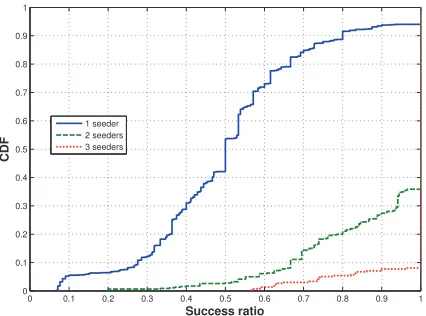
To complete the performance evaluation of FC services in our experiments, we finally report results on the success ratio. This is a measure of the effectiveness in accessing the content stored (floating) in the AZ, as reported in Fig. 9 for the cases of one, two or three content seeders. For a given piece of content, the figure shows the ratio between the total number of users who got the piece of content and the total number of users who were present in the AZ (or entered the AZ) during the content lifetime. Users who entered the AZ more than once during the content lifetime are counted multiple times. In fact, each time a user exits the AZ, it discards all pieces of content, and if it re-enters the AZ, it tries to collect again all the pieces of content floating in the AZ. Specifically, the figure reports the empirical CDF of the success ratio computed over all the 923
pieces of content considered for the experiment statistics. For the case of one single seeder, the peculiar mobility pattern of the users does not allow high success ratios with high probabilities. In fact, half of the pieces of content have a success ratio of 0.5 or less, and just 10% of the pieces of content exhibit a success ratio higher than 80%. This result was somehow expected, since we knew from Fig. 7 that the average availability over time does not reach values higher than 70%. With more seeders, both availability and success ratio are boosted. In particular, with two seeders, 65% of the pieces of content are replicated to all users present in the AZ during the content lifetime. With three seeders, all users in the AZ, independently from the time spent in the AZ, receive a copy of more than 90% of the pieces of content.
So far we have empirically computed performance figures for FC. Whether such performance is suitable or not to allow for the diffusion of FC services is out of the scope of this paper, and it mostly depends on the requirements of the specific service to be implement on top of FC. However, with our experimental results we have also unveiled that, if required by the application, using just a few independent seeders can dramatically increase both availability and success ratio, so as to reach the needed performance level. For instance, in our campus experiments, no more that three seeders are needed to make FC extremely effective.
Next, we use the lesson learnt from the experiments to build a reliable model for evaluating the performance of FC.
V. THEPOISSONJUMPSMODEL
Here we present a new analytical model for the computation of the main performance parameters of FC services in areas like campuses and large office areas; the analysis is based on a mobility model which reflects typical patterns of such environments, as characterized in the previous sections.
We consider mobile nodes in R2. The node mobility is
described with the Poisson Jumps model, derived from the
Random Waypoint model by assuming users to move at infinite speed. According to this mobility model, users “jump” from a location to another, staying in each location for a given
stopping time, which we model as a random variable with
mean 1/µ. Therefore, a sojourn in the AZ is modeled as
a sequence of jumps into a set of locations within the AZ, and a sequence of stops at those locations. Note that this model naturally applies to settings where users move “too fast” for content exchange to take place on-the-fly, and where most of the time is spent on a seat (e.g., for our on campus experiments, in office or in class).
In accordance with experimental data, we assume the mean stopping time to be much longer than the average time for con-tent transfer. Thus, transfers can be considered instantaneous for all practical purposes. We also consider stopping times to be long enough to allow retransmissions in case of failure. Hence, we can neglect the effect of communication errors.
Node arrivals in the AZ follow a Poisson process with
intensity γ along time, and they are distributed uniformly in
the AZ with probability1−p. Otherwise, it moves instantly to
a new randomly chosen location within the AZ. The resulting spatial distribution of nodes is uniform at any time.
We assume that at time t = 0 a “seeder” node generates
a piece of content, which has to be spread among nodes
within the AZ. The AZ is circular, with radius R, centered
at the location of the seeder at t = 0. Every node knows
its exact position in space at any time. All nodes have the
same transmission range r. For t >0, every time two nodes
within the AZ come in transmission range of each other (we call this a contact), if only one of the two nodes possesses a piece of content, it transfers it to the other. When nodes move outside of the AZ, they delete their own copy of the piece of
content. We assume moreover thatRr, as otherwise direct
communications between nodes in the range of the seeder would be enough to spread the content.
As we have seen, one of the main performance parameters for FC is the probability for a user to get a piece of content during its sojourn in the AZ, since this quantity measures the efficiency with which the floating content service makes information available to intended users. The following theorem derives an expression for it.
Theorem 1(Success Probability). Consider a piece of content floating in an AZ with radius R, in which nodes arrive at a rate γ. Nodes have a transmission range r R, and move according to the Poisson Jumps model, with probability1−pof jumping out of the AZ. In the stationary regime, the probability for a node entering the AZ to get the piece of content during its sojourn in the AZ is given by
P = pjump
1−p(1−pjump), (1)
wherepjump is the probability of getting the piece of content
after a jump:
pjump= 1−e−r
2 n
R2, (2)
withn=µ(1−p)γ −min
µ(1−p)
ν ,
γ µ(1−p)
, and ν =2µrR22.
For the proof, please refer to the Appendix. In practical settings, transients (initial and final), as well as fluctuations in the population of users, impact the performance of the FC service, in a measure which depends on content lifetime, and on many other system parameters. Nonetheless, Theorem 1 gives a reasonable estimate of the success ratio of a given piece of content in practical settings, and it allows estimating the impact of various system parameters on performance.
A similar result can be derived forP(τ), i.e., the probability
of getting a piece of content after τ seconds in the AZ. The
resulting expression is a function of stopping time’s CDF .
VI. MODEL ASSESSMENT
In order to estimate the user mobility characteristics in the considered settings, so as to parametrize correctly the Poisson Jumps model, we have estimated the “stopping times” of each user, i.e., the amount of time each user spends in a given
0 50 100 150 200 250
0 0.01 0.02 0.03 0.04 0.05 0.06
Stopping time [min]
Fig. 10. Empirical pdf of stopping times estimates.
location. This has been done by exploiting the fact that every time a user terminal produces a new piece of content (every
15minutes in our experiments), it tries connecting to all user
terminals in its range in order to replicate the content. For each terminal, the log of successful connection events provides then a fairly accurate picture of the peers around him, at the moment of content generation. The connection latencies induced by Bluetooth act as a lowpass filter for user dynamics, filtering out all peers which remain in range of a given user terminal for less than 12-15 seconds.
The heuristic used to estimate stopping times is based on
the assumption that users form small clusters, i.e., groups of
users all in range of each other. A cluster may correspond or not to a specific location in space (for instance, a classroom, or a group of students chatting in a corridor). All that matters for the purpose of parameterizing the Poisson Jumps model is how long a user is in range of a given set of peers. Of course, in very large groups of people, not all users in the cluster are in range of all the cluster members, but this is a reasonably good approximation for the range of user densities in our experimental setting. More specifically, in our experiment, a cluster in a given time interval has been identified as a set of at least two users, each of which had at least two content exchanges during the given time interval. As every user periodically produces new pieces of content, all members of a cluster frequently exchange pieces of content directly among them. Hence, from the logs of those connections it is possible to estimate the composition of the cluster over time.
The arrival/departure of a user in/from a cluster is estimated from the first/last time when that user has established a connection with any peer in that same cluster. As this estimate is built by aggregating connection logs from all users in the cluster, the larger the cluster, the more accurate the estimate, as content generation times are not synchronized across users. This method of estimating stopping times is not able to reliably capture relatively fast dynamics of clusters (peers leaving the cluster only for 2-3 minutes, for instance), but this event should be infrequent in our setting.
In Fig. 10 we can see the shape of the empirical distribution of the stopping time, computed as described above. The
resulting mean stopping time is 58 minutes and 14seconds,
TABLE I
AVAILABILITY AND SUCCESS PROBABILITY:MODEL VS.EXPERIMENTS
Model Measured Average Availability 0.50 0.562 Average Success Ratio (Success Probability) 0.47 0.514
one hour and most of the clusters form in classrooms. We have evaluated numerically the success ratio, by
assum-ing a mean sojourn time of about 1h40min, computed from
our experiments by excluding nodes which entered or exited
the AZ towards the end of the day, i.e., after 5 pm. This
was done in order to have a more homogeneous set of data from which to extract this parameter. The node arrival rate,
averaged over the whole week of the experiment, is 0.0015
nodes per second. The area of the AZ in the experiment has
been estimated as about7700square meters, for an equivalent
radius of about 50meters, which accounts only for buildings
in which classes were given during the experiment. As we can see from Table I, despite its simplicity, our model is able to predict with very good accuracy the performance of the FC service. Its being conservative can be attributed mainly to the assumption of uniform user distribution in the AZ.
VII. RELATEDWORK
Several works already exist, which experimentally study opportunistic communications in several different settings. Among them, [10] presents a set of experiments using Blue-tooth in a conference environment, providing some insight on the statistics of intercontact times in such a setting, and on their impact on performance of a family of routing algorithms. In [11], authors used mobility datasets from two different university campuses, and evaluated the impact of infrastructure on different opportunistic forwarding algorithms.
The idea of FC appears in the state of the art under various denominations. In [12], a concept very much
sim-ilar to FC called hovering information is presented. Two
algorithms aiming at improving availability are proposed. [5] first introduced the FC concept, and focus on the condition (criticality condition) under which in a fluid system a piece of content floats indefinitely over time. [13] validates the analytical results presented in [5] with extensive simulations, showing that floating content is feasible even when a modest number of nodes is present in the network. [9] derives some approximations for the criticality condition for a mobility model similar to our Poisson Jumps model. [6] considered the performance of applications which make use of the FC, deriving expressions for success probability under a set of mobility models which are a good fit for a mix of pedestrian and vehicular users in a city, but which do not suit indoor and office settings.
VIII. CONCLUSIONS
In this paper we have investigated experimentally the op-eration of floating content in a university campus context. We characterized the performance of the service in terms of content persistence, availability and efficiency with which the content is accessed by users. Our analysis highlights some
critical performance aspects which are relevant for applications based on FC. We showed that, even in such a highly dynamic setting, a relatively low user density is enough to guarantee content persistence over time, contrary to predictions from available models. More specifically, we showed that using just one seeder the special type of user movement in the environment that we considered in our experiment makes the availability of generated pieces of contents grow fast in the first hour, reaching on average about 40% of the users in the AZ. The successive increase in availability is slower, so that about 60% of users in the AZ is reached on average after four hours. Whether this is acceptable for FC services, it depends on the specific application, but we observed that it is easy to reach much higher availability values by just increasing the number of seeders to two. Indeed, by doing so, the number of users reached after one hour becomes about 90% on average, and after four hours is around 98% on average. This provides quite interesting indications for the viability and the implementation of FC services in university settings, and in general in office environments. Our results suggest that future efforts in FC performance modeling should be based on more realistic mobility models, including the effects of clustering as well as of correlation among users’ mobility patterns, and focus on performance over short timescales.
REFERENCES
[1] B. Nunes, M. Mendonca, X. Nguyen, K. Obraczka, and T. Turletti, “A survey of software-defined networking: Past, present, and future of programmable networks,” Communica-tions Surveys Tutorials, IEEE, vol. PP, no. 99, pp. 1–18, 2014. [2] F. Bonomi, R. Milito, J. Zhu, and S. Addepalli, “Fog computing and its role in the internet of things,” ser. MCC ’12. New York, NY, USA: ACM, 2012, pp. 13–16.
[3] S. Dhar and U. Varshney, “Challenges and business models for mobile location-based services and advertising,” Commun. ACM, vol. 54, no. 5, pp. 121–128, May 2011.
[4] D. Evans, “The internet of everything - how more relevant and valuable connections will change the world,” inCISCO IBGS (White Paper), 2012.
[5] E. Hyytiä, J. Virtamo, P. Lassila, J. Kangasharju, and J. Ott, “When does content float? characterizing availability of an-chored information in opportunistic content sharing,” in INFO-COM, Shanghai, China, Apr. 2011, pp. 3123–3131.
[6] S. Ali, G. Rizzo, B. Rengarajan, and M. Ajmone Marsan, “A simple approximate analysis of floating content for context-aware applications,” inProceedings of MobiHoc’13, 2013. [7] M. Desta, E. Hyytia, J. Ott, and J. Kangasharju,
“Character-izing content sharing properties for mobile users in open city squares,” inWONS, March 2013, pp. 147–154.
[8] P. Serrano, A. De La Oliva, P. Patras, V. Mancuso, and A. Banchs, “Greening wireless communications: Status and future directions,”Comput. Commun., vol. 35, no. 14, pp. 1651– 1661, Aug. 2012.
[9] E. Hyytia, P. Lassila, J. Ott, and J. Kangasharju, “Floating in-formation with stationary nodes,” inModeling and Optimization in Mobile, Ad Hoc and Wireless Networks (WiOpt), 2012 10th International Symposium on, May 2012, pp. 361–366. [10] A. Chaintreau, P. Hui, J. Crowcroft, C. Diot, R. Gass, and
[11] A. Lindgren, C. Diot, and J. Scott, “Impact of communication infrastructure on forwarding in pocket switched networks,” in
Proceedings of the 2006 SIGCOMM Workshop on Challenged
Networks, ser. CHANTS ’06. New York, NY, USA: ACM,
2006, pp. 261–268.
[12] A. A. V. Castro, G. Di Marzo Serugendo, and D. Konstantas, “Hovering information - self-organising information that finds its own storage,” inSUTC ’08, 2008, pp. 193–200.
[13] J. Ott, E. Hyytia, P. Lassila, T. Vaegs, and J. Kangasharju, “Floating content: Information sharing in urban areas,” in Per-Com 2011, March 2011, pp. 136 –146.
APPENDIX A. Proof of Theorem 1
Lemma 1 (Frequency of contacts). The frequency with which two nodes come in contact in the AZ, in the Poisson Jump mobility model, is given byν =2µrR22.
Proof. Let us consider first the case in which the two nodes cannot jump out of the AZ. Assume first that one node is fixed, and the other jumps. As the location after the jump is uniformly distributed in the AZ, the chance of jumping within the transmission range of the fixed node is the ratio between
the coverage area of a node, πr2, and the area of the AZ,
πR2. Then the number of jumps needed for the jumping node
to come in range of the fixed one is geometrically distributed,
with mean Rr22. As 1/µ is the mean duration of the stopping
time, the mean amount of time for the two nodes to meet is
R2
µr2. The inverse of this quantity gives the frequency at which
such an event takes place. If we consider now that both nodes jump, the frequency with which the two nodes meet is two times greater than the one obtained when one is fixed.
In the Poisson Jumps mobility model, both nodes may exit the AZ after a jump. In an equilibrium state, the probability of a node jumping out is the same as a the probability of a new node jumping in, so that on average, the fact that nodes jumps in or out does not vary the mean rate of contacts between nodes in the AZ, with respect to the case of a closed system. Finally, when the system is in transient state (assuming the system starts from an empty state), the likelihood of a new node jumping into the AZ is higher than the likelihood of a node jumping out of the AZ, so that our computation of the frequency of contacts is conservative, and in any case it may be considered to be a valid approximation for the contact frequency over short time intervals.
Lemma 2 (Average availability). Consider an AZ in equilib-rium state, with an average number of nodes equal to N, and let n and m denote the average number of nodes with and without content, respectively. Assume nodes move according to the Poisson Jumps model. Thenm= minµ(1−p)
ν ,
γ µ(1−p)
and n= µ(1γ−p)−m, withν given by
2r2µ
R2 .
Proof. The number of nodes in the AZ and the number of nodes with/without content are usually described as stochastic processes. Here instead we focus on the evolution of the mean of these system parameters over time, which can be modeled
by the following differential equations:
dn(t)
dt = νn(t)m(t)−n(t)µ(1−p); dm(t)
dt = −νn(t)m(t)−m(t)µ(1−p) +γ.
The first term, in both equations, is derived as follows. Assuming the content to be uniformly distributed among nodes, the probability that a node has the piece of content
at time t is N(t)n(t). Then when two nodes come in range of
each other, the probability that piece of content is replicated is 2Nn(t)(t)1− n(t)
N(t)
. In the AZ at timetthere are N(t)(N(t)−1)
2 possible pairs of nodes. Thus, the average rate at which a
piece of content is transferred in the AZ at timetis given by
ν(N(t)−1)m(t)n(t)
N(t)
∼
=νn(t)m(t).
As for the second term in both differential equations, nµ
gives the average jumping rate within the AZ. Since only(1−
p)of those jumps goes out of the AZ, the rate at which nodes
with (resp. without) content jump out of the AZ isnµ(1−p)
(resp. mµ(1−p)). Finally, solving for the stationary case,
and noting that, from Little’s law, N =γE[T1−p] =γ 1
µ(1−p) =
λπR2, we getm= µ(1−p)
ν , withn=N−m.
Proof. (Theorem 1) We assume border effects are negligible,
which is a good approximation whenrR. The probability
of getting the content after a jump can be written as
pjump =
∞ X
j=1
P(j neighbors)·
· [1−P(0 out ofj neighbors have content)] ;
where P(j neighbors) is the probability of having j
nodes in an area equal to πr2. For the computation of
P(0out ofj neighbors have content), we consider that in a
stationary regime, and given that the location of each jump is uniformly distributed in the AZ, the probability for a node to
have the piece of content is n
N, independently of its position in
the AZ. Even in a stationary regime, this is an approximation, as the replication mechanism favors the formation of small clusters of users with content. However, in the settings we consider, node densities are well below those which allow a
strongly connected component to form, and r R. In such
conditions the connected components are small, so that this is a good approximation. Hence we have the following result:
pjump= ∞
X
j=1
(λπr2)j
j! e
−λπr2
"
1−
m
N
j#
.
(1−pjump)k+1 is the probability of not getting the piece of
content during a sojourn in the AZ in which a node jumped
k+ 1times into the anchor zone (including the first jump with
which the node entered the AZ). By summing over all possible
numbers of jumps k of a user during its sojourn in the AZ,
we get:
P =
∞
X
k=0
pk(1−p)h1−(1−p
jump)k+1
i