Per-frame Energy Consumption in 802.11 Devices
and its Implication on Modeling and Design
Pablo Serrano,
Member, IEEE,
Andres Garcia-Saavedra, Giuseppe Bianchi,
Albert Banchs,
Senior Member, IEEE,
and Arturo Azcorra,
Senior Member, IEEE
Abstract—This paper provides an in-depth understanding of the per-frame energy consumption behavior in 802.11 Wireless LAN devices. Extensive measurements are performed for 7 devices of different types (wireless routers, smart phones, tablets and embedded devices), and for both UDP and TCP traffic. Experimental results unveil that a substantial fraction of energy consumption, hereafter descriptively namedcross-factor, may be ascribed to each individual frame while it crosses the protocol stack (OS, driver, NIC) and is independent of the frame size. Our findings, summarized in a convenient energy consumption model, contrast traditional models which (implicitly) amortize such energy cost component in a fixed baseline cost or in a toll proportional to the frame size, and raise the alert that, in some cases, conclusions drawn using traditional energy models may be fallacious.
Index Terms—Wireless networks, energy measurements, power consumption, energy efficiency, energy modeling
I. INTRODUCTION
T
He increase in energy density of current state of the art (Lithium-Ion) batteries is far from following Moore’s Law, the current challenge being “just” a twofold density increase in the next 10 years [2]. This is not a good tech-nological premise behind the energy greediness of wireless connectivity, second only to that required to backlight displays in most handheld devices. Moreover, battery powered wireless devices are becoming ubiquitous, and are frequently part of the network infrastructure itself, where relays or opportunistic intermediaries are widely considered in ad-hoc, mesh, delay-tolerant networks , or emergency deployments. Additionally, for wireless systems powered via the grid it is also important to reduce energy consumption, to cut down the cost of operating the wireless infrastructure as well as its energy footprint.It is hence not a surprise that a huge research effort has been dedicated to thoroughly understand the power consumption behavior of real world wireless devices, as well as to find ways for reducing energy consumption in the wireless access
Manuscript received August 23, 2013; revised March 3, 2014; accepted April 18, 2014; approved by IEEE/ACM TRANSACTIONS ON NETWORK-ING Editor M. Meo. Date of publication xxxx xx, xxxx; date of current version xxxx xx, xxxx. This work has been supported by the European Community through the CROWD project (FP7-ICT-318115).
P. Serrano is with the University Carlos III of Madrid. A. Garcia-Saavedra is with Hamilton Institute (he was at University Carlos III of Madrid while doing this work). G. Bianchi is with the University of Roma Tor Vergata. A. Banchs and A. Azcorra are with the University Carlos III of Madrid and with the IMDEA Networks Institute.
Some preliminary results of our study, based on a limited set of experiments and one specific type of device, were presented at ACM CoNEXT 2012 [1]. This paper presents a much more thorough experimental analysis, comprising an exhaustive set of experiments and system aspects, performed over 7 devices of different types, and leading to a more complete energy consumption model.
Digital Object Identifier xx.xxxx/TNET.xxxx.xxxxxx
operation [3], [4]. For instance, with reference to the 802.11 WLAN (WiFi) technology [5], indeed the focus of this paper, energy efficiency improvements span very diverse aspects of the 802.11 operation, from management procedures [6], to usage of opportunistic relays [7] or infrastructure on demand [8], to PHY [9] and MAC [10] parameters’ optimization, etc. Obviously, aquantitativetreatment of the attainable energy improvements is greatly simplified by the availability of real-istic and accurate energy models, also considering that fine-grained per-frame experimental measurements (versus coarse aggregate power consumption statistics) are non trivial to achieve. Most literature works, including but not limited to [10]–[18], base their analyses, optimizations, or algo-rithm/protocol designs, on the widely accepted paradigm that the energy toll may be ascribed to two components: a baseline one, plus a second one linear with (transmission/reception) air time. The specific model’s parameters can be gathered from data sheets [19] or experimental measurements [20], [21].
With such a widespread acceptance, questioning the above mentionedclassicalenergy model seems tough. Actually, such model makes perfectly sense if we just focus on the network interface card consumption. But, in practice, processing in the host device drains energy as well. So, the question at stake is whether (and to what extent) there is some energy toll in the device, which is imputable to TX/RX processing, but is
improperly accounted in such classical model, e.g., because it can be neither considered (i) independent of the radio operation and thus (implicitly) accounted in the fixed baseline energy consumption component, nor (ii) strictly proportional to the traffic load in bytes, hence (implicitly) accounted in the linear air time energy cost component. Our paper not only raises this question (apparently unnoticed so far), but, more significantly, gives a (we believe) compelling answer, via extensive and tailored experiments that provide a detailed
anatomy of the energy consumption in the protocol stack. Two major findings appear to emerge. First, a substantial
energy consumption occurs while a frame is delivered across the protocol stack, namely from the operating system to the driver to the NIC (and conversely for reception). Such “new” energy cost component, descriptively referred to as
cross-factor, cannot be neglected; on the contrary, in some experiments it even accounts to more than half of the per-frame energy cost. Second, such cross-factor can be neither dealt with as an extra baseline component, nor (perhaps more surprisingly) as a cost proportional to the traffic load. Actually, this energy toll appears mostlyassociated to the very fact that a frame is handled, i.e., irrespective of the actual frame size in bytes. Traditional models which (implicitly) account for such
cost as proportional to the load may work as long as the frame size is fixed, but would yield incorrect results in the general case of variable frame sizes.
Our findings, wrapped into a new energy model, have a twofold implication. First, they suggest new energy reduction strategies, such as batching packets while they travel across the protocol stack, or avoiding stack crossing when possible. Second, the fact that a substantial amount of energy is drained by the processing of packet units, independent of their size or air time, may invalidate some specific optimizations proposed in the past. For instance, energy-efficient optimizations lever-aging relay nodes may yieldqualitatively differentconclusions when the cross-factor energy component is accounted for. In more detail, this paper contributes as follows.
Unveiling the cross-factor and new energy model. Tar-geted measurements reveal that a substantial fraction of energy is consumed by the processing of packets throughout the protocol stack. Most notably, such cross-factorappears to be a fixed per-frame toll, independent of the frame size.1 We summarize these findings in a new and more realistic energy model which overcomes traditional models limited to NIC consumption [10]–[18].
Model parametrization and cross-factor quantification. A very extensive measurement campaign is performed for 7 different devices, including qualitatively diverse ones, such as smart phones, tablets, embedded devices, wireless routers and Access Points, using different OS and HW. Experiments are performed for both UDP and TCP. On one side, a consistent
qualitative behavior in the energy consumption is found for all devices, thus confirming the general applicability of our proposed model; on the other side, results show noticeable quantitative differences in the model’s parameters, duly de-rived forallthe 7 devices.
Practical implications. Focusing on selected use-case ex-amples, we show that some energy optimizations proposed in the past may yield fundamentally different conclusions when revisited with the awareness of our more realistic energy consumption model. Our findings appear to raise the alert that there might be other cases where past conclusions should be reconsidered. Additionally, we discuss possible new means (entailing simplifications in the crossing of the protocol stack) to take advantage of our findings for improved energy efficiency. Every considered use case example is assessed for all the 7 considered devices to gauge their quantitative impact. Power consumption characterization. As a side contribu-tion, we present a measurement methodology that, in contrast to previous works, (i) provides accurate fine-grained per-packet energy measurements, and (ii) characterizes the total
device power consumption instead of just that consumed by the wireless interface. For those set-ups in which the accuracy of the measurement device is not sufficient, we exploit techniques to reduce uncertainties due to measurements inaccuracy.
1A posteriori, this fact might be eventually considered “obvious”: indeed, the most expensive OS/driver operations associated to the processing of a frame do not depend on the frame size. However, it seems fair to say that this fact was overlooked by the wireless community so far, and our merit is to raise attention on this, as well as provide its actual modeling and quantification.
II. RELATED WORK
Energy consumption of devices. A number of previous
works in the area analyze, like us, the consumption of the complete device, either a laptop [21]–[23] or a mobile phone [24], [25]. Some of these works deal with specific issues, such as quantification of the consumption of components other than wireless interfaces (e.g., CPU, screen, memory) [24], power consumption measurements via available APIs for estimating the battery discharge state [23], assessment of trade-off be-tween CPU consumption due to data compression and wireless consumption due to data transmission [22], but do not tackle the per-frame energy consumption domain. Only [21] briefly mentions that the energy consumption associated to packet processing might be non negligible, but does not provide any measurement or evidence. [25] finds that message size can have a non-intuitive impact on the energy consumption, but their guess is either the existence of some power management threshold or a bug in the wireless firmware (indeed, energy bugs in mobile devices are a real concern [26]). We distinguish from these works in the fact that we perform a fine-grained per-packet energy consumption decomposition, versus their energy consumption analyses on a much coarser scale.2
Energy consumption of interfaces. Unlike the previous
papers, most characterizations of the wireless interface con-sumption are done on a per-packet basis. The seminal work of [20] shows that transmission/reception of an 802.11 frame has a linear dependency on its length. This result is caused by the four different states a wireless NIC can be in, namely: sleep, idle, receiving and transmitting. [20] also identifies a fixed cost per frame, caused by control frames (e.g., RTS/CTS). The results are extended in [27] for different modulation and coding schemes and transmission power configurations, and a similar approach is followed in a recent work [28] for the case of 802.11n. While in these cases the 802.11 interface is treated as a whole, [29] distinguishes between the (approximately constant) Application-Specific Integrated Circuit (ASIC) consumption, and the Power Amplifier (PA) consumption occurring only outside idle periods. None of these works analyze the energy consumption of a frame as it is delivered to/from the NIC.
Energy consumption models. The (implicit or explicit)
assumption of all previous energy consumption models [10]– [18] is that the PA operations dominate the consumption of the whole device, which allows to model consumption with a finite number of states, e.g.,{active, idle}[11], [17],{transmission, reception, idle} [13]–[15], and so on. More specifically, the common approach followed by all these papers (as well as that recently included in the NS3 network simulator [30]) is to model the NIC consumption using data sheet parameters [19], and add to this a fixed amount to account for the non-wireless power consumption of the device. In [18], the authors propose an extended model that accounts for the power conversion efficiency of the PA, but eventually the model suffers from the same limitations. As we will see in this paper, these energy
consumption models fail to capture crucial aspects of how energy is consumed in real world devices, and therefore their use might bias conclusions.
Energy efficient mechanisms. Energy-efficient schemes
have been proposed at all layers of the 802.11 stack. Starting from the lowest layer, [9] pre-computes the optimal rate-power configuration for each data frame. Several works aim at reducing the energy wastage in the WLAN by adapting the contention parameters [10], [14] or extending the backoff operation [12], [16]. Cooperative relaying for energy efficiency is analyzed in [7]; [31] exploits idle period predictions to switch from active to sleep states. Increasing the sleep state time is the main energy saving target in the standard Power Saving Mechanism (PSM) [4], and in traffic management (and shaping) schemes such as NAPman [6], or in ‘infrastructure on demand’ schemes [8] devised to (de)activate Access Points based on client load. All these proposals are based either on (i) the energy consumption of the PA, which might be detailed but underestimates the consumption of the complete device, or on (ii) the coarse-grained estimated consumption of the complete device, which precludes a thorough understanding of the per-packet delivery implications.
III. ENERGY MEASUREMENT TESTBED
802.11 devices under study: In our experimental analysis, baseline results are obtained using a Soekris net4826-48 device, equipped with an Atheros AR5414-based 802.11a/b/g Mini-PCI card, and configured to use the 802.11a PHY. The hardware comprises a 233MHz AMD Geode SC1100 CPU, 2 Mini-PCI sockets, 128 Mbyte SDRAM and 256 Mbyte compact flash circuits for data storage, extended with a 2 GB USB drive. The OS is a Gentoo 10.0 Linux (kernel 2.6.24), and the driver is MadWifi v0.9.4.
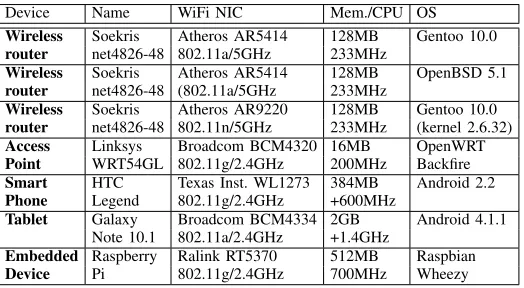
To rule out the possibility that our findings could be biased by the selected HW, OS/driver SW, or WLAN band/card/PHY, most of the paper’s experiments have been performed for other platforms (see Table I). This set of platforms include many different types of devices, such as wireless routers, Access Points, smart phones, tablets and embedded devices.3
In all experiments, traffic was generated using mgen.4
Additional devices in monitor mode were employed to track wireless channel activity and confirm it was caused only by our experiments, and that no packets were dropped at any layer of the protocol stack, events which would have biased our findings.
Power consumption measurements: Depending on the platform, power consumption was measured via two instru-ments. TheMonsoon FTA22Dpower meter5supplies a stable
voltage to the device and samples the power consumption at 5 KHz with high accuracy (±1%), thus providing very reliable fine-grained power measurements. However, this meter only supplies voltages of up to 5.4 V and could thus be employed only for the tablet Samsung Galaxy Note 10.1, the smartphone
3In addition to the results reported here for different platforms, the generality of our model is further confirmed by the some additional results reported in [1] as well as the measurements carried out independently in [32].
4http://cs.itd.nrl.navy.mil/work/mgen/
5http://www.msoon.com/LabEquipment/PowerMonitor/
TABLE I: Platforms considered.
Device Name WiFi NIC Mem./CPU OS
Wireless Soekris Atheros AR5414 128MB Gentoo 10.0 router net4826-48 802.11a/5GHz 233MHz
Wireless Soekris Atheros AR5414 128MB OpenBSD 5.1 router net4826-48 (802.11a/5GHz 233MHz
Wireless Soekris Atheros AR9220 128MB Gentoo 10.0 router net4826-48 802.11n/5GHz 233MHz (kernel 2.6.32) Access Linksys Broadcom BCM4320 16MB OpenWRT Point WRT54GL 802.11g/2.4GHz 200MHz Backfire Smart HTC Texas Inst. WL1273 384MB Android 2.2 Phone Legend 802.11g/2.4GHz +600MHz
Tablet Galaxy Broadcom BCM4334 2GB Android 4.1.1 Note 10.1 802.11a/2.4GHz +1.4GHz
Embedded Raspberry Ralink RT5370 512MB Raspbian Device Pi 802.11g/2.4GHz 700MHz Wheezy
HTC Legend and the Raspberry Pi. Measurements for the Soekris, Alix and Linksys platforms, which require higher voltage, were carried out using aPCE PA-6000power meter,6
which has a much coarser granularity than the Monsoon meter (namely about 3 samples/second). The PCE meter was powered with 6 AA batteries (AC supply via the wall socket would reduce accuracy), and we employed a Protek 3033B device to power the wireless device. Both for the Monsoon and the PCE meters, each sample provides the result of integrating the power consumed over the corresponding sampling period, and hence the average power consumption can be obtained by averaging all the samples. This setting permits to perform measurements without dismantlingthe device, as required by some specialized equipments, which would restrict experimen-tation to, e.g., devices using card extenders.
A major practical challenge was to reduce the errors asso-ciated to the measurements of the PCE PA-6000 power meter, which natively provides an accuracy of ∆v = 0.1V for the voltage and∆i= 0.01Afor the current. Taking into account the well-known fact that the relative error for the product
p = v·i is approximated by the sum of the relative errors for v and i, these inaccuracies yield a relative error in the measured power of above 5% for our typical baseline power measurements, undermining our ability to quantify small, but for our purposes meaningful, trends (e.g., power consumption variations for an increased frame size). The methodology that we followed to improve the accuracy of our measurements is to use, instead of a single device,Kdevicesrunning the same experiment in parallel over different non-interfering wireless channels. With this, the relative error of the measurements is reduced by 1/K. For 802.11g, we used the three non interfering channels, whereas we usedK= 4for 802.11a, thus improving accuracy to about 2% (see [1] for a more detailed explanation). This provides an accuracy comparable to that of [20], which only measures the power consumption of the wireless card.
IV. ENERGY CONSUMPTION ANATOMY
In order to characterize the power consumption of 802.11 devices, we have conducted an depth experimental in-vestigation of the considered 802.11 devices. Even though
TABLE II: Soekris Baseline consumption profile.
Config. Description Cons. (W)
w/o card no NIC connected 2.29±2.2%
WiFi off NIC connected 2.58±2.0%
driver not loaded (+0.29)
Idle(ρid) NIC activated+associated to AP 3.56±1.7% no RX/TX besides beacons (+0.98)
we conducted our measurements for all the platforms under study, for space reasons here we only present the detailed measurements for one of the platforms (the Soekris device with the Linux OS, in Sections IV-A to IV-C) and then provide a summary of the results obtained with other platforms/OS (Section IV-E). All the measurements presented here are for the devices operating under the infrastructure mode; however, we verified that the devices show a very similar behavior when operating under the ad-hoc and monitor modes.
A pre-requirement for the characterization of 802.11 devices is to quantify their “baseline” power consumption, i.e., when the devices neither send nor receive traffic. Table II reports measurements for the Soekris platform in three “baseline” con-figurations. Note that plugging the wireless card (“WiFi off”) increases consumption by 0.29 W (+12.6%), whereas loading the driver and associating to an AP (“Idle”) further increases the consumption by 0.98 W (an extra 25% increment). The power consumed in the “Idle” state, named ρid, will be used as baseline reference in what follows.
A. Understanding transmission costs
Results in this section aim at characterizing the energy cost of transmissions. To avoid biasing results with the ACK reception cost (separately quantified later on), the following results are obtained for unicastunacknowledgedframes. ACKs have been disabled by setting the noackpolicy bit of the WMM (Wi-Fi Multimedia) parameters for the Access Point parameter set: this introduces an Information Element in bea-con frames that prevents associated stations from replying with ACKs (confirmed by sniffed traces). Each result is obtained by measuring the power consumption over a 20 seconds experiment. Unless otherwise specified, all experiments are based on UDP traffic.
Transmission power consumption patterns: Measurements
of total device power consumption have been carried out
spanning all the combinations of the following four param-eters: (i) frame size L from 80 to 1500 in steps of 20 bytes, (ii) modulation and coding schemes MCS ∈ {6, 12, 24, 48} Mbps, (iii) configured transmission power txpower ∈ {6, 9, 12, 15}dBm, and (iv) frame generation ratesλg from 100 to 2000 in steps of 100 frames per second (fps).
As we observe from the above mesurements that, for a given
txpower,λgand MCS configuration, power consumption
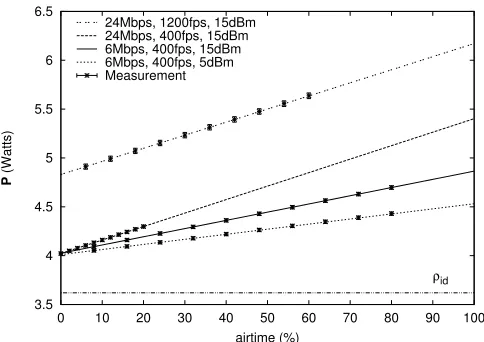
in-creases proportionally to the air time, it turns out that the most insightful way to represent such results is via apower/airtime plot shown in Fig. 1. Such plot reports the average power consumed by the whole device, versus the channel airtime percentageτtx=λgTL, whereλg is the frame generation rate (kept below saturation), andTL=TP LCP + (H+L)/M CS
3.5 4 4.5 5 5.5 6 6.5
0 10 20 30 40 50 60 70 80 90 100
P
(Watts)
airtime (%)
ρid
24Mbps, 1200fps, 15dBm 24Mbps, 400fps, 15dBm 6Mbps, 400fps, 15dBm 6Mbps, 400fps, 5dBm Measurement
Fig. 1: Total power consumed by (unacknowledged) transmissions vs. airtime percentageτtx.
is the time required to transmit a frame of size L using the modulation and coding scheme MCS, duly accounting for the Physical Layer Convergence Protocol preamble TP LCP, and the MAC overheadH (MAC header plus FCS). The plot shows the values resulting from applying a simple linear regression to all the samples obtained for a given configuration, as well as the corresponding standard asymptotic error, which is computed with the assumption that the error of each individual sample is normally distributed [33]. For reference purposes, the plot also depicts the baseline power consumptionρidwhen the target device is in “Idle” state. From the plots, it clearly appears that the total device power consumption, denotedP, is articulated into three main components:
P=ρid+Ptx+Pxg(λg), (1)
where:
• The first component,ρid, is the (platform-specific) base-line power consumption;
• The second component,Ptx, is the classical one in tradi-tional energy consumption models, which linearly grows with the airtime percentageτtx, i.e.,Ptx =ρtxτtx. The slopeρtx depends on the radio transmission parameters MCS andtxpower: the greater MCS and/ortxpower, the greater the slope;
• The third component, Pxg(λg), accounts for the fact that the above linear trend starts from a relatively large positive offset over the baseline level ρid (+12% and +35% increment for 400 and 1200 fps, respectively); offset which isnot accounted by classical energy models
[10]–[18]. Moreover, Fig. 1 suggests that such component depends only on the frame generation rate λg.
Results obtained for the remaining target platforms confirm the same behavior as the one described by (1) for all platforms, each of them with its specific parameter values (reported in Section IV-E).
0 0.5 1 1.5 2 2.5
0 500 1000 1500 2000
Pxg
(Watts)
λg (fps)
6Mbps,15dBm 12Mbps,15dBm 24Mbps,15dBm
48Mbps,15dBm 12Mbps,12dBm 24Mbps,12dBm
48Mbps,9dBm
Fig. 2: Relation betweenPxg(λg)andλg.
TCP/IP Driver ASIC PA
Kernel space Wireless NIC
mgen User space
(a) (b) (c)
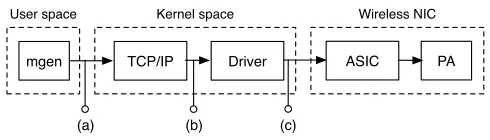
Fig. 3: Interfaces/modules crossed during transmission.
(MCS, txpower). The plot clearly shows that Pxg(λg) is proportional to the frame generation rate λg, whereas it is practicallyindependent ofthe frame size or the radio settings. Thus, if we denote withγxg=Pxg(λg)/λg the proportion-ality constant, it appears that γxg is theenergy toll associated to the processing of each individual frame, irrespective of its size or radio transmission parameters. Note that this energy toll isnotassociated to protocol operations such as RTS/CTS or ACKs, indeed disabled in such experiments. For reasons that will become clear throughout this section, we call this per-frame energy toll the cross-factor.
Cross-factor: To grasp a deeper insight on the reasons behind the cross-factor γxg, we have engineered tailored measurements devised to quantify how the energy toll splits across the frame processing chain along the protocol stack depicted in Fig. 3. Specifically, we have run three sets of experiments, where we discard packets at a given level of the stack and measure the power consumed up to that level:
• App.- packets are generated bymgen, but are discarded before being delivered to the OS, i.e., at the mark (a) in Fig. 3, by sending them to the “sink device”
(/dev/null);
• TCP/IP - packets are discarded at the bottom of the
TCP/IP stack (mark (b) in Fig. 3), by deactivating the ARP lookup function, so that the device cannot retrieve the MAC destination from the ARP cache and therefore must drop the frame;
• Driver- packets are discarded after the MadWifi driver’s processing (mark (c) in Fig. 3), by commenting the
hardstart command which performs the actual
de-livery of the frame to the NIC.
0 0.2 0.4 0.6 0.8 1.0 1.2 1.4 2.2 2.4 2.6
App.TCP/IPDriverTotalModel App.TCP/IPDriverTotalModel App.TCP/IPDriverTotalModel App.TCP/IPDriverTotalModel App.TCP/IPDriverTotalModel 0 0.2 0.4 0.6 0.8 1.0 1.2 1.4 2.2 2.4 2.6
per-frame energy (mJ)
48Mbps 100B/Packet
300 fps
48Mbps 100B/Packet
1200 fps
48Mbps 750B/Packet
1200 fps
48Mbps 1400B/Packet
1200 fps 6Mbps 1400B/Packet
400 fps
Measurement Model: transmission Model: cross-factor
≈ ≈
Fig. 4: Per-frame energy cost in transmission.
Representative measurements (energy per frame) are shown in Fig. 4, along with the total energy consumption per prop-erly transmitted frame (‘Total’) and the values predicted by applying (1) (‘Model’).
The figure clearly shows that the energy toll due to frame processing is practically independent ofthe frame generation rate and the frame size.7 Moreover, it shows that the energy consumed while crossing the host device stack (i.e., up to the driver included) issubstantial, around 0.75 mJ per frame, and may become themajorenergy cost in several scenarios (e.g., short packets and/or large MCS - in essence short airtime).
Finally, even if direct measurements cannot be attained below the driver level, Fig. 4 shows that a further constant per-frame energy drain occurs at the driver-to-NIC interface level and/or below. Its quantification may be estimated by measuring the energy consumed with very short packets and large MCS, as wireless transmission cost is marginal in this case (very small airtime). Summarizing, for the Soekris device, the cross-factor coefficient amounts to about 0.93 mJ/frame. Such per-frame processing cost appears to roughly split as follows: 24% application; 33% TCP/IP stack, 21% driver, and 22% NIC.
Retransmissions: The above results seem to suggest that retransmissions at the MAC layer, e.g. caused by an unac-knowledged transmission, should not be affected by the cross-factor toll. This can be verified byprovisionally assumingthat this is the case, i.e., modeling retransmission cost as purely due to the over the air transmission cost component, and then checking whether the resulting model matches experimental measurements. Hence, let Pretx be the power drained by retransmissions, and assume that
Pretx=R·ρtxτtx =R·ρtxλgTL. (2)
where R is the number of retransmissions. Then, the total
power consumed by packets retransmitted R times, PR, is
readily obtained as:
PR=Pxg(λg) +Ptx+Pretx, (3)
where the first addendum is the per-frame processing toll (paid once), the second addendum is the power consumed by the very first transmission, and the last addendum is the extra retransmission cost as per (2). Fig. 5 compares the modeling prediction of (3) with the power (additional to the baseline component ρid) consumed by a device configured to send 1400 B frames generated at a rate of 80 fps to fake addresses (to prevent the reception of ACKs). The number of allotted retransmissions R (configured via the ah_setupTxDesc driver’s descriptor) was varied from 0 to 5, and, for simplicity (i.e., to avoid the need to non trivially configure the driver so as to prevent MCS downgrade in front of persistent losses), frames were transmitted using the 6 Mbps basic MCS. As shown in Fig. 5, theoretical results tightly match the exper-imental measurements, thus confirming that the cross-factor has (if any) a negligible impact on retransmissions.
0 0.2 0.4 0.6 0.8 1
0 1 2 3 4 5
Pxg
+P
tx
+P
retx
(Watts)
R Measurement
Model: Pxg Model: Ptx Model: Pretx
Fig. 5: Impact of retransmissions on power consumption.
B. Reception power consumption analysis
The analysis of the power consumption of the device while
receivingframes is somewhat dual to that carried out in depth for the previous transmission case, and hence will be presented with less detail for the sake of conciseness. We use the same configurations of MCS and txpower as in Section IV-A (ACK disabled as well), with different combinations of the frame length L and frame reception rate λr. The resulting power/airtime plot is shown in Fig. 6, airtime now given by
τrx = λrTL. Results for the txpower parameter are not shown, as this parameter does not affect the receiver’s power consumption (as indeed well known from [27]).
Fig. 6 exhibits the same qualitative pattern found in the transmission scenario. The increment of the power consump-tion overρidis composed of two components: a first one linear with the airtime and accounting for the power required to receive frames, Prx (indeed in line with traditional energy models), and a second one proportional to the number of frames received and accounting for the cross-factor energy
3.4 3.6 3.8 4 4.2 4.4 4.6
0 10 20 30 40 50 60 70 80 90 100
P
(Watts)
airtime (%)
ρid 24Mbps, 400fps
6Mbps, 400fps 6Mbps, 300fps 6Mbps, 200fps Measurement
Fig. 6: Power consumed by (unacknowledged) reception versus airtime.
toll, Pxr(λr). The total power consumption at the receiving side is thus:
P=ρid+Prx+Pxr(λr) =ρid+ρrxτrx+λrγxr, (4)
where γxr is the cross-factor in reception, i.e., the energy processing toll to deliver the received frame across the protocol stack, andρrxτrxis the traditional reception cost proportional to the airtime. Again, Fig. 6 confirms that results from the above equation (lines) match well the experimental measure-ments (symbols).
C. Characterization of ACKs, control frames, collisions
To complete our analysis, it remains to characterize the additional power consumed for sending/receiving acknowl-edgments (the previous subsections have considered unac-knowledged operation), and the power consumption caused by overhearing a collision.
ACKs and other control frames: Since ACK frames, like retransmissions, do not have to cross the stack but are internally generated by the NIC, we make the hypothesis that
0 0.2 0.4 0.6 0.8 1 1.2 1.4 1.6
6 Mbps 100B
6 Mbps 550B
48 Mbps 100B
48 Mbps 550B
48 Mbps 1000B Pxr
+P
rx
+P
tx,Ack
(Watts)
Measurement
Model: Pxr + Prx Model: Ptx,Ack
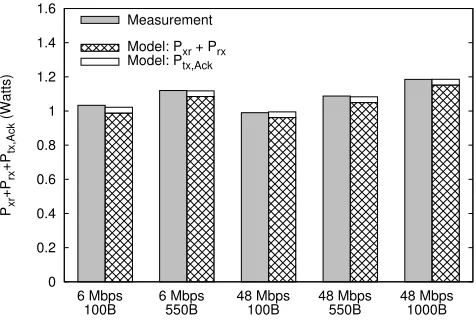
their power consumption can be characterized by just the cost of the relevant ACK transmission or reception. Under such hypothesis, the power consumed for replying with ACKs to received frames (arriving at rateλr) is trivially given by
Ptx,Ack=ρtxλrTAck, (5)
where TAck =TP LCP +ACK/M CSC is the time required to transmit an ACK frame, i.e., a PLCP preamble plus the 14B ACK frame transmitted at the modulation and coding scheme M CSC configured for control traffic. Similarly, the power consumed to receive an ACK is readily computed as
Prx,Ack=ρrxλgTAck. (6)
Fig. 7 shows the experimental validation for the ACK transmission case. Such experimental results, obtained with
λr = 1000 fps, confirm that the measurements match the results predicted by the model, which includes the energy consumed by the reception of frames (Pxr +Prx) and the transmission of the ACKs (Ptx,Ack). Similar findings hold for RTS and CTS frames (not shown here for space reasons).
Collisions and other transmissions: Finally, we analyze the impact on the energy consumption in reception when the medium is occupied by collisions or by transmissions addressed to another device (i.e., to another MAC address). For this purpose, we configured a communication between two nodes and set up another node to act as interferer. The sender and the interferer were configured with the carrier sense threshold at the highest value, which practically results in no carrier sensing, and the interferer used the lowest values for theCW,SIF SandM CSparameters while deactivating the use of ACKs, resulting in practically continuous transmission. To control the amount of time the interferer was sending data (i.e., the ‘interference rate’), we used the quiet element option to silence the interface for a given amount of time every beacon period. With this setting, the interferer transmits continuously during a long period, emulating thus the typical behavior of collisions with carrier-sensing which always affect frame transmissions from the beginning.8Prior to our measure-ments, we performed extensive tests using differenttxpower configurations and varying the relative position of the devices, to find a setting in which simultaneous transmissions resulted in all frames being lost (i.e., no capture effect).
Table III presents the measured power consumption for different sending and interference rates. We observe that (i) the power consumed in reception depends exclusively on the traf-fic actually received (see, e.g., when the interference rate goes from 0% to 50%), and (ii) collisions have the same impact as an idle medium (e.g., the cases with 100% interference rate coincides withρid). Based on this, we conclude that collisions have no practical impact on the energy consumption at the receiver (this is confirmed by the results of the model included in the table). Note that, for the transmitter, collisions have already been modeled in our analysis of retransmissions.
8Note that, with hidden nodes, interfering frames could also arrive at a later point of the frame transmission. However, the measurements of [34] show that such interfering frames, which do not affect the preamble, need to have a very high power to cause a transmission error.
TABLE III: Impact of collisions on reception.
Frames/s Interference Frames/s Measured Model
sent rate received power
100 fps 0% 100 fps 3.67 W 3.68 W 200 fps 50% 100 fps 3.67 W 3.68 W 200 fps 100% 0 fps 3.56 W 3.56 W 200 fps 0% 200 fps 3.80 W 3.81 W 400 fps 50% 200 fps 3.80 W 3.81 W 400 fps 100% 0 fps 3.56 W 3.56 W
To analyze the impact of the transmissions addressed to another station, we configured a communication between two nodes and measured the energy consumption at a third node that was in the transmission range of this communication. We observed that the energy consumed by this node was the same as if the medium was idle, which shows that transmissions addressed to other stations practically do not consume energy. This is in agreement with our previous results: according to (4), the energy cost of listening to the PLCP plus headers is only 38 µJ/frame (for 6 Mbps MCS), which has practically no impact on the overall consumption.
D. Impact of CPU usage
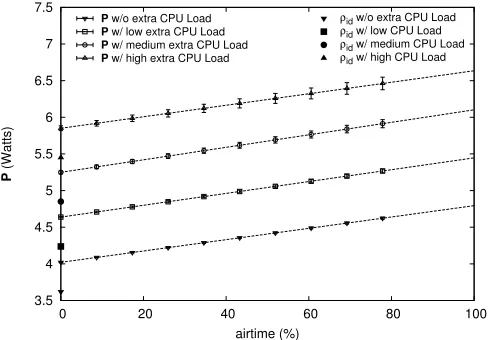
All the experiments shown so far have been performed without any application running on the device. To understand whether the CPU usage by applications has any impact on the conclusions drawn, we performed an additional experiment with a tailored application running in parallel to the transmis-sion/reception of packets. Fig. 8 shows the result of repeating the baseline experiment of Fig. 1 with this application running on the device, calibrated to induce a low (25%), medium (50%) and large (75%) load on the CPU, respectively. We observe that the energy consumption behavior is the same as in Fig. 1, with the only difference that the baseline consumptionρid is shifted due to the extra energy consumed by the application: on top ofρid, there is an offset with respect to the baseline consumption caused by the cross-factor (which takes the same value as in Fig. 1 independent of the CPU load) and then power consumption increases linearly with the airtime. This confirms that the CPU usage has no impact on the power consumption behavior of transmitting/receiving packets.
E. Other devices
The results provided in the previous subsections have been obtained for one particular hardware platform (the Soekris device) running one specific OS (Linux Gentoo 10.0). To verify that the behavior observed in those subsections is not specific of the chosen reference device, OS or WLAN band/card/PHY, we repeated all the experiments for each of the platforms listed in Table I. Results, not reported for space reasons (a summary of findings per each device is provided in Table IV) fully confirm the qualitative behavior discussed before, thus suggesting that the conclusions drawn above respond togeneral energy consumption patternsof all 802.11 wireless devices (or at least a very wide range).
0 20 40 60 80 100
TX
1500BTX100BRX1500BRX100B TX1500BTX100BRX1500BRX100B TX1500BTX100BRX1500BRX100B TX1500BTX100BRX1500BRX100B TX1500BTX100BRX1500BRX100B TX1500BTX100BRX1500BRX100B TX1500BTX100BRX1500BRX100B
per-frame energy decomposition (%)
Raspberry Pi Galaxy
Note 10.1 HTC
Legend Soekris
OpenBSD Linksys
Soekris 802.11n Soekris Linux
Tx/Rx Cross-Factor
Fig. 9: Fraction of the cross-factor over the total per-frame energy consumption cost.
3.5 4 4.5 5 5.5 6 6.5 7 7.5
0 20 40 60 80 100
P
(Watts)
airtime (%)
P w/o extra CPU Load
P w/ low extra CPU Load
P w/ medium extra CPU Load
P w/ high extra CPU Load
ρid w/o extra CPU Load ρid w/ low CPU Load ρid w/ medium CPU Load ρid w/ high CPU Load
Fig. 8: Power consumption with an application running on the device.
key results drawn from the previous subsections is that the cross-factor has a substantial impact over the total energy consumed by a frame. In order to gain insight on the weight of the cross-factor in different platforms and OS, Fig. 9 depicts, for each of the devices of Table I, how the per-frame energy consumption is decomposed into the following two components: the cross-factor component (Pxg and Pxr) and the transmission/reception component (Ptx or Prx). Results are provided for M CS = 48 Mbps (except for the “Soekris 802.11n”, for which we use M CS index 6), txpower= 15 dBm and two different packet lengths (100 and 1500 bytes).9
For those devices that do not implement CPU scaling, we used the default CPU frequency configuration, while for those that implement it (HTC Legend and Galaxy Node) we used the largest CPU frequency.10
9Since the transmission/reception component is proportional to the packet length, by evaluating very large (1500 bytes) and very small (100 bytes) packets we cover the the two extreme cases for the weight of thecross-factor. 10CPU scaling adaptively sets the CPU frequency based on the CPU load. As we observed that this leads to quite unpredictable consumption, we disabled this function in our experiments and set the CPU frequency to a fixed value. Table IV shows the impact of different CPU frequency values on energy consumption.
From the results obtained, we observe that thecross-factor
has a very significant weight in the vast majority of the devices and configurations studied, as it accounts for more than 50%
of the per-frame energy consumption in most cases. Only for the cases of transmitting large packets with the Galaxy Note, the HTC Legend or the Raspberry Pi, the cross-factor has a smaller (but still very substantial) weight; in particular, in these cases the cross-factor accounts for more than 30% of the energy consumed by a frame.
From the results reported above, we draw the following conclusions: (i) the behavior observed along this section is not specific for the Soekris device but is generalized to all the devices under study, which includes a very representative set of the types of 802.11 devices of practical interest; (ii) the qualitative behavior with different operating systems (Linux and OpenBSD) is the same, and the cross-factor is of the same order for both (although, as expected, the specific values are slightly different as a result of the different protocol stack implementation); and (iii) the weight of the cross-factor on the per-frame energy consumption is very substantial in all cases, even though as expected it is a bit smaller for those devices that rely on a more energy efficient design.
V. ENERGY CONSUMPTION MODEL
The findings (1)–(6) gathered in the previous section can be conveniently summarized into acomplete modelfor the power consumption of 802.11 devices. Indeed, the power consumed by an 802.11 device consists of the following components: (i) the idle consumption, ρid, (ii) the cross-factor for the packets generated by the application, Pxg, (iii) the power required to transmit them, Ptx, (vi) the power consumed in retransmissions, Pretx, (v) the power spent in receiving frames, Prx, (vi) the cross-factor for the received frames,
Pxr, and (vii) the power spent on sending and receiving ACK frames, Prx,Ack andPtx,Ack:
we obtain:
P = ρid+ρtx(λgTL+λgTLR+λrTAck)
+ ρrx(λrTL+λgTAck) +γxgλg+γxrλr. (8)
By taking into account that λgTL + λgTlR + λrTAck corresponds to the transmission airtime percentage τtx, and
λrTL+λgTAckto reception airtime percentageτrx, the above equation can be rewritten as:
P=ρid+ρtxτtx+ρrxτrx+γxgλg+γxrλr. (9)
The above expression gives the model for the power con-sumption of an 802.11 device that we propose in this paper. Out of the 9 variables in this expression, 5 of them (ρid,ρtx,
ρrx,γxr andγxg) are constant parameters that depend on the device and the configuration of its communication parameters, while the other 4 parameters (τtx,τrx,λrandλg) are variables that depend on the number of stations in the WLAN and their traffic generation behavior.
As already mentioned in the previous section, the key differ-ence between the above model and the ‘traditional’ one used in many previous works [10]–[18] is that the traditional model only includes the first three components (namely ρid, ρtxτtx andρrxτrx) while our model adds to these three components two additional ones (γxrλr and γxgλg). As shown by our measurements, these two additional components account for a very significant portion of the power consumption, which renders the traditional model highly inaccurate.
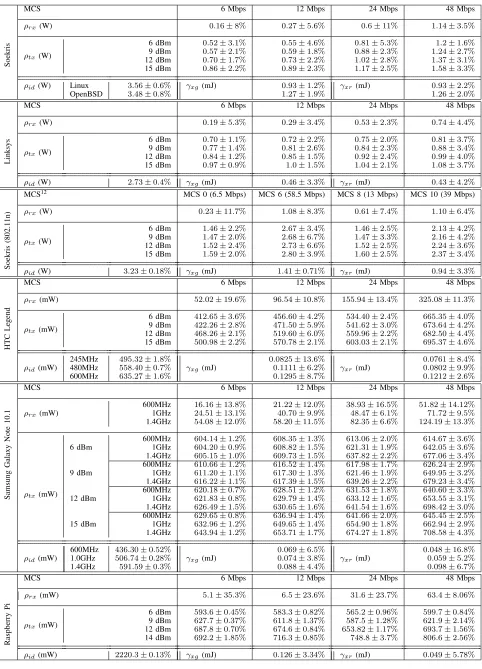
Parametrization of the model: In order to characterize the power consumption of an 802.11 device, we need to parametrize the 5 constant parameters in (9) for the device. One of the contributions of this paper is the obtention of these 5 parameters for all the devices under study: Soekris (with Linux and OpenBSD), Alix, Linksys, HTC Legend, Samsung Galaxy Note and Raspberry Pi. The numerical values are given in Table IV for the different M CS andtxpower configurations, as well as different CPU frequencies for those devices that support CPU scaling. To obtain these values, we have applied the expressions for the simple linear regression and the standard asymptotic error [33]. Some observations revealed by our parametrization are:
• Most cards show moderate differences of ρtx for dif-ferent M CS, except for the Soekris (the only device with Atheros), whose power consumption increases sub-stantially for large M CS. In contrast, differences are significant for all devices in reception mode.
• As expected, receiving (ρrx) consumes substantially less power than transmitting (ρtx) in most cases. However, for some of the devices (Soekris, Linksys), receiving is almost as costly as transmitting, or even more, for large
M CS.11
• While the difference on the energy consumed by different devices is relatively small in transmission mode (ρtx is of the same order of magnitude for most devices, the dif-ferences in reception mode are much higher (difdif-ferences inρrx are larger than one order of magnitude).
11A possible explanation for the behavior observed is the the consumption from the adaptive amplifier at the receiver, which places the power of the receiving signal within two thresholds where the AD converter works well.
• The CPU frequency has little impact on the power consumed by the NIC-specific parts: the values of ρtx andρrxare the same for different CPU frequencies with the HTC Legend (only one value is given in the table) and they are also similar for the Samsung Galaxy Note. • The cross-factor for sending and receiving (γxgandγxr)
is of the same order of magnitude for most devices. • For 802.11n, the values of ρtx are similar for MCS 0
and 8; as both MCS 0 and 8 use the same modulation (BPSK) and coding rate (1/2) while MCS 8 uses two spatial streams, this may indicate that the driver/HW does not turn off the RF chains that are unused.
Model Validation with multiple stations: To validate our model in a general scenario with multiple sending and receiv-ing stations, we consider a WLAN with one AP and three stations. Each station generates unicast traffic to the AP at a rate G, while the AP sends unicast traffic at the same rate G
to each station. To apply the model of (9), we need to obtain the parameters τtx, τrx, λr and λg. These can be obtained from typical statistics recorded by the wireless driver, namely, number of generated frames (Ng), successful frames (Ntx), transmissions attempts (Nat), and received frames (Nrx). With these, if the experiment is run for a duration ofT,λg andλr are computed as
λg=Ng/T, λr=Nrx/T. (10)
To computeτtx we account for all transmission attempts of the device plus the time spent sending the Acks, i.e.,
τtx= (NatTL+NrxTAck)/T. (11)
Similarly, to computeτrxwe need to take into account the frames and the Acks received,
τrx= (NrxTL+NtxTack)/T. (12)
We compare the energy consumption given by our model, fed with the above driver statistics, against the energy con-sumption measurements. Fig. 10 depicts these results for var-ious combinations of LandM CS, sweeping along different traffic generation ratesGin the x axis. We conclude from the figure that the proposed model is able to accurately predict the power consumption in a general scenario.
TABLE IV: Parametrization of the energy model for all the devices under study.
MCS 6 Mbps 12 Mbps 24 Mbps 48 Mbps
Soekris
ρrx(W) 0.16±8% 0.27±5.6% 0.6±11% 1.14±3.5%
ρtx(W)
6 dBm 0.52±3.1% 0.55±4.6% 0.81±5.3% 1.2±1.6%
9 dBm 0.57±2.1% 0.59±1.8% 0.88±2.3% 1.24±2.7%
12 dBm 0.70±1.7% 0.73±2.2% 1.02±2.8% 1.37±3.1%
15 dBm 0.86±2.2% 0.89±2.3% 1.17±2.5% 1.58±3.3%
ρid(W) Linux 3.56±0.6% γxg(mJ) 0.93±1.2% γxr (mJ) 0.93±2.2%
OpenBSD 3.48±0.8% 1.27±1.9% 1.26±2.0%
MCS 6 Mbps 12 Mbps 24 Mbps 48 Mbps
Linksys
ρrx(W) 0.19±5.3% 0.29±3.4% 0.53±2.3% 0.74±4.4%
ρtx(W)
6 dBm 0.70±1.1% 0.72±2.2% 0.75±2.0% 0.81±3.7%
9 dBm 0.77±1.4% 0.81±2.6% 0.84±2.3% 0.88±3.4%
12 dBm 0.84±1.2% 0.85±1.5% 0.92±2.4% 0.99±4.0%
15 dBm 0.97±0.9% 1.0±1.5% 1.04±2.1% 1.08±3.7%
ρid(W) 2.73±0.4% γxg(mJ) 0.46±3.3% γxr (mJ) 0.43±4.2%
MCS12 MCS 0 (6.5 Mbps) MCS 6 (58.5 Mbps) MCS 8 (13 Mbps) MCS 10 (39 Mbps)
Soekris
(802.11n)
ρrx(W) 0.23±11.7% 1.08±8.3% 0.61±7.4% 1.10±6.4%
ρtx(W)
6 dBm 1.46±2.2% 2.67±3.4% 1.46±2.5% 2.13±4.2%
9 dBm 1.47±2.0% 2.68±6.7% 1.47±3.3% 2.16±4.2%
12 dBm 1.52±2.4% 2.73±6.6% 1.52±2.5% 2.24±3.6%
15 dBm 1.59±2.0% 2.80±3.9% 1.60±2.5% 2.37±3.4%
ρid(W) 3.23±0.18% γxg(mJ) 1.41±0.71% γxr (mJ) 0.94±3.3%
MCS 6 Mbps 12 Mbps 24 Mbps 48 Mbps
HTC
Le
gend
ρrx(mW) 52.02±19.6% 96.54±10.8% 155.94±13.4% 325.08±11.3%
ρtx(mW)
6 dBm 412.65±3.6% 456.60±4.2% 534.40±2.4% 665.35±4.0%
9 dBm 422.26±2.8% 471.50±5.9% 541.62±3.0% 673.64±4.2%
12 dBm 468.26±2.1% 519.60±6.0% 559.96±2.2% 682.50±4.4%
15 dBm 500.98±2.2% 570.78±2.1% 603.03±2.1% 695.37±4.6%
245MHz 495.32±1.8% 0.0825±13.6% 0.0761±8.4%
ρid(mW) 480MHz 558.40±0.7% γxg(mJ) 0.1111±6.2% γxr (mJ) 0.0802±9.9%
600MHz 635.27±1.6% 0.1295±8.7% 0.1212±2.6%
MCS 6 Mbps 12 Mbps 24 Mbps 48 Mbps
600MHz 16.16±13.8% 21.22±12.0% 38.93±16.5% 51.82±14.12%
Samsung
Galaxy
Note
10.1
ρrx(mW) 1GHz 24.51±13.1% 40.70±9.9% 48.47±6.1% 71.72±9.5%
1.4GHz 54.08±12.0% 58.20±11.5% 82.35±6.6% 124.19±13.3%
600MHz 604.14±1.2% 608.35±1.3% 613.06±2.0% 614.67±3.6%
ρtx(mW)
6 dBm 1GHz 604.20±0.9% 608.82±1.5% 621.31±1.9% 642.05±3.6%
1.4GHz 605.15±1.0% 609.73±1.5% 637.82±2.2% 677.06±3.4%
600MHz 610.66±1.2% 616.52±1.4% 617.98±1.7% 626.24±2.9%
9 dBm 1GHz 611.20±1.1% 617.30±1.3% 621.46±1.9% 649.95±3.2%
1.4GHz 616.22±1.1% 617.39±1.5% 639.26±2.2% 679.23±3.4%
600MHz 620.18±0.7% 628.51±1.2% 631.53±1.8% 640.60±3.3%
12 dBm 1GHz 621.83±0.8% 629.79±1.4% 633.12±1.6% 653.55±3.1%
1.4GHz 626.49±1.5% 630.65±1.6% 641.54±1.6% 698.42±3.0%
600MHz 629.65±0.8% 636.94±1.4% 641.66±2.0% 645.45±2.5%
15 dBm 1GHz 632.96±1.2% 649.65±1.4% 654.90±1.8% 662.94±2.9%
1.4GHz 643.94±1.2% 653.71±1.7% 674.27±1.8% 708.58±4.3%
600MHz 436.30±0.52% 0.069±6.5% 0.048±16.8%
ρid(mW) 1.0GHz 506.74±0.28% γxg(mJ) 0.074±3.8% γxr (mJ) 0.059±5.2%
1.4GHz 591.59±0.3% 0.088±4.4% 0.098±6.7%
MCS 6 Mbps 12 Mbps 24 Mbps 48 Mbps
Raspberry
Pi
ρrx(mW) 5.1±35.3% 6.5±23.6% 31.6±23.7% 63.4±8.06%
ρtx(mW)
6 dBm 593.6±0.45% 583.3±0.82% 565.2±0.96% 599.7±0.84%
9 dBm 627.7±0.37% 611.8±1.37% 587.5±1.28% 621.9±2.14%
12 dBm 687.8±0.70% 674.6±0.84% 653.82±1.17% 693.7±1.56%
14 dBm 692.2±1.85% 716.3±0.85% 748.8±3.7% 806.6±2.56%
ρid(mW) 2220.3±0.13% γxg(mJ) 0.126±3.34% γxr (mJ) 0.049±5.78%
10.6 10.8 11 11.2 11.4 11.6 11.8 12
0 0.1 0.2 0.3 0.4 0.5 0.6 0.7 0.8
Total Power (Watts)
G (Mbps) Model
6Mbps, 1500B 12Mbps, 500B 24Mbps, 500B 48Mbps, 1500B
Fig. 10: Model validation with multiple stations.
of TCP segments, which is of γxg tcp = 1.38mJ (all other energy components remain the same), indeed almost 50% larger than that previously measured for UDP.
To further evaluate the energy consumed by processing the TCP ACKs, we have repeated the same experiment as above with the unmodified TCP stack, with results in a cross-factor of 2.1mJ. Since the main difference between the modified TCP stack and the unmodified one is the processing of TCP acknowledgements, by subtracting from this cross-factor the one measured above we obtain the energy toll for receiving TCP ACKs, i.e. γxr tcpack = 2.1−1.38 = 0.72mJ. Note that this result is in line with the one above, since as compared to TCP segments, TCP ACKs require less processing and do not involve the application layer (which, as shown in Fig. 4, accounts for a significant portion of the cross-factor).
Following the above findings, we can extend model (9) as follows in order to account for all traffic types:
P = ρid+ρtxτtx+ρrxτrx+ X
i∈K
γiλi. (13)
where γi and λi are the cross-factor and sending rate, respectively, and K is the set of different frame types, which includes transmitted and received UDP packets as well as TCP data packets and TCP ACKs, i.e., K =
{xg, xr, xg tcp, xr tcp, xg tcpack, xr tcpack}.
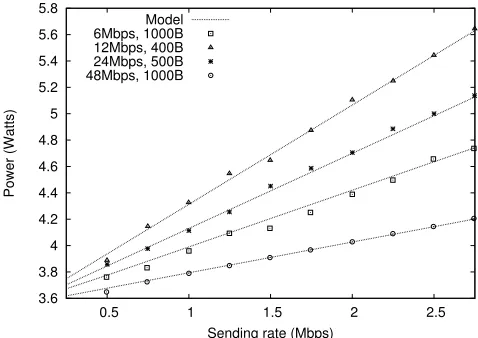
In order to validate the extended model, we have measured the energy consumed by a TCP session between two stations for different different configurations of theM CS, packet size and sending rate. The results on the energy consumed by the sender, depicted in Fig. 11, show that the energy consumption predicted by the model closely matches our measurements, which confirms the accuracy of the proposed extension.
VI. IMPLICATIONS ON DESIGN
The new energy consumption insights gathered in this paper may have significant implications on the design of energy-efficient mechanisms. On the one hand, existing schemes may need to be revisited so as to properly account for the impact of the cross-factor component. Indeed, according to traditional power consumption models (i.e., only baseline component
3.6 3.8 4 4.2 4.4 4.6 4.8 5 5.2 5.4 5.6 5.8
0.5 1 1.5 2 2.5
Power (Watts)
Sending rate (Mbps) Model
6Mbps, 1000B 12Mbps, 400B 24Mbps, 500B 48Mbps, 1000B
Fig. 11: Model validation for TCP.
plus a toll proportional to the airtime), mechanisms yielding shorter airtimes wouldsurely bring about energy gains. With the cross factor, this might not be anymore the case, when the power savings attained at the radio interface are paid with an increased frame handling and its associated (non marginal) power consumption. On the other hand, the gained knowledge that a frame crossing the stack brings about afixed
penalty unrelated to the frame size may be exploited to devise techniques toavoidor reducesuch energy toll.
In the following, with no pretense of completeness, we presentquantitativeexamples that show how our new insights may affect existing energy efficient mechanisms as well as inspire novel approaches. As in Section IV, we first conduct experiments with the Soekris/Linux baseline platform, and then extend them to all other devices under study. Some additional examples are presented in [1].
A. Reconsidering existing schemes
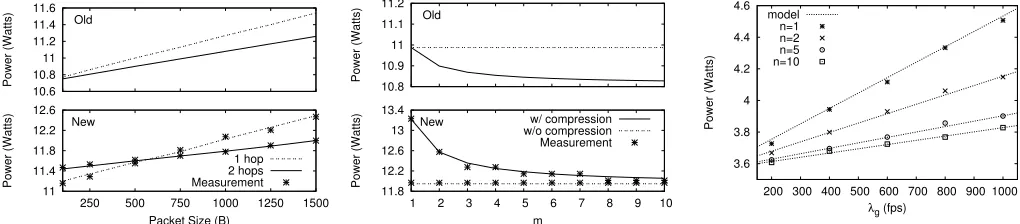
Packet relaying: Packet relaying in WLANs is commonly used to improve performance [35] and energy efficiency [7]. The rationale is that the use of a relay permits shorter transmis-sion times, which compensate the impact of the extra number of hops, thus introducing a net gain. However, classical energy-efficiency analyses do not balance the airtime energy saving with the energy drain introduced by the additional frame processing, a penalty which may fundamentally affect the relevant conclusions.
To quantitatively support this claim, we deployed a two-hop scenario comprising three nodes (sender, relay and receiver), and compared the power consumption in two different con-figurations (taken from [35]): (i) traffic directly sent to the receiver (1-hop, at 6 Mbps), and (ii) relay node used (2-hops, both at 48 Mbps). Traffic is generated at a rate ofλg= 400fps
withtxpower= 15 dBm and different frame sizesL. Packet
forwarding in the relay is performed at the routing layer. In both configurations, the relay node is always active (note that in most of the analyses on energy efficiency of relaying, the relay does not use the “sleep mode” [7], [36]).
11 11.4 11.8 12.2 12.6
250 500 750 1000 1250 1500
Power (Watts)
Packet Size (B) New
1 hop 2 hops Measurement 10.6
10.8 11 11.2 11.4 11.6
Power (Watts)
Old
(a) Power consumption with and without relay as a function of the frame size.
11.8 12.2 12.6 13 13.4
1 2 3 4 5 6 7 8 9 10
Power (Watts)
m
New w/ compression w/o compression Measurement 10.8
10.9 11 11.1 11.2
Power (Watts)
Old
(b) Power consumed as a function of the com-pression factor.
3.6 3.8 4 4.2 4.4 4.6
200 300 400 500 600 700 800 900 1000
Power (Watts)
λg (fps) model
n=1 n=2 n=5 n=10
(c) Energy consumption for different ‘aggrega-tion factor’ values.
Fig. 12: Performance of mechanisms to reduce energy consumption.
ditional model that neglects the impact of crossing the protocol stack (‘old’), and (iii) predictions using the model presented in this paper (‘new’).13 Not (anymore) surprisingly, results
for the two models are qualitatively different. According to the traditional model, packet relaying always provides a gain, since the energy consumption of the 2-hops case is always smaller than that of the 1-hop case. In contrast, according to the actual measurements and our model, we only gain from using the relay when packets are sufficiently long (i.e., when the airtime cost becomes dominant over the cross-factor penalty).
Data compression in multi-hop networks: In wireless multi-hop networks, data compression has been proposed to reduce the information relayed; with such techniques, an intermediary node receives several frames, compresses them into a single frame and sends it to the next hop [37], [38].
According to traditional energy models, these approaches
surely save energy, whereas our new energy consumption
insights suggest that this may not be always true. To analyze this, we used a three-node testbed consisting of a source, a sink and a relay, all using M CS = 48 Mbps and txpower = 15 dBm. The source node generates 500-byte packets at 1200 fps and sends them to the relay. The relay runs an appli-cation that receives these packets, and emulatescompression by forwarding 1 frame for every m frames received. Thus, our experiments do not capture the processing toll of the compression, and hence results reflect the best possible case for the performance of this scheme.
Fig. 12b shows total power consumption results (experi-mental ones, as well as predictions from old and new energy model), for different values of the compression ratiom, when data is compressed (and forwarded) at the application layer. These results are compared against the case where data is not compressed at the relay node but simply forwarded towards the sink at the routing layer.
As anticipated, the old model (top curve) predicts that compression is always advantageous. However, experimental results, matched by the new model predictions (bottom curve), show that data compression does not provide any gain in terms
13For the model, we account for a cross-factor of 0.8 mJ to forward a packet at the relay, which has been obtained by measuring the energy consumed by forwarding a packet at the routing layer.
of energy consumption, not even for compression rates as high as 10. The reason is that the energy savings resulting from the data compression are outweighted by the extra cost of handling the packets at the application layer (cross-factor of 0.93 mJ for sending and 0.93 mJ for receiving) instead of the routing layer (cross-factor of 0.8 mJ for forwarding). This example thus shows that mechanisms devised on the basis of traditional energy models may not only fail to provide the expected gains, but may evenworsenthe actual energy consumption.
B. Novel ways to tackle energy efficiency
Packet Batching: As emerged in our work, energy con-sumption across the protocol stack relates to the handling of frame units, and is practically independent of the frame size. This suggests a straightforward energy saving strategy:
batch packets into bundles at the highest suitable layer for a considered scenario, deliver the bundle across the stack, thus paying the energy price associated to asingle unit, and then restore the original frames as late as possible down the stack. Unlike previous aggregation schemes for wireless networks, this mechanism (i) does not change the packets that are actu-ally sent, but only modifies the way they are handled within
the device [39], and (ii) does not save energy by reducing the cumulative tail energy consumed as a result of lingering in high power states after completing a transmission [40], [41].14
Application
Aggr. TCP/IP
Bundle
De-Aggr.
Driver NIC
Fig. 13: Packet batching withn= 2.
We quantified the attainable energy savings by implement-ing the scheme depicted in Fig. 13, which consists of (i) an “aggregator” at the application layer, which waits fornpackets to generate a bundle and pass it to the TCP/IP stack, and (ii) a “de-aggregator” at the wireless driver, which splits the bundle back into the original frames. Experimental measurements are reported for 100-byte packets, bundled up to an “aggregation factor” n = 10, and for various (application layer) frame
generation ratesλg. Frames are transmitted over the wireless channel at M CS = 48 Mbps andtxpower= 15 dBm.
Results, shown in Fig. 12c, have a twofold implication. First, they provide further evidence that the cross-factor toll is practically independent of the frame size: the model matches well the measurements, and the use of an n-bundle reduces the energy toll above the driver byn. Second, energy savings are notable: with 1000 fps, an aggregation factor of 10 yields a saving of almost 0.8 W, and even the aggregation of just two packets may yield considerable savings (e.g., from 4.5 W to 4.15 W). Obviously, casting the above described scheme into target applications (or even more general frameworks) is not straightforward,15 and is out of the scope of this paper. Nevertheless, the above results suggest that such effort may be rewarded with notable energy saving.
Driver-level packet generation: As a significant part of the energy consumption comes from the crossing of the protocol stack, another approach to save energy could be to generate packets as low in the protocol stack as possible. For instance, some applications periodically generate dummy packets that carry no information from the application layer. Hence, such packets could be easily generated at some lower layer in the protocol stack, thereby saving the power corresponding to crossing the stack.
In order to evaluate the above idea, we emulated the behavior of Skype, which during silent periods periodically generates packets that carry no information. Thus, one option would be that when Skype turns into the silent mode, instead of generating such packets at the application layer, it just instructs the driver to generate them at the lowest level of the protocol stack. By implementing this mechanism and measuring the resulting energy consumption for the typical case in which silence periods account for 60% of the time [43], we observed that this technique saves as much as 44% of the per-packet energy consumed by Skype, which confirms the effectiveness of the proposed technique.
C. Other devices
In the previous subsections, we have shown that, for the Soekris device, many existing approaches may not deliver the expected gains, while substantial savings may be achieved with novel approaches that reduce the energy consumed by packet processing in the protocol stack. To gain insight into the generality of such results, we repeated the experiments of the above sections for all the devices under study.
To evaluate the performance of the existing and novel approaches of Sections VI-A and VI-B, we consider the following scenarios: (i) for all approaches, packets have a 100-byte payload, which is the case, e.g., of the Skype application using the preferred codec [44]; (ii) for the ‘data compression’ experiment, we use a compression factor ofm= 10; and (iii) for the ‘packet batching’, we set the aggregation factornequal to 6 packets.
15Further technical problems must be dealt with, including the interaction with the TCP/IP protocol stack (e.g., if the target application requires data to be delivered as independent TCP/IP packets) and the application’s requirements (e.g., the target application scenario must tolerate the extra batching delay introduced).
Table V shows (for all the devices) the energy gains delivered by the three approaches of Section VI-A, where the gain is the percentage of per-frame energy saved by the corresponding approach, i.e.,(Pstd−Papp)/Pstd, wherePapp is the per-frame power consumption with the approach and
Pstdis the consumption with the standard stack. In particular, the table provides: (i) the gains predicted by the classical energy model in terms of per-frame energy cost (“old”); and (ii) the gains measured from our experiments, which coincide with the new energy model proposed in this paper (“new”).
We observe from the results of Table V that, as with the Soekris device, the actual measurements show a very different behavior from that predicted with the classical model. With the packet relaying approach (‘relay’), for some of the devices the difference with the classical model is not so drastic as to yield a performance loss, but still the gain is negligible and/or very far from the classical model. Similar conclusions hold for the data compression approach (‘compress’).
Table VI further shows measurements of the performance gains obtained with the novel approaches of Section VI-B. We observe that these gains are substantial for all devices: for the packet batching approach (‘batching’), gains range from 68% (for the Samsung Galaxy Note 10.1) to 80% (for the Soekris), while for the driver-level packet generation approach (‘driver gen’), we also obtain very significant gains (around 45%).
From the above results, we conclude that while the new energy model derived in this paper has a more drastic impact on those devices with a largercross-factor, it has very strong implications for all the devices under study, since in all cases (i) the gains of existing approaches are very different from those predicted by the classical model, and (ii) new approaches lead to very substantial savings.
VII. CONCLUSIONS
TABLE V: Gains of existing approaches with the ‘new’ and ‘old’ models for all devices.
scheme Soekris Linux Soekris OpenBSD Linksys Soekris 802.11n HTC Legend Samsung Galaxy Note 10.1 Raspberry Pi
old new old new old new old new old new old new old new
relay 28.4% -34.3% 28.4% -36.2% 62.6% -17.5% 28.7% -35.78% 31.1% -22.2% 71.7% 13.8% 71.8% 13.2% compress 47.2% -20.2% 47.2% -21.7% 54.0% -14.8% 66.8% -1.1% 54.7% -5.4% 69.9% -8.4 % 74.1% 2.1%
TABLE VI: Gains of novel approaches for all devices.
scheme Soekris Linux Soekris OpenBSD Linksys Soekris 802.11n HTC Legend Samsung Galaxy Note 10.1 Raspberry Pi
batching 79.36% 80.38% 77.85% 79.64% 71.85% 67.9% 72.24%
driver gen 44.69% 44.95% 44.29% 45.01% 42.8% 42.4% 41.71%
ACKNOWLEDGEMENTS
We thank the reviewers for their valuable feedback, which has been very helpful in improving the paper.
REFERENCES
[1] A. Garcia-Saavedra, P. Serrano, A. Banchs, and G. Bianchi, “Energy consumption anatomy of 802.11 devices and its implication on modeling and design,” inProc. of ACM CoNEXT, Dec. 2012.
[2] J.-M. Tarascon, “Key challenges in future Li-battery research,” Phil.
Trans. of Royal Society A, vol. 368, no. 1923, pp. 3227–3241, July
2010.
[3] G. Y. Li et al., “Energy-efficient wireless communications: tutorial, survey, and open issues,”IEEE Wireless Comm., vol. 18, no. 6, pp. 28–35, Dec. 2011.
[4] S.-L. Tsao and C.-H. Huang, “A survey of energy efficient MAC protocols for IEEE 802.11 WLAN,”Computer Comm., vol. 34, no. 1, pp. 54–67, Jan. 2011.
[5] IEEE 802.11: Wireless LAN Medium Access Control (MAC) and
Phys-ical Layer (PHY) Specifications, IEEE Std. 802.11, 2007.
[6] E. Rozner, V. Navda, R. Ramjee, and S. Rayanchu, “NAPman: network-assisted power management for WiFi devices,” inProc. of ACM
Mo-biSys, June 2010.
[7] X. He and F. Li, “Throughput and energy efficiency comparison of one-hop, two-one-hop, virtual relay and cooperative retransmission schemes,” in
Proc. of European Wireless, Apr. 2010.
[8] A. P. Jardoshet al., “Green WLANs: On-demand WLAN infrastruc-tures,”Mobile Networks and Appl., vol. 14, no. 6, pp. 798–814, Dec. 2009.
[9] D. Qiao, S. Choi, and K. Shin, “Interference analysis and transmit power control in IEEE 802.11a/h wireless LANs,”IEEE/ACM Trans.
on Networking, vol. 15, no. 5, pp. 1007–1020, Oct. 2007.
[10] J.-C. Chen and K.-W. Cheng, “EDCA/CA: Enhancement of IEEE 802.11e EDCA by contention adaption for energy efficiency,” IEEE
Trans. on Wireless Comm., vol. 7, no. 8, pp. 2866–2870, Aug. 2008.
[11] R. Bruno, M. Conti, and E. Gregori, “Optimization of efficiency and energy consumption in p-persistent CSMA-based wireless LANs,”IEEE
Trans. on Mobile Computing, vol. 1, no. 1, pp. 10–31, Mar. 2002.
[12] V. Baiamonte and C.-F. Chiasserini, “Saving energy during channel contention in 802.11 WLANs,” Mobile Networks and Appl., vol. 11, no. 2, pp. 287–296, Apr. 2006.
[13] M. Ergen and P. Varaiya, “Decomposition of energy consumption in IEEE 802.11,” inProc. of IEEE ICC, June 2007, pp. 403–408. [14] A. Garcia-Saavedra, P. Serrano, A. Banchs, and M. Hollick,
“Energy-efficient fair channel access for IEEE 802.11 WLANs,” inProc. of IEEE
WoWMoM, June 2011.
[15] X. Wang, J. Yin, and D. P. Agrawal, “Analysis and optimization of the energy efficiency in the 802.11 DCF,”Mobile Networks and Appl., vol. 11, no. 2, pp. 279–286, Apr. 2006.
[16] E.-S. Jung and N. H. Vaidya, “An Energy Efficient MAC Protocol for Wireless LANs,” inProc. of IEEE INFOCOM, June 2002.
[17] M. Carvalho, C. Margi, K. Obraczka, and J. Garcia-Luna-Aceves, “Modeling energy consumption in single-hop IEEE 802.11 ad hoc networks,” inProc. of ICCCN, Oct. 2004.
[18] D. Qiao, S. Choi, A. Jain, and K. G. Shin, “MiSer: an optimal low-energy transmission strategy for IEEE 802.11a/h,” inProc. of ACM Mobicom, Sept. 2003.
[19] S. Chiaravalloti, F. Idzikowski, and L. Budzisz, “Power consumption of WLAN network elements,” Tech. Univ. Berlin, Tech. Rep. TKN-11-002, Aug. 2011.
[20] L. Feeney and M. Nilsson, “Investigating the energy consumption of a wireless network interface in an ad hoc networking environment,” in
Proc. of IEEE INFOCOM, Apr. 2001.
[21] “Power consumption and energy efficiency comparisons of WLAN products,” White paper, Atheros Comm., Apr. 2004.
[22] “Data transfer over wireless LAN power consumption analysis,” White paper, Intel Corp., Feb. 2009.
[23] E. Lochin et al., “Energy consumption models for ad-hoc mobile terminals,” inProc. of Med-Hoc Net, June 2003.
[24] A. Carroll and G. Heiser, “An analysis of power consumption in a smartphone,” inProc. of USENIX ATC, June 2010.
[25] A. Rice and S. Hay, “Measuring mobile phone energy consumption for 802.11 wireless networking,”Pervasive and Mobile Computing, vol. 6, no. 6, pp. 593–606, Dec. 2010.
[26] A. Pathak, Y. C. Hu, and M. Zhang, “Bootstrapping energy debugging on smartphones: a first look at energy bugs in mobile devices,” inProc.
of ACM HotNets, Nov. 2011.
[27] J.-P. Ebert, B. Burns, and A. Wolisz, “A trace-based approach for determining the energy consumption of a WLAN network interface,”
inProc. of European Wireless, Feb. 2002.
[28] D. Halperin, B. Greenstein, A. Sheth, and D. Wetherall, “Demystifying 802.11n power consumption,” inProc. of HotPower, Oct. 2010. [29] E. Rantala, A. Karppanen, S. Granlund, and P. Sarolahti, “Modeling
energy efficiency in wireless Internet communication,” inProc. of ACM
MobiHeld, Aug. 2009.
[30] H. Wu, S. Nabar, and R. Poovendran, “An energy framework for the network simulator 3 (NS-3),” inProc. of SIMUTools, Mar. 2011. [31] A. W. Min, R. Wang, J. Tsai, M. A. Ergin, and T.-Y. C. Tai, “Improving
energy efficiency for mobile platforms by exploiting low-power sleep states,” inProc. of Computing Frontiers, May 2012.
[32] S. Keranidiset al., “Energy consumption monitoring of NITOS testbed NICs through the NITOS EMF framework,” inProc. of ACM WiNTECH, Sept. 2013.
[33] J. S. Milton and J. C. Arnold,Introduction to probability and statistics,
4th ed. McGraw-Hill Higher Education, 2003.
[34] J. L. Leeet al., “An experimental study on the capture effect in 802.11a networks,” inProc. of ACM WiNTECH, Sept. 2007.
[35] P. Bahlet al., “Opportunistic use of client repeaters to improve perfor-mance of WLANs,”IEEE/ACM Trans. on Networking, vol. 17, no. 4, pp. 1160–1171, Aug. 2009.
[36] C. Sun and C. Yang, “Is two-way relay more energy efficient?” inProc.
of IEEE GLOBECOM, Dec. 2011.
[37] A. B. Sharma, L. Golubchik, R. Govindan, and M. J. Neely, “Dynamic data compression in multi-hop wireless networks,” in Proc. of ACM
SIGMETRICS, June 2009.
[38] S. J. Baek, G. de Veciana, and X. Su, “Minimizing energy consumption in large-scale sensor networks through distributed data compression and hierarchical aggregation,”IEEE J. Selected Areas Comm., vol. 22, no. 6, pp. 1130–1140, Aug. 2004.
[39] A. Jain and M. Gruteser, “Benefits of packet aggregation in ad-hoc wireless network,” Univ. of Colorado at Boulder, Tech. Rep., Aug. 2003. [40] F. Qian et al., “Characterizing radio resource allocation for 3G net-works,” inProc. of ACM Internet Measurement Conference, Nov. 2010. [41] N. Balasubramanian, A. Balasubramanian, and A. Venkataramani, “En-ergy consumption in mobile phones: A measurement study and implica-tions for network applicaimplica-tions,” inProc. of ACM Internet Measurement
Conference, Nov. 2009.
[42] A. Menon and A. Zwaenepoel, “Optimizing TCP receive performance,”
inProc. of USENIX ATC, June 2008.
[43] ITU-T Recommendation P.59. Artificial Conversational Speech.