The Role of Visual Eccentricity on Preference
for Abstract Symmetry
Giulia Rampone1*, Noreen O’Sullivan2, Marco Bertamini1
1University of Liverpool, Department of Psychological Sciences, Eleanor Rathbone Building, University of Liverpool, Liverpool, L69 7ZA, United Kingdom,2Liverpool John Moores University, Institute of Natural Sciences & Psychology, School of Natural Sciences & Psychology, Byrom Street, Liverpool, L3 3AF, United Kingdom
Abstract
This study tested preference for abstract patterns, comparing random patterns to a two-fold bilateral symmetry. Stimuli were presented at random locations in the periphery. Preference for bilateral symmetry has been extensively studied in central vision, but evaluation at differ-ent locations had not been systematically investigated. Patterns were presdiffer-ented for 200 ms within a large circular region. On each trial participant changed fixation and were instructed to select any location. Eccentricity values were calculated a posteriori as the distance between ocular coordinates at pattern onset and coordinates for the centre of the pattern. Experiment 1 consisted of two Tasks. In Task 1, participants detected pattern regularity as fast as possible. In Task 2 they evaluated their liking for the pattern on a Likert-scale. Results from Task 1 revealed that with our parameters eccentricity did not affect symmetry detection. However, in Task 2, eccentricity predicted more negative evaluation of symmetry, but not random patterns. In Experiment 2 participants were either presented with symmetry or random patterns. Regularity was task-irrelevant in this task. Participants discriminated the proportion of black/white dots within the pattern and then evaluated their liking for the pattern. Even when only one type of regularity was presented and regularity was task-irrele-vant, preference evaluation for symmetry decreased with increasing eccentricity, whereas eccentricity did not affect the evaluation of random patterns. We conclude that symmetry appreciation is higher for foveal presentation in a way not fully accounted for by sensitivity.
Introduction
Bilateral symmetry is a ubiquitous structural property of objects, which is salient both for
humans and for other animal species [1–5]. It has been suggested that the visual system is
par-ticularly tuned to bilateral symmetry and uses this property as a perceptual cue in
figure-ground discrimination (e.g. [6–8]). Bilateral symmetry in clouds of dots is accurately
distin-guished from random dot patterns of similar size and density at brief exposure times [9–11],
even when embedded in noise [11–13]. As bilateral symmetry iseffortlesslyextracted [14], it
has been suggested that it acts as a visual primitive and it has been incorporated as a Gestalt
property [15,16].
a11111
OPEN ACCESS
Citation:Rampone G, O’Sullivan N, Bertamini M (2016) The Role of Visual Eccentricity on Preference for Abstract Symmetry. PLoS ONE 11(4): e0154428. doi:10.1371/journal.pone.0154428
Editor:Joseph Najbauer, University of Pécs Medical School, HUNGARY
Received:November 15, 2015
Accepted:April 13, 2016
Published:April 28, 2016
Copyright:© 2016 Rampone et al. This is an open access article distributed under the terms of the Creative Commons Attribution License, which permits unrestricted use, distribution, and reproduction in any medium, provided the original author and source are credited.
Data Availability Statement:All data files are available from the Figshare database (URL:figshare. com/s/369ee8f48ae011e597b206ec4b8d1f61).
Funding:The Economic and Social Research Council (ESRC, Ref. ES/K000187/1) (www.esrc.ac. uk) supported this work. MB received the funding. The funders had no role in study design, data collection and analysis, decision to publish, or preparation of the manuscript.
The association between symmetry (and in particular bilateral symmetry) with beauty is longstanding. Many animal species, including humans, use symmetry as a biological signal of
mate quality [5,17–21]. Ramachandran and Hirstein [22] proposed symmetry as a basic
princi-ple of aesthetics and artistic experience. Symmetry is a good predictor of preference when
peo-ple evaluate the aesthetic appeal of abstract patterns [23,24]. Moreover, there is evidence of
automatic association between symmetry and positive valence [25–28].
This strong, and possibly innate [29], aesthetic appreciation of symmetry may derive from
the ease of its processing (perceptual fluency hypothesis, [30]).
Bilateral symmetry is the optimal stimulus to activate a regularity-specific extrastriate visual
network, although it is unlikely that a symmetry-specific area exists [31]. Moreover, there is no
evidence that symmetry is extracted by low level-visual mechanisms (like V1 and V2 [32–35]).
When the regularity around the axis of symmetry is less accessible, the saliency of symmetry drastically reduces. For example, symmetry detection is possible in extra-foveal vision but with
reduced sensitivity [9,11,36,37]. Symmetry detection declines rapidly as a function of
increas-ing retinal eccentricity (although appropriate size scalincreas-ing removes the eccentricity dependence) [12,38–40].
If increasing eccentricity gradually impairs detection of symmetry, it would seem plausible that aesthetic appreciation of symmetry decreases with a similar trend. Because foveal percep-tion is important for fluently extracting the informapercep-tion around the bilateral axis of symmetry and constructing the representation of shape, people would need to look at bilateral symmetry foveally to appreciate it. However, to the best of our knowledge there has been no systematic study of the change in aesthetic appreciation of bilateral symmetry across retinal eccentricities.
It is generally accepted that beauty can be easily detected in extrafoveal vision (e.g.
Kuragu-chi and Ashida [41] and Guo and coll. [42] conducted studies on detection of beautiful faces in
the periphery), and beauty in the periphery captures attention even when it is task irrelevant
[43]. It is possible therefore that symmetry is detected and preferred to non-symmetry in the
periphery (as long as it can be discriminated). The aim of this study is to compare the affective value that people attribute to the same type of regularity presented at different levels of eccen-tricity. Moreover, we wanted to test the link between the decrement in preference with increas-ing eccentricity and the difficulty in processincreas-ing symmetry (measured by manual reaction times and proportion of incorrect responses).
We used abstract patterns made of black dots. These could have either bilateral symmetry (with both vertical and horizontal axes of reflection) or random configuration. On each trial, one pattern (4.6° of visual angle) appeared for 200 ms at a random location within a large circu-lar region (25.6°). In order to reduce the artificiality of the experiment, participants autono-mously chose a fixation point (not marked) within the circle prior to pattern onset. The participant changed fixation at the beginning of each trial. Hence, the distance from the centre of the pattern and the fovea was not controlled by the experimenter and could not be predicted by the participant. The value of retinal eccentricity was calculated a posteriori and varied across trials and across participants. However, for all participants, the final eccentricity values ranged approximately between 0 and 18 degrees of visual angle. Experiment 1 was divided in two
tasks. In Task 1 participants classified the regularity of the patterns (as“random”or
“symme-try”) immediately after pattern offset. In the second task (Task 2) participant did not classify
pattern’s regularity but rated the pattern on a 9-point liking scale after pattern offset. Note that patterns presented in Task 1 were different from those presented in Task 2. In this way we
eliminated any bias due to familiarity (mere exposure effect[44])
participants to familiarize to the type of patterns and reduce the effort required to discriminate regularity in Task 2. We were aware that in this experiment patterns at larger eccentricities might be misclassified (e.g. symmetry could be confounded with random, or vice versa) and misevaluated accordingly. The practice in Task 1 helped to maximise correct discrimination of regularity at the farthest eccentricities.
We can distinguish three possible outcomes.
(1) Eccentricity may fail to predict evaluation. Participants might rate symmetry more posi-tively (ratings from 5 to 9) than random (ratings form 5 to 1) at any eccentricity. This cate-gory-based evaluation would suggest that regularity is the sole predictor of preference
modulation, whereas the reduced saliency caused by eccentricity does not influence preference. (2) Eccentricity may cause a decrease in rating only for symmetry, but not for random pat-terns. This would suggest that the aesthetic appreciation of symmetry benefits from foveal processing.
(3) Finally, another possible outcome would be that eccentricity generally predicts more negative evaluations for all stimuli. This would imply a general preference for central presentations.
Experiment 2 was conducted to test the effect of eccentricity on the evaluation of symmetry (and random) presented in isolation and not confronted with its counterpart. The experimen-tal design was similar to Experiment 1. One group of participants observed only symmetric patterns and the other group observed random patterns. Patterns were made of black and white dots and participants reported whether the pattern contained more black or more white dots. Immediately after a response, participants evaluated their liking for the pattern on a 9-points rating scale. If retinal eccentricity is a predictor of liking for regular patterns but not for random patterns, a linear relationship between ratings and eccentricity will be observed only in the group that saw symmetric patterns. Another advantage of this task was to measure evaluation of symmetry across eccentricity when symmetry was task-irrelevant.
To summarise, this study aimed to answer the following questions: (Q1). Is eccentricity a general predictor of lower preference or is it specifically detrimental for the aesthetic apprecia-tion of regular patterns (bilateral symmetry)? (Q2). Does eccentricity affect evaluaapprecia-tion by impairing the discrimination of symmetry at peripheral locations?
Experiment 1
To investigate the effect of eccentricity on the appreciation of symmetry, participants were pre-sented with abstract patterns made of black dots, with either two-fold bilateral symmetry or a random configuration. On each trial one pattern was presented for 200 ms inside a large grey circle in the centre of the screen. The coordinates for the position of the pattern were randomly generated on each trial. Participants were asked to change fixation on each trial arbitrarily. Eccentricity values were calculated a posteriori, and a different array of eccentricity values was obtained from each participant. This method was employed to reduce the artificiality of the experimental design. Task 1 tested manual response speed and accuracy in symmetry detection as a function of retinal eccentricity. The same participants performed Task 2. In this task par-ticipants did not perform a classification task. They evaluated their liking for each pattern on a 9-points Likert rating scale. This second part tested whether increasing eccentricity predicted a reduction in preference for patterns.
Method
Participants. Twenty participants from the cohort of psychology students at the
Univer-sity of Liverpool participated in both experiments (age 18–31 years, mean age 19 years, 1 male,
2 left handed). All were naïve in respect to the experimental hypotheses and had normal or cor-rected to normal vision. They provided written consent for taking part and received course credits. The experiment was approved by the Ethics Committee of the University of Liverpool and was conducted in accordance with the Declaration of Helsinki (2008).
Apparatus and stimuli. Participants sat at 57 cm from a 16-inch LCD monitor with reso-lution 1280 X 1024 pixels at 75 Hz. To prevent loss of data due to head movements, a chin rest
was employed to keep the head still. Participants’eye movements were measured using an ASL
Eye-Trac D6 (Applied Science Laboratories, Bedford, MA) at a sampling rate of 120 Hz.
Stimuli were generated using PsychoPy software [45] and consisted of abstract black-dots
patterns with either symmetrical or random configuration. Each pattern was composed of 60 dots arranged within a region delimited by two virtual circular perimeters (as indicated by the
red lines within the pattern inFig 1B and 1C). The radius of the internal small circle was 0.2° of
visual angle; the radius of the external circle was ~1.5°. Therefore the global size of the patterns was approximately ~3°. Each dot had radius 0.1°. Symmetric patterns were constructed by ran-domizing the arrangement of the dots in one of four quadrants. Each quadrant contained 15 dots. In this way we obtained bilateral symmetry both on the vertical and horizontal axis. We choose to use a two-fold bilateral symmetry to maximize the saliency of the symmetrical pat-terns. This was intended to reduce the possibility of misclassification between symmetry and
random at greater eccentricities, which could bias evaluation (Fig 1B). For random patterns the
arrangement of the dots inside each quadrant was unconstrained (Fig 1C).
Stimuli were presented within a grey circle (RGB 0,0,0) with radius 12.8°. Coordinates of stimulus position were randomly generated on each trial. The pattern could appear at any posi-tion within the circle. Because pattern posiposi-tion changed on each trial, it could not be predicted. Participants used a gamepad to report their response accordingly to task instructions.
The experiment was divided in two tasks. In Task 1 participants pressed the two top-bottom
shoulder buttons of the gamepad (7–8) to report pattern regularity (symmetry or random). In
Task 2 a Likert vertical scale was presented after stimulus appearance at the centre of the
screen. It consisted of a column of numbers from 9 to 1, headed by the messages“Like it very
much”at the top, and“did not like at all”at the bottom. Participants could move up and down
on the scale using the arrows on the gamepad. The position on the scale was indicated by a change in opacity of the circle surrounding the specific number. Participants confirmed their final response by pressing button 1 on the gamepad.
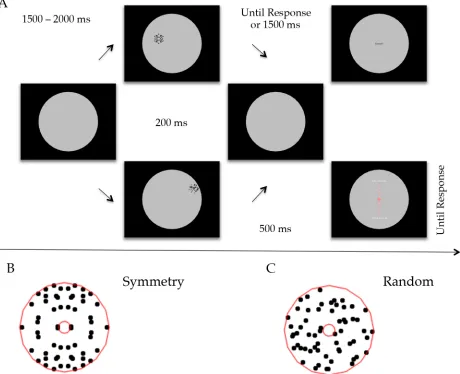
Procedure. Fig 1Aillustrates the experimental procedure. A large grey circle over a black background delimited the area of interest. Each trial started with a variable interval of 1500 to 2000 ms. During this interval participants were required to choose arbitrarily any point within the grey circle and keep fixation on that point. An abstract pattern appeared at an unpredicted position within the grey circle. Participants were instructed to try to control reflexive saccadic responses to pattern onset. In Task 1, participants classified the pattern as symmetry or ran-dom as fast and accurately as possible. One group of participants pressed a left button for sym-metry and right button for random. The other group did the opposite. Response screen was
displayed until response. A feedback word (“correct”or”incorrect”) was displayed for 500 ms
Each task consisted of 144 trials, divided in four blocks of 36 trials. Between each block par-ticipants were allowed to rest and disengage the eyes from the screen. The two tasks followed one after the other with a break (~5/10 min) between them and always with the same order. The order of the two tasks was not counter-balanced. Task 1 always preceded Task 2. This was intentional in order to facilitate sensitization to symmetrical stimuli for the preference task. A practice session of 20 trials preceded Task 1, whereas a practice session of 10 trials preceded Task 2. These reproduced the procedure of the incoming Task, in order to ensure participants understood the instructions. A questionnaire was provided at the end of both experiments ask-ing participants their personal opinion about the purpose of the study. This was used to ensure participants did not understand the real experimental aims.
Fig 1. (A) Experimental procedure of Experiment 1. Each trial started with an interval between 1500 ms and 2000 ms. During this interval the participant could look at any location within the central large circle, and chose a point where maintaining the gaze. After the interval an abstract pattern appeared at a random location. The pattern could be either symmetry or random, and remained on the screen for 200 ms. Participants were encouraged to control the reflexive response to look at the pattern and maintain fixation on the point they chose. Task 1: Immediately after pattern offset, participants reported whether the pattern was symmetry or random. If no response was given within 1500 ms from pattern offset, the trial was considered null and a new trial started. Task 2: After 500 ms from pattern offset, a 9-points rating scale was presented. Participants moved the cursor up and down on the rating scale to assign a preference value to the pattern (9 = like very much; 1 = do not like a t all). They were encouraged to give a response relatively fast and using a gut feeling. (B) Example of a symmetry pattern. (C) Example of a random pattern. Red lines indicate the virtual circles used to construct the patterns. These were not visible to the participants and are shown here for illustrative proposes.
Analysis. Spatial coordinates of stimulus position were calculated as the distance between the ocular coordinates at target onset and the coordinates of the center of the circular region in which patterns were embedded. Eccentricity values ranged approximately between 0 and 19 degrees of visual angle (Task 1 M = 8.84; SD = 3.8; range = 17.99; Task 2 M = 8.88; SD = 3.9;
range = 19.121). We discarded trials in which eyes’signal was not recorded (Task 1 5.6%, Task
2 10%, of total trials), or incorrect eye movements were performed during pattern presentation (Task 1 4.4%, Task 2 6%, of total trials). In Task 1, 10% of total trials were excluded from the analysis, In Task 2 we excluded 16% of total trials. However, the average proportion of excluded trials in the symmetry and random conditions did not differ in both experiments.
Multi-level linear modelling is a statistical approach for hierarchical data sets in which data is sampled at different levels of a hierarchy. In our study experimental trials (the lowest level of the hierarchy) were nested within participants (the highest level of the hierarchy). In contrast to a standard regression model in which the dependent variable is a measure of central ten-dency that is detached from the variance around that score, a multi-level model includes esti-mates of the variance at each level of a hierarchical data-set, adjusting the estiesti-mates of other parameters in the model accordingly. Random effects in the model relate to the extent that var-iance in the dependent variable (DV) can be attributed to varvar-iance at a particular level in the hierarchy (e.g. a random effect of participant; a random effect of trial). Fixed effects in the model relate to the extent that variance in the DV can be attributed to a manipulated variable. Through partitioning the variance in this way within the context of one model, the parameters that are estimated for the fixed effects are statistically unbiased by, for example, variability across participants.
Fixed factors in our analysis were eccentricity, pattern regularity, and two parameters that we called Mean Individual Eccentricity (MIE) and Mean Individual Inverse Efficiency Score (MIIES). MIE corresponds to the mean distance from eyes at which patterns were presented, calculated for each participant. As eccentricity values were not pre-set and balanced, each par-ticipant might have been exposed to patterns at different eccentricity. Taking this variable into account as fixed variable of our model, allowed us to control for individual differences in eccen-tricity exposure.
MIIES corresponds to the mean“inverse efficiency score”[46,47] for each participant.
MIIES integrates the average proportion of correct responses (PC) and latency of correct responses (reaction times, RTs) in a unique variable, in order to weight the impact of speed and accuracy. For each participant mean RT was divided by mean PC, the value obtained cor-responds to MIIES and it is expressed in ms (like RT). This variable was included in the model employed for the analysis of preference evaluation. Including MIIES allowed controlling for the effect of individual efficiency in performing Task1 on preference evaluation.
Two multilevel linear models were employed to analyse reaction times (Task 1) and prefer-ence ratings (Task 2). Accuracy (Task 1) is a binary dependent variable; therefore a binary logistic model was performed. Correct responses were coded as 1, and incorrect responses as 0. The model for RTs included only trials in which a correct response was made. Each DV was analysed as a function of increasing eccentricity and pattern regularity. All models revealed that random factors (participants and trials numbers) generated significant variability in the
data (all ps<0.05). However, we were not interested in testing the role of random factors on
the final outcome. Therefore these will not be discussed any further. The sampling distribution
of the t-statistic is the Student’s t-distribution. Therefore, degrees of freedom were calculated as
n-k, wherenis sample size andkis the number of parameters in the model. The analysis was
Results
Task 1. Table 1shows results from the model used for analysis of RTs. Overall both
eccen-tricity and pattern regularity were unrelated to variability in reaction times (seeTable 1andFig 2).
Correct responses were the 85.5%.Table 2shows results from the Binary Logistic Model for
the analysis of correct responses as function of eccentricity. Increasing eccentricity did not
affect the odds of correct responses (OR = .96,Χsq(1,N= 20) = 3.7,p= 0.06). Instead, the
odds of correct responses significantly decreased when symmetry was presented (OR = .78,Χsq
(1,N= 20) = 5.0,p= 0.03), suggesting a possible bias in classifying the patterns as random.
However, the interaction Eccentricity X Pattern Regularity was not significant (OR = .98,Χsq
(1,N= 20) = 0.5,p= 0.5).
Task 2. We ran one model using liking ratings as the dependent variable. This model
included one more fixed factor: MIIES (seeAnalysissession). Results are shown inTable 3.
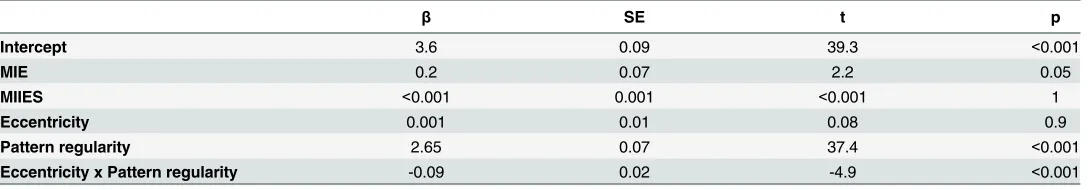
The model suggests that Pattern Regularity was a good predictor for preference evaluation
(t(14)= 37.4, p<0.001). Increasing eccentricity was not a predictor of preference formation
overall (t(14)= 0.08, p .94). However, there was an interaction EccentricityPattern Regularity
(t(14)= -4.94, p<0.001).Table 4shows results from two separate models for Random and
Table 1. Results from analysis of reaction times.
β SE t p
Intercept 0.7 0.03 23.9 <0.001
MIE 0.03 0.03 0.9 0.4
Eccentricity 0.002 0.002 1.0 0.3
Pattern regularity (symmetry) 0.02 0.01 1.7 0.1
Eccentricity x Pattern regularity -0.002 0.003 -0.7 0.5
Results from Multilevel Linear Model for analysis of reaction times as a function of visual eccentricity in Experiment 1 (Task 1).
doi:10.1371/journal.pone.0154428.t001
Fig 2. (A) Scatterplot showing the relationship between manual reaction times (RTs) and retinal eccentricity across all trials and participants, with regression line (red) corresponding to the average relationship (R2 = 0.0008). (B) Each line corresponds to the relationship between RTs and eccentricitywithineach participant.
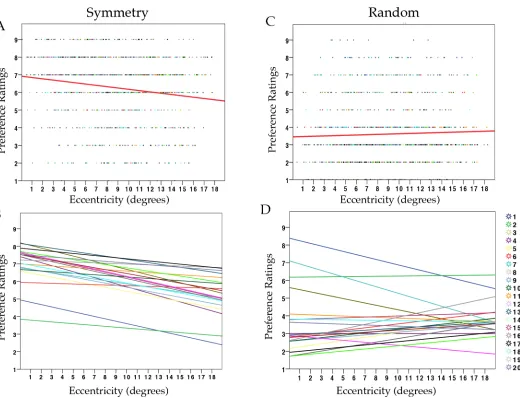
Symmetry conditions. Preference for symmetry decreased with increasing eccentricity (t(17)=
-7.7, p<0.001), whilst the same was not true for random stimuli (t(17)= 0.8, p = 0.4). See
Scat-terplots inFig 3A and 3B(symmetry) andFig 3C and 3D(random).
MIE significantly affected preference. This suggests that participants that were more often exposed to patterns at larger eccentricities tended to use higher ratings overall.
Discussion
Results from Task 1 revealed that eccentricity did not affect either accuracy or reaction times. We did not observe any effect of visual eccentricity on detection speed and accuracy for
sym-metry against random patterns. This is not in agreement with previous findings [36,38,49], but
it is possible that the type of design was not ideal for recording manual response speed. We will discuss this aspect in the General Discussion. Results from Task 2 showed that Eccentricity did not predict lower ratings in general. A significant Eccentricity X Pattern Regularity interaction showed, instead, that eccentricity differently modulated the evaluation of the two types of regu-larity. Ratings for symmetry decreased to more negative values with increasing eccentricity, whereas ratings for random patterns remained unvaried. This supports the hypothesis that proximity to the fovea is important for the aesthetic appreciation of bilateral symmetry.
However, an important caveat in this result is that evaluation may have been subject to a regression to the mean. Because symmetric and random patterns were interleaved, it is possible that patterns at farther distances were more often misclassified and rated accordingly (i.e. sym-metry was confounded and rated as random and vice versa). There was no significant evidence of a regression to the mean in the ratings for random patterns (i.e. evaluation for random
pat-terns did not gradually become more positive with eccentricity). However, as shown inFig 2B
and 2D, individual regression lines for both categories suggests (descriptively) a weak tendency toward converging.
Table 2. Results from analysis of correct responses.
β SE Odd Ratio prob Χsq p
Intercept 1.9 0.15
MIE 0.3 0.2 1.35 0.95 3.2 0.085
Eccentricity -0.04 0.02 0.96 0.87 3.7 0.06
Pattern regularity (symmetry) -0.25 0.12 0.78 0.85 5.0 0.03
Eccentricity x Pattern regularity -0.02 0.03 0.98 0.87 0.5 0.5
Results from Binary Logistic Model for analysis of correct responses as a function of visual eccentricity in Experiment 1 (Task 1).
doi:10.1371/journal.pone.0154428.t002
Table 3. Results from analysis of preference ratings.
β SE t p
Intercept 3.6 0.09 39.3 <0.001
MIE 0.2 0.07 2.2 0.05
MIIES <0.001 0.001 <0.001 1
Eccentricity 0.001 0.01 0.08 0.9
Pattern regularity 2.65 0.07 37.4 <0.001
Eccentricity x Pattern regularity -0.09 0.02 -4.9 <0.001
Results from Multilevel Linear Model for analysis of preference ratings as a function of visual eccentricity in Experiment 1 (Task 2).
Table 4. Analysis of preference ratings separately for Random and Symmetry patterns.
Random Symmetry
β SE t p β SE t p
Intercept 3.7 0.3 13.5 <0.001 6.2 0.2 28.5 <0.001
MIE 0.08 0.2 0.4 0.7 0.2 0.1 1.3 0.2
Eccentricity 0.008 0.01 0.8 0.4 -0.09 0.01 -7.7 <0.001
Results from Multilevel Linear Model for analysis of preference ratings as a function of visual eccentricity separately for Random and Symmetry patterns (Experiment 1 (Task 2)).
doi:10.1371/journal.pone.0154428.t004
Fig 3. Results on preference evaluation in Experiment 1, Task 2.(A) Scatterdot plot showing preference ratings (1–9) for symmetry in relation to retinal eccentricity across all trials and participants, with regression line (red) (R2 = 0.03).(B)Each line corresponds to the relationship between preference and eccentricity within each participant for symmetry patterns(C)Scatterdot plot showing preference ratings (1–9) for random in relation to retinal eccentricity, across all trials and participants, with regression line (red) (R2 = 0.002).(D)Each line corresponds to the relationship between preference and eccentricity within each participant for random patterns.
We also observed that in Task 1 participants were significantly more prone to classify pat-terns as random in case of doubt. However, and relevant for the current study, pattern regular-ity did not interact with eccentricregular-ity. This means that increasing eccentricregular-ity did not cause the reduction in the odds of correct responses to symmetry, and this bias was generalized at any eccentricity level. In the method session we explain that two-fold reflection symmetry was used with intention of maximising the saliency of regularity. The fact that participants often per-ceived symmetric patterns as random was thus unexpected. Potentially, other factors may have influenced this bias (e.g. the absence of a fixation mark; a high degree of spatial
unpredictabil-ity, due to randomised patterns’location combined with arbitrary choice of fixation point).
However, no specific prediction was made about the role played by any of these factors on detection accuracy, and this hypothesis requires proper investigation.
The fact that symmetry was significantly liked more than random confirms that the differ-ent regularities were correctly discriminated in the evaluation task. At this stage, therefore, it was important to clarify whether misperception of symmetry at farther eccentricities caused the interaction between Eccentricity and Pattern Regularity on preference ratings. Experiment 2 was similar to Experiment 1. This time one group of participants saw only symmetric pat-terns, whereas the other group saw only random patterns. In this way any confound due to misclassification of Pattern Regularity was avoided.
Experiment 2
Experiment 1 suggested that increasing eccentricity leads to devaluation of symmetry, but not random patterns. However, it is possible that symmetry at farther retinal locations was more often confounded and evaluated as random. The second experiment was conducted to investi-gate this possibility. We introduced four important changes. First, one group of participants saw only symmetry (Experiment 2a), whereas the other group saw only random (Experiment 2b). Second, patterns were made of a random number of black and white dots. Participants reported whether the pattern contained more black dots or more white dots. Third, the evalua-tion task was included in the same experiment. Immediately after responding to the proporevalua-tion of dots with same luminance polarity, participants rated how much they liked the patterns that they had just seen. Four, the starting point of the rating scale was moved from 5 (central value on the rating scale) to 1 (lowest value of the rating scale). In this way we assumed that
evalua-tion was made following a criterion of‘gradual distance from the starting point’. Note that the
detection task served to disguise participants from the real aim of the experiment. No predic-tions were made regarding the evaluation of different proporpredic-tions of black/white dots.
Forty people took part in Experiment 2 (aged 18 to 22, 6 males, 4 left handed). They were all first year students from the School of Psychology of the University of Liverpool, and received course credits. They provided written consent. The experiment received ethics approval and was conducted in accordance with the Declaration of Helsinki (2008). Twenty participants took part in Experiment 2a, the other participants did Experiment 2b.
Experiment 2a
Method. The design was similar to Experiment 1, although both stimuli and procedure
presented some important differences (SeeFig 4). Patterns were made by black and white dots.
The proportion of black and white dots was randomly generated on each trial and was never
50–50%. In Experiment 2a all patterns weretwo-fold bilateral symmetry. In the Method session
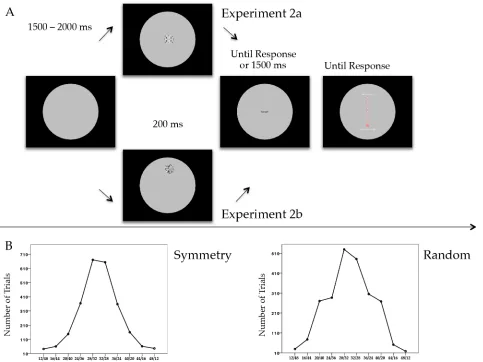
limited possible configurations, based on black/white proportions. Ten different types of black/ white configurations were generated (12/48, 16/44, 20/40, 24/36, 28/32, 32/28, 36/24, 40/20, 44/16, and 48/12). The frequency of appearance of the configurations was distributed with a
bell-shaped configuration, as shown inFig 4B.
Each trial started with a variable inter-trial interval (between 1.5 and 2 s) in which partici-pants chose arbitrarily a fixation point. Similarly to Experiment 1 the pattern could appear at any position within the grey circle. Patterns remained on the screen for 200 ms. Participants pressed one button if the pattern contained more black dots and the other button if the patterns
contained more white dots. Ten participants pressed the left button for‘more blacks’and the
right button for‘more whites’, whereas the others did the opposite. Participants were asked to
be as fast and accurate as possible. Immediately after their response, participants evaluated the
Fig 4. (A)Experimental procedure of Experiment 2a and Experiment 2b. Each trial started with an interval randomized between 1500 ms and 2000 ms. During this interval the participant could look at any location within the central large circle, and chose a point where maintaining the gaze. After the interval an abstract pattern appeared at a random location within the circle. Experiment 1a: The pattern was symmetry; Experiment 1b: The pattern was random. Patterns remained on the screen for 200 ms. Participants were encouraged to control the instinct of attempting to look at the pattern and maintain fixation on the point they chose. Immediately after offset, participants reported whether the pattern contained more black or more white dots. If no response was given within 1500 ms from pattern offset, the trial was considered null. Immediately after pattern offset, a 9-points rating scale was presented in the centre of the screen. Participants moved the cursor to select a value (1 = do not like at all; 9 = like very much).(B)Line graphs showing the number of trials in which different proportions of black/white dots were presented within the patterns. The program randomly generated black/white dots proportions. Ten possible configurations were generated and their frequency of appearance assumed a bell-shaped configuration. Left plot shows the black/white proportions frequency for symmetry patterns (Experiment 2a). Right plot shows the black/white proportions frequency for random patterns (Experiment 2b).
pattern aesthetically on a rating scale from 9 to 1. If no response was given after 1500 ms, the rating scale was presented and the trial considered null. In this Experiment, the starting point
of the rating scale was the lowest number“1”, instead of the central (neutral) point“5”that was
used in Experiment 1.
Note that if preference depends on eccentricity the lowest number would be used to rate the pattern at the farthest position and the highest number would be used for the foveal position. Therefore the scale works in a counter-directional manner compared to pattern position (rat-ing the closest pattern would require to move to the farthest position on the rat(rat-ing scale). One
might point out that starting form the highest number“9”would be more intuitive. However,
this would risk making the task too obvious. Moreover, moving the cursor from the most posi-tive value to more negaposi-tive value, would represent a devaluation process instead of an evalua-tion process.
Each participant did an introductory session, in which 10 examples of the patterns were shown. This was followed by a practice session of 36 trials. In the practice session, feedbacks reporting the real number of black/white dot and correct/incorrect response were shown in order to help participant to familiarize with the patterns. Because we expected participants would find the task difficult, we encouraged them to try to be as accurate as possible without worrying too much about the quality of their performance. Participants were not told about the preference evaluation task until the beginning of the experimental session.
Data analysis. Similarly to Experiment 1, each eccentricity value was obtained by calculat-ing the distance between the ocular coordinates at target onset and the coordinates of the cen-tre of the pattern. Eccentricity ranged from a minimum of 0 to a maximum of 18 degrees of visual angle (M = 8.12; SD = 4.26; range = 18.3). The percentage of lost trials because of blinks and bad signal was 5.7%. The trials in which eyes movement were made during pattern presen-tation were removed (8.4%). In total 85% of original trials were included in the analysis.
We ran two multilevel linear models, for reaction time and preference formation respec-tively, and a binary logistic analysis for accuracy. Note that the model for RTs included only tri-als in which a correct response was made (84% of the tritri-als), whereas the model for preference ratings included all trials. Random variables were participants and trial number. The fixed fac-tors were: MIE, and Eccentricity.
In the analysis of preference ratings the factor MIIES was added. Moreover we also included the Number of black dots within the pattern, and the interaction Number of black dots X Eccentricity, to test whether any possible contribution of this factor on the evaluation.
Results and Discussion. Unlike Experiment 1, participants were exposed only to symmet-ric patterns and responded to another dimension (proportion of black/white dots within the
pattern). Eccentricity did not predict the latency of correct responses (t(17)= 1.5, p = .15; see
Table 5).
Overall participants gave incorrect responses on 16% of trials. We ran a Binary Logistic model for the analysis of accuracy, which showed that eccentricity did not predict lower odd
Table 5. Results from analysis of reaction times.
β SE t p
Intercept 0.8 0.02 40.45 <0.001
MIE -0.002 0.02 -0.08 0.9
Eccentricity 0.003 0.002 1.5 0.15
Results from Multilevel Linear Model for analysis of reaction times as a function of visual eccentricity in Experiment 2a.
ratio of correct responses (OR = .999;Χsq(1,N= 20) = 0.01,p= 0.7; seeTable 6). The propor-tion of black/white dots did not affect the odds of responses overall.
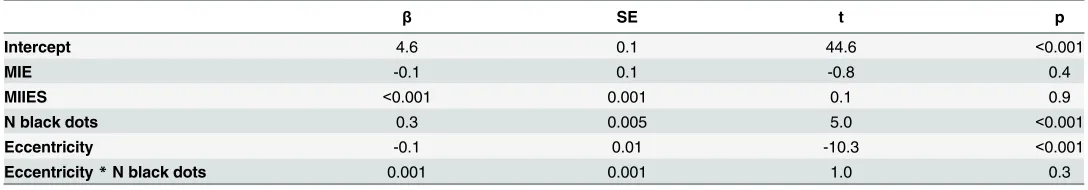
This experiment challenged a possible interpretation of the results observed in Experiment 1: lower ratings for symmetry could be due to increasing difficulty in discriminating between random and symmetry. The results obtained in this experiment showed that eccentricity was a
good predictor for preference evaluation (t(14)= - 10.33, p<0.001), even if only one type of
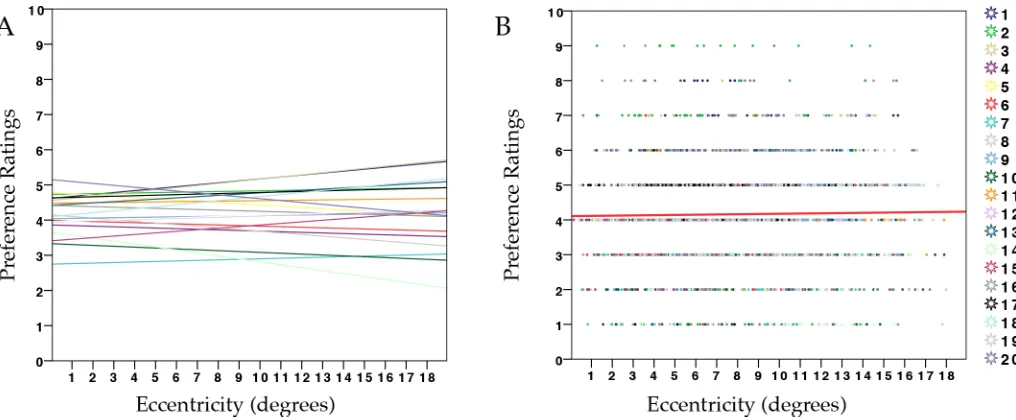
pat-tern was employed (seeTable 7).Fig 5Ashows preference-ratings as a function of eccentricity,
whereasFig 5Billustrates the individual regression lines. There is a trend from more positive
ratings to more negative ratings with increasing eccentricity. This result suggests that the dis-tance of the symmetrical pattern from fixation affected evaluation proportionally. This is in line with the hypothesis that liking of symmetry depends on the goodness of regularity pro-cessed around the axis of symmetry.
Because participants were instructed to attend to proportion of black/white dots, this factor might have influenced ratings. The number of black dots was a good predictor of preference
for the pattern (t(14)= 5.00, p<0.001). However, the interaction between Number of black dots
and Eccentricity was not significant (t(14)= 1.0, p = 0.3). A higher proportion of black dots
increased patterns’contrast against the grey background, favouring the perception of its
sym-metrical structure. This could explain the higher preference for patterns with more black dots. This experiment supports the hypothesis of a relationship between eccentricity and evalua-tion of symmetry. However, here participants did not explicitly attend to symmetry and we observed that the proportion of black dots within the pattern significantly affected evaluation. Experiment 2b was conducted to test the evaluation of random patterns instead of symmetry by using the same design.
Experiment 2b
Another group of twenty participants performed the same experiment with a variation: pat-terns were always random. Similarly to what observed in Experiment 2a, eccentricity might
Table 6. Results from analysis of correct responses.
β SE Odd Ratio prob Χsq p
Intercept 1.66 0.09
MIE 0.08 0.1 1.1 0.8 0.75 0.4
Eccentricity -0.001 0.01 1 0.8 0.01 0.7
Results from Binary Logistic Model for analysis of correct responses as a function of visual eccentricity in Experiment 2a.
doi:10.1371/journal.pone.0154428.t006
Table 7. Results from analysis of preference ratings.
β SE t p
Intercept 4.6 0.1 44.6 <0.001
MIE -0.1 0.1 -0.8 0.4
MIIES <0.001 0.001 0.1 0.9
N black dots 0.3 0.005 5.0 <0.001
Eccentricity -0.1 0.01 -10.3 <0.001
Eccentricity*N black dots 0.001 0.001 1.0 0.3
Results from Multilevel Linear Model for analysis of preference ratings as a function of visual eccentricity in Experiment 2a.
predict a decrease in preference for random patterns. This would suggest that eccentricity induces more negative evaluation of abstract patterns (at least when a discrimination task is required), probably as consequence of reduced confidence. On the other hand, eccentricity might not affect evaluation for this type of pattern. This result would be in line with the hypothesis that eccentricity does not always affect aesthetic appreciation of meaningless pat-terns. On the contrary it specifically affects the aesthetic appreciation of symmetry.
Method. Design and apparatus were the same of Experiment 2a. The only change was on the type of patterns. The arrangement of dots within each quadrant was unconstrained to obtain a random configuration. However the proportion of black/white dots was controlled in order to have same number of black/white dots in each quadrant. The distribution of black/
white dots was similar to Experiment 2a (seeFig 4B).
Data Analysis. Eccentricity ranged from a minimum of 0.1 to a maximum of 19.6 degrees of visual angle (M = 8.18; SD = 3.9; range = 19.51). The percentage of lost trials because of bad signal was 10.9%. The trials in which eyes movement were made during pattern presentation were removed (7.4%). In total, 83% of original trials were included in the analysis. Two multi-level linear models (reaction time and preference formation) and a binary logistic analysis (accuracy) were conducted, same as in Experiment 2a.
Results and Discussion. Multilevel linear modelling on latency of correct responses did
not reveal any effect of eccentricity (t(17)= 0.5, p = 0.6) (Table 8).
The overall percentage of incorrect responses was 24% of trials. A t-test analysis revealed
that this was significantly higher than in Experiment 2a (t(19)= -5.615, p<0.001).
We ran a Binary Logistic model for the analysis of accuracy, which showed that eccentricity
reduced the odds of correct responses significantly (OR = .95,Χsq(1,N= 20) = 18.0,p<
.0.001) (Table 9). This result is considerably different to what observed in Experiment 2a.
Par-ticipants made significantly more errors, and accuracy worsened with increasing eccentricity in Experiment 2b. Possibly, in Experiment 2a, specular pairings of dots with same luminance polarity facilitated the estimation of correct proportion of black/white dots, even when the
Fig 5. Results from Experiment 2a(A)Scatterplot showing preference ratings (1–9) for symmetry in relation to retinal eccentricity across all trials and participants, with regression line (red) (R2 = 0.05).(B)Each line corresponds to the relationship between preference and eccentricity within each participant for symmetry patterns.
pattern was far from fixation. On the contrary, the random distribution of the dots in the pat-terns of Experiment 2b made the detection of correct proportions more difficult.
In a recent work, Apthorp & Bell [50] asked participants to estimate the relative number of
items for symmetric and random patterns, and found that symmetry was perceived as less
numerous. Our result is partially in agreement with Apthorp & Bell [50] as it also shows that
symmetry influences the perception of pattern content. However, it is possible that when look-ing at proportion of equiluminant dots within a pattern, the presence of symmetry may favour a more accurate numerical estimation (as opposed to underestimation).
Although increasing eccentricity significantly affected performance, the linear model on
preference evaluation showed no influence of eccentricity on preference ratings (Fig 6A and
6B). In this experiment, the proportion of black/white dots did not influence evaluation.
Proba-bly eccentricity did not predict devaluation because patterns were completely random and meaningless at all eccentricities. Also different proportions of black and white dots did not affect the aesthetic appearance of the pattern at any eccentricity. Therefore eccentricity is a pre-dictor of aesthetic appreciation but only for symmetry (even if it is always present and
task-irrelevant).Table 10shows the results.
General Discussion
For abstract patterns, bilateral symmetry is a powerful predictor of aesthetic judgments. This is
supported by a large literature, using either explicit measures [23,24] or implicit measures
[26,27]. Symmetry is highly salient to the visual system, and therefore, a strong preference for
symmetric configurations has been attributed to the ease of its processing (e.g.The Perceptual
Fluency Hypothesis, [30]). However, saliency of bilateral symmetry is sensitive to several parameters. One example is retinal eccentricity. The detection of symmetry is possible at differ-ent locations in the visual field (at least when pattern regularity is the focus of the task). How-ever, the percept of symmetry drastically reduces even with small shifts from the center of the
retina [38]. Increasing eccentricity leads to a gradual decrease in performance (e.g.
discriminat-ing symmetry from non-symmetry) [38,40,51]. In this study we investigated the role of visual
eccentricity on the evaluation of symmetry. Preference for bilateral symmetry might depend on
Table 8. Results from analysis of reaction times.
β SE t p
Intercept 0.73 0.02 31.5 <0.001
MIE -0.01 0.03 -0.4 0.7
Eccentricity 0.001 0.002 0.5 0.6
Results from Multilevel Linear Model for analysis of reaction times as a function of visual eccentricity in Experiment 2b.
doi:10.1371/journal.pone.0154428.t008
Table 9. Results from analysis of correct responses.
β SE Odd Ratio prob Χsq p
Intercept 1.2 0.08 <0.001
MIE 0.05 0.09 1.05 0.78 0.2 0.55
Eccentricity -0.05 0.01 .95 0.76 18 <0.001
Results from Binary Logistic Model for analysis of correct responses as a function of visual eccentricity in Experiment 2b.
the perceptual information available when symmetry is processed at fovea. Because previous studies involving preference for symmetry were conducted in central vision, preference for symmetry at different location on the retina had not been systematically investigated. This study tested preference evaluation for highly regular patterns (mirror symmetry on both verti-cal and horizontal axis) and highly irregular pattern (randomly arranged dots) across retinal eccentricity.
The results obtained in this study helped to answer our initial questions. Q1). Is retinal eccentricity a general predictor of lower preference or is it specifically detrimental for the aes-thetic appreciation of regular patterns (bilateral symmetry)? In two experiments (Experiment 1 and Experiment 2a) we observed that the evaluation of symmetry decreased with increasing eccentricity. On the contrary, abstract random patterns were similarly evaluated at all eccen-tricities (Experiment 1 and Experiment 2b) (Q2). Does eccentricity affect preference evaluation through the impairment of symmetry discrimination at peripheral locations? We did not obtain evidence of an effect of eccentricity on symmetry discrimination (Experiment 1), which was measured by response time and accuracy. Moreover in Experiment 2a, symmetry was task irrelevant. Therefore, the effect of eccentricity on evaluation cannot be explained by mere diffi-culty in processing pattern regularity in the periphery.
Fig 6. Results from Experiment 2b(A)Scatterdot plot showing preference ratings (1–9) for random in relation to retinal eccentricity, across all trials and participants, with regression line (red) (R2 = 0.0003).(B)Each line corresponds to the relationship between preference and eccentricity within each participant for random patterns.
doi:10.1371/journal.pone.0154428.g006
Table 10. Results from analysis of preference ratings.
β SE t p
Intercept 4.2 0.1 29.1 <0.001
MIE 0.04 0.2 0.3 0.8
MIIES -0.001 0.001 -1.0 0.3
N black dots -0.01 0.004 -1.5 0.15
Eccentricity 0.005 0.01 0.7 0.5
Eccentricity*N black dots 0.001 0.001 1.0 0.3
Results from Multilevel Linear Model for analysis of preference ratings as a function of visual eccentricity in Experiment 2b.
As previously mentioned it has been found that shifts of 1°-2° from the fovea cause a drastic
drop in sensitivity to bilateral symmetry [12,36,39,40]. As the size of the patterns was
main-tained unvaried, we expected to observe a worsening in performance with increasing eccentric-ity. The experimental design probably played a critical role in cancelling any effect of
eccentricity on performance. This approach is substantially different from other studies on the saliency of symmetry in the periphery, and a number of factors might affect the way in which participants distributed attention within the circle. Stimulus locations were not decided a pri-ori; the fixation location changed at every trial; the participant chose the location to fixate arbi-trarily; there was no fixation stimulus (e.g. a cross or a point) on which to focus attention. By randomizing the point of fixation as well as pattern location within the circle, participants could not make any prediction about the location of the incoming pattern. Further investiga-tion may reveal that integrating any of these factors in the design can lead to a gradient of response speed as function of retinal eccentricity.
Although the design employed in this study cancelled any effect of eccentricity on perfor-mance, preference evaluation was sensitive to the retinal location of the (symmetrical) patterns. This is interesting. It suggests that visual eccentricity probably affects the perceptual processing of the pattern, even though this reduced saliency cannot be reported behaviourally.
The aesthetic appreciation of symmetry therefore is a function of the degree of regularity perceived around the axis. The gradual reduction of sensitivity caused by eccentricity was reflected in more negative evaluation of symmetry.
Experiment 2 showed that this happened even when symmetry was task-irrelevant. Although participants attended to the proportion of black/white dots within the pattern, sym-metry was gradually disliked across the further peripheral location. The goodness of processed symmetry was the critical factor affecting appreciation. On the contrary, irregular patterns (i.e. random) are perceptually meaningless at any distance from the point of highest visual acuity. For this reason, the task-relevant factor (i.e. proportion of dots with same luminance polarity) was the only predictor of preference modulation in Experiment 2b.
This study shows that the link between symmetry and beauty is sensitive to its location in the visual field. Although symmetry discrimination happens at any level in the periphery, sym-metry appreciation is restricted to proximity to the fovea. This may explain why beauty is detected in the periphery, however it requires foveal observation to be appreciated and elicit an emotional response.
Acknowledgments
The Economic and Social Research Council (ESRC, Ref. ES/K000187/1) supported this work.
Author Contributions
Conceived and designed the experiments: GR MB. Performed the experiments: GR. Analyzed the data: GR NOS. Contributed reagents/materials/analysis tools: GR MB NOS. Wrote the paper: GR MB NOS.
References
1. Tudor MS, Morris MR. Experience Plays a Role in Female Preference for Symmetry in the Swordtail Fish Xiphophorus malinche. Ethology. 2009; 115(9):812–22.
2. Swaddle JP, Pruett-Jones S. Starlings can categorize symmetry differences in dot displays. Am Nat. 2001; 158(3):300–7. doi:10.1086/321323PMID:18707326
4. Delius JD, Nowak B. Visual symmetry recognition by pigeons. Psychol Res. 1982; 44:199–212. PMID: 7156265
5. Swaddle JP, Cuthill IC. Preference for symmetric males by female zebra finches. Vol. 367, Nature. 1994. p. 165–6.
6. Machilsen B, Pauwels M, Wagemans J. The role of vertical mirror symmetry in visual shape detection. J Vis. 2009; 9(12):11.1–11.
7. Van Der Helm PA. The influence of perception on the distribution of multiple: Symmetries in nature and art. Symmetry (Basel). 2011; 3(1):54–71.
8. Treder MS. Behind the looking-glass: A review on human symmetry perception. Symmetry (Basel). 2010; 2(3):1510–43.
9. Herbert AM, Humphrey GK. Bilateral symmetry detection: Testing a“callosal”hypothesis. Perception. 1996; 25(4):463–80. PMID:8817622
10. Wenderoth P. The salience of vertical symmetry. Perception. 1994; 23(2):221–36. PMID:7971101 11. Barlow HB, Reeves BC. The versatility and absolute efficiency of detecting mirror symmetry in random
dot displays. Vision Res. 1979; 19(7):783–93. PMID:483597
12. Gurnsey R, Herbert AM, Kenemy J. Bilateral symmetry embedded in noise is detected accurately only at fixation. Vision Res. 1998; 38(23):3795–803. PMID:9893808
13. Jenkins B. Component processes in the perception of bilaterally symmetric dot textures. Percept Psy-chophys. 1983; 34(5):433–40. PMID:6657447
14. Julész B. Figure and ground perception in briefly presented isodipole textures. In: Kubovy M, Pomer-antz JR, editors. Perceptual organization. Hillsdale, NJ: Erlbaum; 1981. p. 27–54.
15. Palmer SE. Modern Theories of Gestalt Perception. Mind Lang. 1990; 5(4):289–323.
16. Pomerantz J, Kubovy M. Theoretical approaches to perceptual organization: Simplicity and likelihood principles. In: Boff KR, Kaufman L, Thomas JP, editors. Handbook of perception and human perfor-mance. New York: Wiley; 1986. p. 36.1–36.46.
17. Little AC, Jones BC, DeBruine LM. Facial attractiveness: evolutionary based research. Philos Trans R Soc Lond B Biol Sci. 2011; 366(1571):1638–59. doi:10.1098/rstb.2010.0404PMID:21536551 18. Wignall AE, Heiling AM, Cheng K, Herberstein ME. Flower symmetry preferences in honeybees and
their crab spider predators. Ethology. 2006; 112(5):510–8.
19. Thornhill R, Gangestad S. Facial attractiveness. Trends Cogn Sci. 1999; 3(12):452–60. PMID: 10562724
20. Møller A, Thornhill R. Bilateral symmetry and sexual selection: a meta-analysis. Am Nat. 1998; 151 (2):174–92. doi:10.1086/286110PMID:18811416
21. Johnstone R a. Female preference for symmetrical males as a by-product of selection for mate recogni-tion. Nature. 1994; 372(6502):172–5. PMID:7969449
22. Ramachandran V, Hirstein W. The science of ART. J Conscious Stud. 1999; 6(6–7):15–51. 23. Cárdenas RA, Harris LJ. Symmetrical decorations enhance the attractiveness of faces and abstract
designs. Evol Hum Behav. 2006; 27(1):1–18.
24. Jacobsen T, Höfel L. Descriptive and evaluative judgment processes: behavioral and electrophysiologi-cal indices of processing symmetry and aesthetics. Cogn Affect Behav Neurosci. 2003; 3(4):289–99. PMID:15040549
25. Pecchinenda A, Bertamini M, Makin ADJ, Ruta N. The Pleasantness of Visual Symmetry: Always, Never or Sometimes. PLoS One. 2014; 9(3):e92685. doi:10.1371/journal.pone.0092685PMID: 24658112
26. Bertamini M, Makin A, Rampone G. Implicit association of symmetry with positive valence, high arousal and simplicity. Iperception. 2013; 4(5):317–27.
27. Makin A, Pecchinenda A, Bertamini M. Implicit affective evaluation of visual symmetry. Emotion. 2012; 12(5):1021–30. doi:10.1037/a0026924PMID:22251051
28. Rampone G, Makin ADJ, Bertamini M. Electrophysiological analysis of the affective congruence between pattern regularity and word valence. Neuropsychologia. 2014; 58(1):107–17.
29. Rentschler I, Jüttner M, Unzicker A, Landis T. Innate and learned components of human visual prefer-ence. Curr Biol. 1999; 9(13):665–71. PMID:10395537
31. Bertamini M, Makin A. Brain Activity in Response to Visual Symmetry. Symmetry (Basel). 2014; 6 (4):975–96.
32. Makin ADJ, Wilton MM, Pecchinenda A, Bertamini M. Symmetry perception and affective responses/: A combined EEG / EMG study. Neuropsychologia. 2012; 50(14):3250–61. doi:10.1016/j.
neuropsychologia.2012.10.003PMID:23063934
33. Makin ADJ, Rampone G, Pecchinenda A, Bertamini M. Electrophysiological responses to visuospatial regularity. Psychophysiology. 2013; 50(10):1045–55. doi:10.1111/psyp.12082PMID:23941638 34. Tyler CW, Baseler H a., Kontsevich LL, Likova LT, Wade AR, Wandell B a. Predominantly
extra-retino-topic cortical response to pattern symmetry. Neuroimage. 2005; 24(2):306–14. PMID:15627573 35. Sasaki Y, Vanduffel W, Knutsen T, Tyler C, Tootell R. Symmetry activates extrastriate visual cortex in
human and nonhuman primates. Proc Natl Acad Sci USA. 2005; 102(8):3159–63. PMID:15710884 36. Saarinen J. Detection of Mirror Symmetry in Random Patterns At Different Eccentricities. Vision Res.
1988; 28(6):755–9. PMID:3227652
37. Masame K. Detection of symmetry in complex patterns: Is symmetrical projection to the visual system necessary for the perception of symmetry? Tohoku Psychol Folia. 1983;
38. Sally S, Gurnsey R. Symmetry detection across the visual field. Spat Vis. 2001; 14(2):217–34. PMID: 11450804
39. Barrett BT, Whitaker D, McGraw P V., Herbert a. M. Discriminating mirror symmetry in foveal and extra-foveal vision. Vision Res. 1999; 39(22):3737–44. PMID:10746144
40. Tyler C, Hardage L. Mirror symmetry detection: Predominance of second-order pattern processing throughout the visual field. In: Human Symmetry Perception and Its Computational Analysis. 1996. p. 157–71.
41. Kuraguchi K, Ashida H. Beauty and cuteness in peripheral vision. Front Psychol. 2015; 6(566):1–7. 42. Guo K, Liu CH, Roebuck H. I know you are beautiful even without looking at you: Discrimination of facial
beauty in peripheral vision. Perception. 2011; 40(2):191–5. PMID:21650092
43. Sui J, Liu CH. Can beauty be ignored? Effects of facial attractiveness on covert attention. Psychon Bull Rev. 2009; 16(2):276–81. doi:10.3758/PBR.16.2.276PMID:19293094
44. Zajonc RB. and Social Psychology Monograph Supplement. J Pers Soc Psychol. 1968; 9(2):1–27. 45. Peirce JW. PsychoPy—Psychophysics software in Python. J Neurosci Methods. 2007; 162(1–2):8–13.
PMID:17254636
46. Townsend JT, Ashby FG. Methods of Modeling Capacity in Simple Processing Systems. Cognitive the-ory (Volume 3). 1978. p. 199–239.
47. Snodgrass JG, Townsend JT, Ashby FG. Stochastic Modeling of Elementary Psychological Processes. Am J Psychol. 1985; 98(3):480.
48. Rasbash J, Charlton C, Browne W, Healy M, Cameron B. MLwiN Version 2.11. Centre for Multilevel Modelling, University of Bristol. 2009;
49. Julesz B. Foundations of cyclopean perception. Oxford: University of Chicago Press. 1971. 406 p. 50. Apthorp D, Bell J. Symmetry is less than meets the eye. Curr Biol [Internet]. Elsevier; 2015; 25(7):
R267–8. Available from: doi:http://dx.doi.org/10.1016/j.cub.2015.02.017PMID:25829006