Scale-dependent perspectives on the geomorphology and evolution of beach-dune systems. 1
2
draft manuscript submitted to Earth-Science Reviews 3
revised submission, March 2017 4
5
6
7
8
9
10
11
12
13
Ian J. Walker*, School of Geographical Sciences and Urban Planning, School of Earth and Space 14
Exploration, Arizona State University, Tempe, AZ, USA. 15
*corresponding author: [email protected], 250-721-7347 16
17
Robin G.D. Davidson-Arnott, Dept. of Geography, University of Guelph, Guelph, ON, Canada. 18
19
Bernard O. Bauer, Earth & Environmental Sciences, University of British Columbia – Okanagan, 20
Kelowna, BC, Canada. 21
22
Patrick A. Hesp, School of the Environment, Flinders University, Bedford Park, South Australia 23
5041. 24
25
Irene Delgado-Fernandez, Dept. of Geography, Edge Hill University, Ormskirk, Lancashire, UK. 26
27
Jeff Ollerhead, Dept. of Geography and Environment, Mount Allison University, Sackville, NB, 28
Canada. 29
30
Thomas A.G. Smyth, Department of Geography and Environmental Science, Liverpool Hope 31
1 TABLE OF CONTENTS
33
1. Introduction and purpose ... 4 34
2. Conceptual Foundations: Effectiveness and Scale of Geomorphic Events ... 6 35
3. Study Area: Greenwich Dunes, Prince Edward Island, Canada ... 12 36
4. Plot scale ... 17 37
4.1 Airflow dynamics over the beach-dune profile ... 18 38
4.1.1 Classic models of boundary layer flow over low hills ... 18 39
4.1.2 Advances in flow dynamics over complex dune terrain ... 20 40
4.1.3 New perspectives on turbulence and coherent flow structures ... 24 41
4.1.4 Advances in understanding topographic steering of near surface flow and sand 42
transport vectors ... 29 43
4.1.5 Innovative Computational Fluid Dynamics (CFD) modeling of flow over foredunes ... 39 44
4.2 Instantaneous sediment transport across the beach-dune profile ... 41 45
4.2.1. Classic ideas on equilibrium ‘saturated’ sand transport ... 41 46
4.2.2. Improved understanding of the fetch effect on beaches and sand delivery to foredunes 47
43 48
4.2.3. Advances in understanding of fetch and moisture interactions on beaches ... 46 49
4.2.4. Exploring wind unsteadiness, transport response, and intermittency ... 51 50
4.2.5. New observations of vertical sediment flux variations and transport events (flurries) 51
55 52
4.2.6. Observations of flux divergence and spatial-temporal patterns of erosion and 53
deposition 60 54
5. Landform scale ... 64 55
5.1 Modeling sediment delivery to coastal dunes ... 65 56
5.1.1 Classic approaches to modelling long-term aeolian sand drift ... 65 57
5.1.2 New efforts to assess the regime of aeolian transport events in beach-dune systems 58
66 59
5.1.3 Advances in modelling the effect of supply-limited conditions on predicted sand 60
transport to foredunes ... 72 61
5.2. Beach-dune interaction ... 76 62
5.2.1. Classic understanding of sand supply and coastal dune evolution ... 76 63
5.2.2. Assessing annual to decadal beach-dune interaction ... 78 64
5.2.3. Decadal scale observations of extreme overwash and foredune recovery ... 85 65
6. Landscape scale ... 90 66
6.1 The classic view of the response of coastlines to sea-level rise: the Bruun model ... 90 67
6.2 A new perspective on the response of beach-dune systems to sea-level rise: the RD-A model 68
91 69
7. Summary and Conclusions ... 96 70
7.1 The persistent challenges of scale in beach-dune geomorphology ... 96 71
8. Acknowledgements ... 104 72
9. References ... 106 73
2 Abstract:
76
Despite widespread recognition that landforms are complex Earth systems with process-77
response linkages that span temporal scales from seconds to millennia and spatial scales from 78
sand grains to landscapes, research that integrates knowledge across these scales is fairly 79
uncommon. As a result, understanding of geomorphic systems is often scale-constrained due 80
to a host of methodological, logistical, and theoretical factors that limit the scope of how Earth 81
scientists study landforms and broader landscapes. 82
This paper reviews recent advances in understanding of the geomorphology of beach-dune 83
systems derived from over a decade of collaborative research from Prince Edward Island (PEI), 84
Canada. A comprehensive summary of key findings is provided from short-term experiments 85
embedded within a decade-long monitoring program and a multi-decadal reconstruction of 86
coastal landscape change. Specific attention is paid to the challenges of scale integration and 87
the contextual limitations research at specific spatial and/or temporal scales imposes. 88
A conceptual framework is presented that integrates across key scales of investigation in 89
geomorphology and is grounded in classic ideas in Earth surface sciences on the effectiveness 90
of formative events at different scales. The paper uses this framework to organize the review 91
of this body of research in a 'scale aware' way and, thereby, identifies many new advances in 92
knowledge on the form and function of subaerial beach-dune systems. 93
Finally, the paper offers a synopsis of how greater understanding of the complexities at 94
different scales can be used to inform the development of predictive models, especially those 95
3 issues. Models at this (landform) scale require an understanding of controls that exist at both 97
‘landscape’ and ‘plot’ scales. Landscape scale controls such as sea level change, regional 98
climate, and the underlying geologic framework essentially provide bounding conditions for 99
independent variables such as winds, waves, water levels, and littoral sediment supply. 100
Similarly, an holistic understanding of the range of processes, feedbacks, and linkages at the 101
finer plot scale is required to inform and verify the assumptions that underly the physical 102
modelling of beach-dune interaction at the landform scale. 103
4 1. Introduction and purpose
105
Despite widespread recognition that landforms are complex systems with process-106
response linkages that span temporal scales from seconds to millennia and spatial scales from 107
sand grains to landscapes, research that integrates knowledge across these scales is fairly 108
uncommon (Bauer and Sherman, 1999). Our understanding of Earth surface systems is often 109
scale-constrained due to a host of methodological, logistical, and theoretical factors that limit, 110
either explicitly or implicitly, the span of what can be (or is being) studied (Sherman, 1995). As 111
such, it is not surprising that traditional geomorphic research was incapable of providing critical 112
insights into the conceptual bridges between fundamental process-response dynamics (studied 113
at micro or meso scales) and long-term processes and controls that govern landform evolution 114
over centuries and longer. This remains a key challenge for many Earth scientists and it is 115
particularly true for aeolian-coastal geomorphology research that focuses on the evolution and 116
maintenance of beach-dune systems that straddle the highly dynamic terrestrial-marine 117
interface (Short and Hesp, 1982). 118
This paper reviews recent advances in understanding of beach-dune systems derived from 119
over a decade of extensive and collaborative research that began in 2002 at the Greenwich 120
Dunes on Prince Edward Island (PEI), Canada. The paper provides a comprehensive summary of 121
findings from several short-term experiments embedded within a decade-long monitoring 122
program and a longer-term (multi-decadal) reconstruction of coastal landscape change. 123
Furthermore, the review situates the results from this specific research collaboration in a 124
5 associated with scale integration in geomorphology. In particular, emphasis is placed on the 126
constraints that neighboring (smaller and larger) scale perspectives impose on the 127
understanding of knowledge derived at the scale of the event-based, instrumented field (plot 128
scale) experiment. For example, measurements of net accretion along the toe of a coastal 129
foredune using traditional cross-shore topographic profiles at monthly or seasonal intervals 130
cannot reveal information about whether there was a gradual accumulation of sand through 131
time, or deposition from a single event. Similarly, such survey data do not provide any 132
information about potential intervening events that may have caused foredune erosion via 133
wave scarping, nor can these data be used to extrapolate to long-term scenarios of dune 134
maintenance and evolution without knowledge of the erosion-deposition tendencies over 135
seasons, years and decades. Thus, without appropriate context, such survey data are of limited 136
utility, revealing only what happened at a particular place and time. 137
Section 2 of the paper presents a conceptual framework based on classic ideas in Earth 138
surface sciences that guide thinking on scale awareness and the effectiveness of geomorphic 139
events in landform and landscape evolution. This framework provides the structure for an 140
extensive review of scale-dependent research on beach-dune systems that is 'scale aware' and 141
identifies critical gaps in knowledge. The review is grounded in the extensive research from the 142
PEI study site (described in Section 3) but also considers a wide range of contributions, both 143
classic and contemporary, from around the world. Sections 4 through 6 each provide a brief 144
synthesis of classic knowledge and the state of the science up to the early 2000s. This is 145
6 landform, landscape for Sections 4-6 respectively) over the last 15 or so years. Section 7 offers 147
an overarching summary of key advances at each scale, issues of integration between them, 148
and presents future research opportunities and challenges. 149
Given the significant range of spatial and temporal scales covered in this review, the 150
domain of long-term Quaternary studies is not incorporated. It is acknowledged, however, that 151
glacio-isostatic adjustments and altered rates of relative sea-level (RSL) rise, for example, exert 152
key controls on the evolution of global coastlines that, in turn, may have implications for littoral 153
cell sediment budgets and influence millennial-scale evolution of beach-dune systems. 154
155
2. Conceptual Foundations: Effectiveness and Scale of Geomorphic Events 156
Advances in Earth sciences are typically incremental, often building on the research of past 157
generations of scientists. Modern process geomorphologists, are often motivated by earlier 158
works on complex system behaviour (or ‘process-response’ dynamics) in geomorphic 159
environments. Wolman and Miller (1960), for example, argued that the largest magnitude 160
events in Earth surface systems are not necessarily those that perform the greatest amount of 161
work. 'Catastrophic' storms may have immense capacity to alter pre-existing landscapes over 162
short time spans, but events of moderate magnitude may account for greater cumulative work 163
in a system because of their more frequent recurrence within the historical sequence of events 164
that yield landscape evolution. In contrast, seemingly innocuous events individually may not 165
cause major landscape disruption, but can be significant in landscape dynamics because of the 166
7 degree to which an event may leave an indelible imprint on the landscape (referred to as
168
geomorphic 'effectiveness') is not a simple, linear function of event magnitude but, rather, 169
depends on: (i) the historical sequencing of events and their timing; (ii) the antecedent 170
conditions that predispose a landscape for rapid change; and (iii) the capacity for a landscape to 171
recover from the change imparted by the most recent event. Thus, a large catastrophic event 172
may alter the landscape significantly, but the system may rebuild to the pre-event state under 173
every-day processes that cause landscape change. In contrast, even small landscape 174
disturbances may persist for decades if there is little capacity in the system to recover to the 175
prior state. 176
The effectiveness of a geomorphic event, which must include its magnitude-threshold-177
frequency characterization, is also closely linked to the idea of equilibrium behavior (Thorn and 178
Welford, 1994) by virtue of implicitly embedding events into a historical sequence that yields 179
landscape change. The notion of ‘embeddedness’ was described masterfully by Schumm and 180
Lichty (1965) who asserted that the spatial-temporal scale at which a geomorphic system is 181
examined has implications for how system equilibrium may be manifested or perceived. 182
Although Schumm and Lichty (1965) referred to each of the scale domains as representative of 183
time, their framework implicitly embodies spatial dimensions. Based on these seminal 184
perspectives on geomorphic effectiveness and the conceptual foundation established by 185
Schumm and Lichty (1965) for general geomorphic systems, this paper provides a ‘scale aware’ 186
approach for reviewing recent advances on beach-dune dynamics using a dominantly spatial 187
8 experimental ‘plot’ scale, which operates on ‘steady’ time scales of seconds to days and length 189
scales of metres; (2) the ‘landform’ scale, which functions on ‘graded’ time (months to years) 190
and on length scales of hundreds of metres; and (3) the ‘landscape’ scale, which operates on 191
‘cyclic’ time (decades to centuries) across length scales of kilometres. Table 1 proposes a list of 192
variables applicable to a beach-dune system across the three scale ranges, which coincides with 193
our predisposition to investigate geomorphic processes and landform dynamics at scales 194
relevant to the human management of coastal resources. It is acknowledged that a different 195
definition of scale may be needed to create a similar classification for other coastal systems 196
(e.g., rocky, muddy, ice-dominated, etc.). Furthermore, challenges that exist at key scale 197
transitions (plot-landform, landform-landscape) are identified and recent efforts to bridge them 198
are discussed. 199
At the landscape (largest) scale, the dominant research interests of a coastal 200
geomorphologist might include characterizing and classifying the dynamic nature of the coast 201
according to whether the shoreline is prograding, aggrading, or retrograding, how wide and 202
steep the beach is, and whether the foredune is receding or advancing and growing or 203
shrinking. These factors are closely tied to the geometry and morphology of the beach-dune 204
system (Short and Hesp, 1982; Hesp, 1988; Sherman and Bauer, 1993; Bauer and Sherman, 205
1999; Houser and Ellis, 2013; Hesp and Walker, 2013), and they collectively define the 206
"dependent" variables (i.e., those that geomorphologists are interested to understand and 207
predict). The main “independent” variables (i.e., those that serve as controls or drivers of 208
9 the geological framework of the coast (i.e., tectonic/isostatic setting, structural controls, rock 210
type/history, fracture patterns, submarine bathymetry), eustatic sea-level trends, regional 211
climatology, and exposure to oceanographic forcing (e.g., wave climatology, coastal currents, 212
tidal fluctuations). Time is a relevant variable, simply because it takes time for major landforms 213
to respond and adjust toward equilibrium. 214
Many of the landscape scale variables listed toward the bottom of Table 1 are considered 215
“indeterminate” (i.e., those that have large variance but little impact on system dynamics at the 216
scale of interest) because there is often insufficient information to adequately parameterize 217
them and predict their state. For example, the degree to which a beach may have surface salt 218
crusts, snow cover, and flotsam during an individual transport event is of limited importance to 219
understanding whether there was (or will be) shoreline progradation or landward translation of 220
the beach-dune profile at the scale of decades to centuries. 221
At the plot (smallest) scale, the research focus is on prediction of sediment transport at 222
discrete locations over short time spans with the intent of understanding erosion and 223
deposition across the beach-dune system as it relates to foredune maintenance and evolution. 224
Thus, sediment transport rate and the pattern of flux divergence (leading to erosion or 225
deposition) are the primary dependent variables in the system, whereas the primary driver is 226
the near-surface wind vector (speed, direction) consistent with standard formulations of 227
aeolian sediment transport models (e.g., Bagnold, 1941; Kawamura, 1951). In addition, there 228
are a large number of supply-limiting surface controls, such as moisture content, snow cover, 229
10 bedforms, lag deposits), that dictate the spatial-temporal pattern of sand transport across a 231
beach-dune system (Sherman, 1990; Ellis and Sherman, 2013). Table 1 also catalogues 232
"parameters", which are defined as controlling variables that are largely time-invariant at the 233
scale of inquiry, although at larger scales they may be treated as time dependent variables. For 234
example, in most plot-scale studies of sediment transport across a beach, it is reasonable to 235
assume that foredune geometry is unchanged over periods of hours to days, that vegetation 236
cover is constant because of slow growth rates (unless buried by a large event), and the 237
tendency for the shoreline to erode or accrete is relatively unaltered if nearshore forcing is 238
constant. Long-term factors such as mean wave conditions, climate patterns, relative sea-level 239
trend and the geological context are not relevant at the plot scale, whereas at the landscape 240
scale, these are dominant independent variables. As shown by Schumm and Lichty (1965), the 241
specific combination of independent and dependent variables defining the dynamics of 242
geomorphic systems will change depending on the scale of investigation. 243
Between the landscape and plot scales is the landform (intermediate) scale, which spans a 244
period of time long enough to include seasonal cycles of adjustment as well as multiple extreme 245
events. Table 1 shows that there is no overlap between the list of variables that are dependent 246
(i.e., predictable) or independent (i.e., imposed) at the landscape versus plot scales, suggesting 247
that knowledge gained at these end-member frames of reference is largely incommensurate. 248
Research at the landform scale provides rich opportunities to connect these disparate 249
11 longitudinal experimental designs that span a decade or more, which is often logistically
251
challenging to maintain. 252
In many respects, the landform scale is the most challenging and demanding to conduct 253
research in as it retains the requirements of a short-term (plot-scale) assessment with the need 254
to scale up to a medium-term (landform-scale) understanding of processes that span a much 255
wider range of variables. Moreover, the contextual controls imposed by the broader landscape 256
scale are also relevant for understanding landform scale adjustments. Foredune maintenance 257
and evolution is best understood with observations that span periods of many years to 258
decades, and this category of understanding offers greater utility for management strategies 259
intended to mitigate damage from human alteration of the coast and/or within a framework of 260
climate non-stationarity and global sea-level rise (e.g., Davidson-Arnott, 2005; McLean and 261
Shen, 2006; Hesp, 2013). Indeed, this was one of the key motivations for our research at 262
Greenwich Dunes and our research partnership with Parks Canada. 263
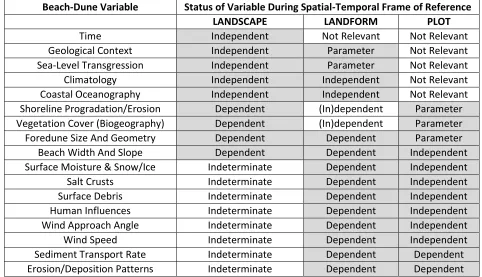
12 Table 1: A proposed classification of system variables for beach-dune interaction that integrates 265
across key spatial-temporal scales of reference from the plot scale (seconds to days, metres), to 266
landform scale (months to years, 100s of metres), and up to landscape scale (decades to 267
centuries, kilometres). This conceptualization is limited in scope to sandy coastal systems and 268
scales relevant for human management of coastal systems, rather than the long-term 269
geological evolution of the coastline. 270
271
Beach-Dune Variable Status of Variable During Spatial-Temporal Frame of Reference
LANDSCAPE LANDFORM PLOT
Time Independent Not Relevant Not Relevant
Geological Context Independent Parameter Not Relevant Sea-Level Transgression Independent Parameter Not Relevant
Climatology Independent Independent Not Relevant
Coastal Oceanography Independent Independent Not Relevant Shoreline Progradation/Erosion Dependent (In)dependent Parameter Vegetation Cover (Biogeography) Dependent (In)dependent Parameter Foredune Size And Geometry Dependent Dependent Parameter Beach Width And Slope Dependent Dependent Independent Surface Moisture & Snow/Ice Indeterminate Dependent Independent
Salt Crusts Indeterminate Dependent Independent
Surface Debris Indeterminate Dependent Independent Human Influences Indeterminate Dependent Independent Wind Approach Angle Indeterminate Dependent Independent
Wind Speed Indeterminate Dependent Independent
Sediment Transport Rate Indeterminate Dependent Dependent Erosion/Deposition Patterns Indeterminate Dependent Dependent 272
3. Study Area: Greenwich Dunes, Prince Edward Island, Canada 273
The Greenwich Peninsula is located on the northeastern shore of Prince Edward Island (PEI) 274
in the Gulf of St. Lawrence in eastern Canada. The Greenwich Dunes complex was incorporated 275
by Parks Canada Agency (PCA) into PEI National Park in 2000 to protect an area of established 276
foredunes backed by wetlands, ponds, stabilized transgressive dunes, and a large parabolic 277
dune complex (Figure 1). Much of the northeastern coast of PEI consists of horizontally-278
13 de Pol, 1983), that erodes readily. During the Holocene, the coast of PEI evolved under marine 280
transgression and bedrock erosion. Shoreline retreat averaged about 0.5 m a-1 over the past
281
6,000 years (Forbes et al., 2004), which is similar to recession rates over the past half century 282
along the NE coast (Webster, 2012). Sand supply associated with marine erosion and 283
transgression is stored primarily as a thin wedge on the beach and inner shoreface, in barrier 284
islands and mainland dune systems, and in flood and ebb tidal deltas associated with inlets of 285
the barrier systems (Forbes et al, 2004; Coldwater Consulting, 2011). Today, low bedrock cliffs 286
and headlands are typical with extensive sections of barrier islands and spits that enclose 287
lagoons and shallow estuaries. The tidal range is micro-tidal (~1.0 m) with a mixed, semi-288
diurnal regime. Recent estimates of relative sea-level (RSL) rise for Charlottetown, PEI, give 289
rates of land subsidence (due to glacial isostatic effects) of -1.45 mm a-1 and an estimated
290
eustatic rise in sea level of +1.07 mm a-1, producing an estimated RSL rise of about +0.25 m
291
century-1 (James et al., 2012). This value is roughly consistent with estimates of long-term RSL
292
rise for the past 6,000 years of +0.3 m century-1 (Forbes et al., 2004; Webster, 2012).
293
Prince Edward Island experiences a cool, temperate climate with a strong marine influence. 294
Daily average temperatures range from a low of -8°C in February to a high of 19°C in August 295
with maximum temperatures seldom exceeding 30°C. Average annual precipitation is about 296
1200 mm with less than 25% falling as snow, although winter snowfall amounts are highly 297
variable. Prevailing winds at the site are from the SW, although strong northerly winds are 298
common in March and April. Dominant winds from the NW, N and NE are driven by the passage 299
14 March) and exert significant control on precipitation and wind patterns in PEI (Manson et al., 301
2002; Forbes et al., 2004; Manson et al., 2015). Occasionally, hurricanes also track NE from the 302
Caribbean, particularly in September and October. While the direct impact of hurricanes and 303
post-tropical storms is generally moderate, storms tracking close to the area can interact with 304
other mid-latitude systems to produce intense wind and wave conditions and storm surges that 305
may persist for many hours. Extensive coastal erosion, flooding, and localized overwash of 306
mainland and barrier dune systems is associated with extreme storms, as appears to have been 307
the case for a major fall gale in 1923 (see section 5.2.3). 308
Foredunes at the site range in height from 8 to 12 m and have fairly uniform, straight 309
seaward stoss slopes and a complex, undulating dune crest with intermittent depositional lobes 310
and blowouts (Hesp and Walker, 2012). The foredune toe is occasionally scarped by waves 311
during major storms but aeolian processes rapidly rebuild the slope by scarp in-filling. Incipient 312
dunes up to 1 m high and 5-6 m wide also develop and can persist for 2-4 years between major 313
storms. The dominant vegetation on the foredune is American Beach Grass (Ammophila 314
breviligulata), whereas the annual Sea Rocket (Cakile edentula) is common on the backshore 315
and occasionally Saltwort (Salsola sp.) is present. Beach Pea (Lathyrus japonicas) and Seaside 316
Goldenrod (Solidago sempiverens) are common on lee slopes during the summer and fall 317
months and shrubs such as Bayberry (Myrica pensylvanica) are found in more sheltered areas. 318
319
15 Figure 1: Location of study area showing: a) location of PEI in the Gulf of St. Lawrence and 321
surrounding provinces; b) the Greenwich Dunes and St. Peter’s Estuary area; c) vertical aerial 322
photograph of Greenwich Dunes and the entrance to St. Peters Bay; d) oblique aerial 323
photograph of the beach and dune system at Greenwich Dunes including the locations of 324
characteristic study reaches (1-3) and cross-shore topographic profiles (see Ollerhead et al. 325
2013, and Figs. 21 and 25). 326
16 For the purposes of coastal erosion and dune dynamics monitoring for PCA, the study site 328
was divided into three reaches (Figure 1d, each described in section 5.2.2). Representative 329
profiles across the beach and foredune were established within each reach and surveyed 330
annually between 2002 and 2012 (Ollerhead et al., 2013). Net littoral sediment transport is 331
from E to W and there is evidence of about 100 m of westward progradation into the estuary 332
over the past 80 years with several small foredune ridges formed over this time (Mathew et al., 333
2010). The littoral sediment budget is negative in Reach 1 with measured recession of the 334
foredune of 0.5-1.0 m a-1 over the observation period. In contrast, the sediment budget in
335
Reach 2 transitions from negative to positive, with Line 7 having a neutral budget (Ollerhead et 336
al., 2013). 337
Plot scale field experiments were conducted in Reach 2 just west of Bowley Pond near Line 338
7 (Figs. 1d, 2a, b) to measure wind flow and sediment transport on the beach and foredune in 339
May-June 2002, October 2004, October 2007, and April-May 2010. Beach width at this location 340
was 30-40 m and sediments consisted of dominantly quartz sand with some feldspar with a 341
mean grain size of 0.26 mm. 342
17 Figure 2: Site photographs of the beach and foredune system at Greenwich Dunes, PEI. The 344
uppermost photos show the site for plot scale experiments in 2004 with a wide, vegetated 345
incipient dune a) before the arrival of Tropical Storm Nicole and during the storm in b) with a 346
visible eroded scarp at the foredune toe and active sand transport and deposition. Photo c) 347
shows shorefast ice, snow cover, and vegetation dieback typical of the winter season. Photo d) 348
illustrates distinct depositional lobes landward of the foredune crest that result from onshore 349
sand transport and deposition in the winter months. 350
351
4. Plot scale 352
For most of the 20th century, aeolian geomorphologists have worked within a paradigm of
353
steady, uniform flow for which (dry) sand flux is controlled mainly by the strength of the wind 354
under what is referred to as ‘transport-limited' conditions. These conditions were replicated 355
well within wind tunnel experiments that dealt primarily with horizontal, uniform beds of 356
unimodal sediments, which also facilitated the development of theoretical models based on the 357
a)
b)
18 fundamental physics of saltation. Plot scale field experiments were often sited to minimize 358
topographic and surface complexity so as to conform to the paradigm. The development of 359
ultrasonic 2D and 3D anemometers and fast-response sediment sensors has allowed aeolian 360
geomorphologists to make high frequency measurements of turbulent wind flow and sand 361
transport, which has enabled a shift away from the steady-state paradigm toward consideration 362
of more natural conditions (e.g., Stout and Zobeck, 1997; Bauer et al., 1998; Sterk et al., 1998; 363
Davidson-Arnott et al., 2005; Walker, 2005; Bauer et al., 2013). The plot scale experiments at 364
PEI were specifically designed to explore the characteristics and effects of unsteady, non-365
uniform flow together with spatial and temporal variations in topography and surface 366
characteristics. 367
This section provides a summary of research that was designed to characterize the complex 368
flow dynamics over the beach and foredune and related patterns of sand transport. A summary 369
and critique of traditional models of airflow dynamics and surface shear stress over low hills is 370
provided as a starting point. More comprehensive reviews of secondary flow dynamics over 371
dunes in general, and related semi-coherent flow structures over dunes, are provided by 372
Walker and Hesp (2013) and Bauer et al. (2013), respectively. 373
4.1 Airflow dynamics over the beach-dune profile 374
4.1.1 Classic models of boundary layer flow over low hills 375
Theory on boundary layer flows over flat surfaces were extended to low symmetrical hills 376
by climatologists (see Walker and Hesp, 2013), and seized upon by aeolian geomorphologists 377
19 1982; Lancaster et al., 1996; Jensen and Zeman, 1985; Lancaster, 1985; Walmsley and Howard, 379
1985; Mulligan, 1988; Weng et al., 1991; Frank and Kocurek, 1996a; Wiggs et al., 1996b; 380
McKenna Neuman et al., 1997, 2000; Walker and Nickling, 2002). The Jackson and Hunt (JH) 381
model (Jackson and Hunt, 1975; Hunt et al., 1988) delineated ‘inner’ and ‘outer’ flow regions 382
that resulted from topographically-forced streamline perturbations. Outer flow in the JH model 383
is modified only by the pressure field, whereas within the inner region turbulent momentum 384
transfers and surface shear effects are also considered and create two sub-layers: i) the thin, 385
inner surface layer (ISL) where fluid shear is in equilibrium with surface roughness (i.e., the 386
constant stress region) and ii) the overlying shear stress layer (SSL) where shear effects 387
decrease with height until negligible. The JH model established a new theoretical framework for 388
understanding boundary layer flow dynamics, successfully characterizing: i) flow stagnation and 389
deceleration immediately upwind of hills and ii) flow acceleration or ‘speed-up’ on the 390
windward (stoss) slope. 391
Rasmussen (1989) was among the first to apply a modified version of the JH model to a 392
foredune. Due to varying roughness and slope transitions, he found that the depth of the ISL, 393
from which surface shear stress is derived, was very thin and therefore traditional velocity-394
profiles measured using bulky instruments were of limited utility in estimating sand 395
transport. Similarly, Hesp (1983) and Arens et al. (1995) found that flow accelerations up the 396
windward slope deviated from those predicted by the JH model due to vegetation effects. They 397
also noted that, as winds became more oblique, the effective slope (i.e., aspect ratio) of the 398
20 al. (1995) noted a decline in sand flux up the stoss slope at a rate that was dependent on
400
incident wind speed. At slow speeds, the decline in sand flux was drastic, whereas at faster 401
speeds sand traveled farther inland because of turbulent suspension. This effect was 402
pronounced for steeper dunes and occurred despite changes in vegetation density. 403
These early studies revealed that the ability to simulate flow dynamics over foredunes 404
using climatological models was limited. Field experiments in the 1990s and 2000s also 405
showed that typical foredune terrain leads to flow separation and flow reversal, unlike flow 406
over a low hill (see Walker et al., 2006; Walker and Hesp, 2013). Empirical models of flow 407
behavior in the lee of transverse desert dunes also emerged (e.g., Sweet and Kocurek, 1990; 408
Frank and Kocurek, 1996; Wiggs et al., 1996; Walker and Nickling, 2002; 2003) and provided 409
new conceptual foundations upon which flow dynamics over more complex, vegetated dunes 410
could be understood. 411
4.1.2 Advances in flow dynamics over complex dune terrain 412
A vegetated foredune induces flow deceleration upwind of the dune toe, promoting 413
deposition of sand at the bottom of the dune slope (e.g., Arens, 1996a; Davidson-Arnott and 414
Law, 1996; Hesp, 1989; Sarre, 1989; Wal and McManus, 1993; Hesp, 2002). Beyond the 415
foredune toe and up the stoss slope, the protrusion of the foredune into the boundary layer 416
results in the compression of flow streamlines, increasing surface shear stress and wind speed 417
toward a maximum at the crest. Accordingly, non-log-linear velocity profiles are common (Fig. 418
3). This type of topographic forcing on flow speed and shear stress distributions over aeolian 419
21 pronounced with wind perpendicular to the crest line and decreases steadily as the wind
421
direction becomes more oblique (Hesp et al., 2005; 2015; Smyth and Hesp, 2015; Walker et al., 422
2006; 2009b). 423
In the PEI plot scale research, conventional velocity profiles were measured as part of some 424
experiments (e.g., Hesp et al. 2009), although several drawbacks to this approach are 425
recognized. Conventional anemometers (rotating cups, propeller-fuselage, sonic anemometry) 426
are bulky compared to the shallow depth of the ISL. Thus, it is difficult to estimate shear stress 427
in the thin constant flux region (where the Law of the Wall applies). Some researchers have 428
measured velocity profiles that extend above the ISL (into the overlying SSL) as a proxy for 429
estimating shear stress over desert dunes (e.g., Mulligan, 1988; Lancaster et al., 1996; Wiggs et 430
al., 1996b). However, this often produces segmented and/or non-linear profiles (e.g., Bauer et 431
al., 1990; 1996; Hesp et al., 2005; 2013; see Fig. 3). Additionally, a vegetation canopy over the 432
foredune stoss slope imposes other limitations for applying boundary layer theory to estimate 433
surface shear stress. Thus, careful sampling and assessment of flow conditions within the near 434
surface zone is required if reliable sediment transport predictions are to be achieved (Bauer et 435
al., 2004). This remains difficult with existing instrument designs (Walker, 2005). 436
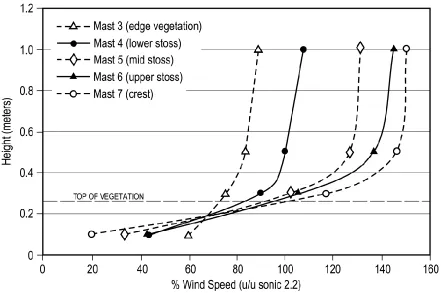
22 Figure 3: Percentage wind speed profiles up the PEI foredune stoss slope from an experiment in 438
2002 (see Hesp et al. 2005; 2013). Speed observations at positions 3–7 are normalized against 439
windspeed measured by a sonic anemometer at 2.2 m on a mast on the upper beach. Wind 440
speed is topographically accelerated upslope above the vegetation, while within the vegetation, 441
drag increases upslope and speeds decelerate. 442
443
444
The PEI experiments included measurements during flow conditions moderately above the 445
threshold for sand transport in 2002 and substantially above threshold in 2004. In both studies, 446
flow across the foredune was characterized by significant flow compression and 447
acceleration. However, during the 2002 experiment a significant reduction in wind speed 448
(deceleration) resulted over the foredune from enhanced drag exerted by the vegetation 449
canopy as observed in other studies (e.g., Arens et al., 1995). During the gale event in 2004, 450
there was a marked speed up above the vegetation, but also significant penetration of high-451
23 canopy (Hesp et al., 2005, 2009; 2013; Walker et al., 2009; see Fig. 3). The vertical (W) velocity 453
component of the flow field was positive (upwards) across the stoss slope under slow wind 454
conditions but shifted to negative (downwards) during gale conditions. In addition, a jet 455
developed approximately 1 m above the vegetation canopy and extended from the upper stoss 456
slope to the foredune crest during the gale event (Hesp et al., 2009; 2013). Formation of jet 457
flow is common over distinct topographic breaks (e.g., Bowen and Lindley, 1977; Hsu, 1977, 458
1987; Tsoar et al., 1985; Arens, 1996a), but had not been observed on foredune stoss slopes 459
(Hesp and Smyth, 2016a). These two phenomena, flow speed up within the plant canopy and 460
jet flow development, are important for moving sediment to the lee of the dune during strong 461
wind events (e.g., Arens, 1996a; Peterson et al., 2011; Hesp et al., 2009; 2013; Hesp and Smyth, 462
2016a). 463
Tall grassy vegetation exerts significant aerodynamic roughness that likely varies with wind 464
speed as the plants flex downward and become more streamlined under extreme winds (e.g., 465
Hesp et al., 2009). This dynamic behavior of the vegetation layer makes it difficult to 466
parameterize surface roughness as an aerodynamic roughness length (z0) or with a
467
displacement height (d). This quandary is also a major limitation with current numerical 468
modelling approaches (Smyth, 2016). As a result, time-averaged and spatially coarse velocity 469
profiles over foredunes are likely inaccurate for characterizing the highly spatially and 470
24 4.1.3 New perspectives on turbulence and coherent flow structures
472
Much work has been done recently to describe time-averaged conditions and turbulent 473
structures in flow over aeolian dunes (see Walker and Hesp, 2013) similar to earlier research in 474
rivers (e.g., McLean and Smith, 1986; Nelson and Smith, 1989; Bennett and Best, 1995; Venditti 475
and Bauer, 2005). Nevertheless, the relationship between turbulence intensity, Reynolds shear 476
stress (RS = -ρ u̅̅̅̅̅̅̅̅̅̅′w′ where u', w' are horizontal, vertical velocity fluctuations and ρ is fluid 477
density), and sand transport across aeolian dunes remained essentially unexplored until the 478
early 2000s following work on sand transport and turbulence over flat sand surfaces (e.g., 479
Bauer et al., 1998; Sterk et al., 1998; Leenders et al., 2005; Baas, 2006). 480
Research over desert dunes and in wind tunnels demonstrated that RS at the toe of a dune 481
often exceeds time-averaged, streamwise shear stress (τ = ρ u*2, where u* is shear velocity
482
derived from velocity profiles) (e.g., Wiggs et al., 1996; Walker and Nickling, 2002; 2003; 483
Parsons et al., 2004; Baddock et al., 2011; Weaver and Wiggs, 2011; Smyth and Hesp, 2015). 484
Wiggs et al. (1996) argued that semi-coherent flow structures in the upwind boundary layer 485
were conveyed toward the bed at the dune toe by concave streamline curvature in this 486
region. These structures, which cause fluctuations in local RS, were thought to aid the 487
maintenance of grain transport across the beach and through the flow deceleration region at 488
the dune toe. Toward the dune crest, surface shear stress increases as a result of streamline 489
compression and flow acceleration, assisted by streamline convexity that suppresses vertical 490
motions and enhances horizontal fluctuations. These patterns of turbulence modification have 491
25 2003; Walker and Hesp, 2013) and over the foredunes at the PEI study site (Chapman et al. 493
2012; 2013). 494
Research in fluvial systems has shown that ejection and sweep events and larger macro-495
structures (e.g., kolks, boils) are often associated with enhanced sediment entrainment and 496
transport via suspension (e.g., Jackson, 1976; Drake et al., 1988; Best, 1993; Robert et al., 1996; 497
Roy et al., 1996, 2004; Best and Kostachuk, 2002; Kostaschuk et al., 2008, 2009; Shugar et al., 498
2010). However, few studies have focused on bed load transport, which is more comparable to 499
the saltation-dominated mode of transport over aeolian dunes (cf., Drake et al., 1988; Valyrakis 500
et al., 2010). Some of the experiments at PEI were dedicated to exploring the relationships 501
between turbulent stresses (including semi-coherent structures) and sediment transport 502
(Chapman et al. 2012; 2013) over foredunes using ultrasonic anemometry to acquire high-503
frequency (1-32 Hz) measurements of 3D velocity vectors (U, V, W) at two sampling heights 504
across a transect extending from the upper beach to the lee of the dune crest. Sand transport 505
intensity was measured using Laser Particle Counters (LPCs) positioned at 0.014 m and 506
higher. Quadrant analysis was used to assess the distribution of quasi-instantaneous 507
components of the RS signals over the foredune as a means to interpret potential links between 508
fluid stress and resulting sand transport (Chapman et al., 2013). 509
Chapman et al. (2012) showed that the activity level in each of the four quadrants varied 510
with height and position across the beach-dune profile (Fig. 4). Q2 activity (u′<0, w′>0), which is 511
often associated with 'ejections', and Q4 activity (u′>0, w′<0), which is associated with 'sweeps', 512
26 which conform to 'outward' and 'inward' interactions, respectively. Such Q2-Q4 skew is a 514
characteristic signature of a turbulent boundary layer and was particularly evident across the 515
beach, dune toe, and lower stoss slope of the foredune. In contrast, as the dune crest is 516
approached, Q2 activity declines whereas Q1 becomes more dominant. The frequency of 517
ejection and sweep activity is reduced toward the crest. In the lee of the crest, where flow 518
separation occurs, the quadrant distributions were more symmetrical due to mixed, multi-519
directional flow. In terms of correlations between quadrant signatures and sand transport, 520
Chapman et al., (2013) found that Q4 activity was most frequently associated with transport on 521
the beach (52%), foredune toe (60%), and stoss locations (100%), whereas Q1 activity was 522
dominant at the crest (25 to 86%), followed by Q4 (13 to 59%). Q3 activity appeared to be 523
largely irrelevant in terms of correlation with observed sand transport at any location. 524
27 Figure 4: Quasi-instantaneous (32 Hz) quadrant plots derived from a 10-minute Run at 1700 h 526
on 11 October 2004 during a gale force event. Average incident flow angle and resultant speed 527
for each location are shown in the top right. Quadrant counts (in each corner) represent the 528
total number of observations (modified from Chapman et al. 2012: Fig. 10). 529
28 Understanding the dominance of certain quadrants over others at varying positions across 532
the beach-dune profile provides insight into why there is generally a poor correlation between 533
sand transport and time-averaged RS, contrary to what might be expected across an extensive 534
horizontal sand surface. Specifically, fluid fluctuations that yield activity signatures in Q2 and 535
Q4 provide positive contributions to RS, whereas those in Q1 and Q3 are negative 536
contributions. If either couplet dominates the distribution (as with diagonally-skewed ellipsoids 537
shown in Fig. 4), there will be either positive or negative momentum transfer toward, or away 538
from, the bed, respectively. However, when the activity signatures are balanced (i.e., a circular 539
pattern), the positive and negative quantities balance each other in the time-averaged RS. 540
Thus, it is possible to have intense activity in Q1 and Q4, as we find at the dune crest, which 541
implies significant turbulent fluctuations in the streamwise (positive) direction, but poor 542
correlation with vertical fluctuations. This situation yields a small value of RS, despite 543
significant potential in the flow field to sustain sediment transport. As a result, the relationship 544
between sand transport and turbulence across beach-dune profiles is complex and cannot be 545
described well using RS alone (Chapman et al. 2013). Figure 5 presents a conceptual model that 546
summarizes these relations. 547
Other research has examined the distribution of Reynolds normal stresses (i.e., u’2, w’2)
548
and turbulent kinetic energy (TKE) in flow over desert dunes (e.g., Baddock et al., 2011; Weaver 549
and Wiggs, 2011). Increasing evidence suggests that positive streamwise velocity fluctuations 550
are associated with the bulk of aeolian transport (e.g. Bauer et al., 1998; Sterk et al., 1998; 551
29 2011; Wiggs and Weaver, 2012). As such, the relationship between near-surface turbulence, 553
especially RS, and sand transport is not as straightforward as in traditional equations that relate 554
sand flux to surface stress directly and unambiguously. 555
4.1.4 Advances in understanding topographic steering of near surface flow and sand transport 556
vectors 557
Interaction of regional wind flow with surface topography results in deviations in the 558
magnitude and directionality of near-surface flow vectors - a phenomenon termed ‘topographic 559
steering’. The mechanics of topographic steering are driven largely by pressure differences that 560
the flow field encounters along streamlines that traverse the dune toe (deceleration, positive 561
pressure gradient) and stoss slope (acceleration, negative pressure gradient). More in-depth 562
explanations of this mechanism are provided by Walker and Hesp (2013) and Hesp et al. (2015) 563
and references therein. 564
Early work on topographic steering over beaches and foredunes (e.g., Svasek and Terwindt, 565
1974; Bradley, 1983; Mikklesen, 1989; Rasmussen, 1989; Arens et al., 1995; Hesp and Pringle, 566
2001) demonstrated that winds approaching a foredune at an oblique angle tend to be 567
deflected toward crest-normal and that this effect is greatest when incident angles are 568
between 30° and 60° to the crestline. Highly oblique winds less than 30° to the foredune crest 569
(where 90° is directly on shore) are generally deflected parallel to the crestline. Recent research 570
at the PEI site (Walker et al., 2006, 2009a, b; Bauer et al., 2012; Hesp et al., 2015) and 571
elsewhere (e.g., Lynch et al., 2008; 2009; 2013; Jackson et al., 2011; Delgado-Fernandez et al., 572
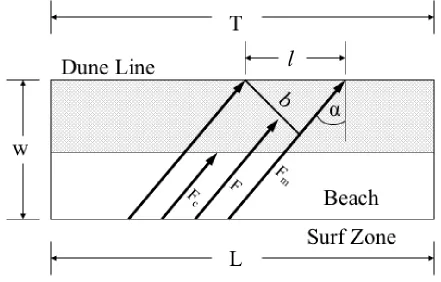
30 simple foredunes. Bauer et al. (2012) presented a conceptual model (Fig. 7) of flow-form
574
interaction over foredunes for a variety of flow approach angles from onshore (crest-575
perpendicular) through oblique, and offshore that also incorporates knowledge of resultant 576
sediment transport vectors (Bauer et al., 2015). 577
From these collective empirical results, it is now clear that topographic steering plays a 578
significant role in determining the near surface wind field and, consequently, the sediment 579
transport pathways across the beach-dune profile during onshore, oblique, and offshore 580
regional wind flows. To extend understanding beyond these empirical observations, a more 581
detailed computational fluid dynamics (CFD) simulation of flow over the PEI foredune (Hesp et 582
al., 2015) was conducted to simulate near-surface flow response in 10° increments from 583
onshore (0°) to alongshore (90°) wind approach angles. The results are summarized below into: 584
I) crest perpendicular winds – onshore and offshore; II) crest oblique winds – onshore and 585
offshore; and III) shore parallel winds. 586
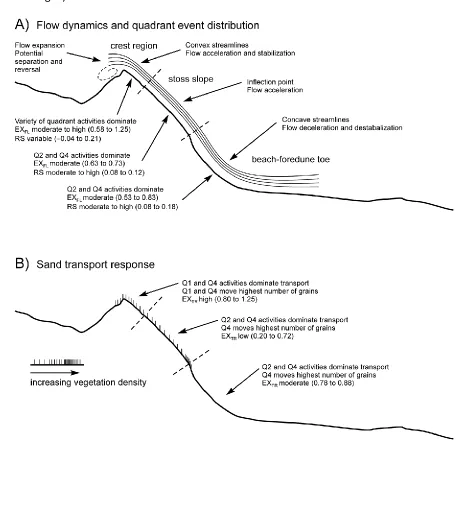
31 Figure 5: Conceptual model showing observed streamline behaviour, flow dynamics, Reynolds 588
stress (RS) quadrant event activity, and sand transport responses over a foredune. (Chapman et 589
al. 2013: Fig. 7). 590
591
592
593
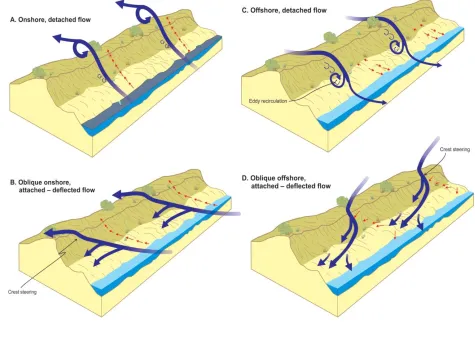
32 Figure 6: Conceptual model of flow–form interaction and topographic steering over a large 595
foredune for variable wind approach directions. Large solid arrows correspond to near-surface 596
wind flows and small arrows show likely sediment transport directions. (Bauer et al. 2012: Fig. 597
11). 598
599
600
I. Crest perpendicular winds 601
Crest perpendicular winds are accelerated up the stoss (upwind) slope of the dune and, if 602
the foredune ridge is sufficiently high and steep, flow detachment occurs at the crest. A 603
recirculation cell occupies the dune lee with a reattachment point located somewhere 604
downwind depending on dune height and topographical complexity. Flow reversals at the bed 605
are not uncommon (Fig. 6A and C) (e.g., Delgado-Fernandez et al., 2011; Jackson et al., 2011). 606
33 located above the foredune crest and on tall beach towers record the regional (offshore) wind 608
flow, while those close to the surface show drastically reduced flow speed and often reversed 609
and highly variable wind directions, which are typical of lee side eddy circulation in general 610
(Walker and Nickling, 2002; Jackson et al., 2011; Delgado-Fernandez et al., 2013; Bauer et al., 611
2012; 2015). The results of the PEI work on onshore and offshore flow conditions support 612
detailed findings of others in Northern Ireland (Lynch et al., 2009; 2010; 2013; Jackson et al., 613
2011; Delgado-Fernandez et al., 2013) who documented distinct flow recirculation in the lee of 614
a large foredune during offshore winds. During strong winds from either onshore or offshore 615
directions, flow acceleration towards the crest can result in sand transport high enough above 616
the bed to be incorporated within and above the lee-side flow separation eddy and deposited 617
on the lower part of the downwind slope and beyond (Arens 1995; Peterson et al., 2011; Hesp 618
et al., 2013). During offshore winds, some sand may be entrained near the crest and 619
transported onto the upper seaward slope of the foredune, while on the beach, onshore 620
transport may occur both seaward and landward from the point of flow reattachment, thus 621
leading to a pronounced transport discontinuity (Bauer et al., 2012; 2015; Davidson-Arnott et 622
al., 2012). 623
ii. Oblique winds 624
Winds approaching a foredune at an oblique angle are deflected toward crest-normal along 625
the stoss slope (Fig. 6B and D) (Walker et al., 2006; 2009b; Hesp et al., 2015). The degree of 626
deflection is dependent on incidence angle as well as height above the surface, with the most 627
34 are most prevalent (Arens et al., 1995; Mikkelsen, 1989; Walker et al. 2006; 2009b; Walker and 629
Shugar, 2013; Hesp et al., 2015). Significant onshore steering of near-surface flow vectors can 630
occur (as much as 37° from the incident wind as in Walker et al. 2009b), even during highly 631
oblique winds. 632
Figure 7 shows CFD-generated flow streamlines in near-surface boundary layer flow (from 633
0.66 to 2 m) over the PEI foredune and depicts the resulting degree of streamline deflection for 634
three incident wind approach directions (20°, 40° and 80°)(Hesp et al. 2015). The lowest 635
streamlines show the strongest response to topographic forcing and display the greatest degree 636
of deflection, similar to that observed empirically at the PEI site by Walker et al. (2006; 2009b). 637
Near-surface flow speed responses show that the greatest speed-up occurs for winds that are 638
most directly onshore when the dune has the steepest aspect ratio and then decreases as the 639
incident wind becomes increasingly oblique. For example, at 0.66 m above the bed the wind 640
speed at the foredune crest for incident wind directions from 50° to 30° to the crest is on 641
average 25% lower than for winds in the 30° to 0° range (Fig. 8). Beyond the crest, flow 642
separation occurs for onshore to moderately oblique winds and is manifest as a fairly simple 643
reversing roller vortex, as in Fig. 6A above and as captured in smoke visualization by Walker 644
(2005: Fig. 6). Flow separation and expansion results in notable flow deceleration leeward of 645
the crest, particularly closer to the surface (Fig. 8B). However, as the flow trends towards more 646
alongshore (from 50° to 70°), the degree of lee-side flow deceleration declines. This generally 647
reflects a change in the effective aspect ratio imposed by the dune, such that from onshore (0°) 648
35 topography. Beyond this range, as the incident wind approaches crest-parallel, there is
650
significantly less topographic forcing due to the decline in dune aspect ratio, and little to no 651
flow separation in the lee, as evident in the markedly different surface velocity distribution. 652
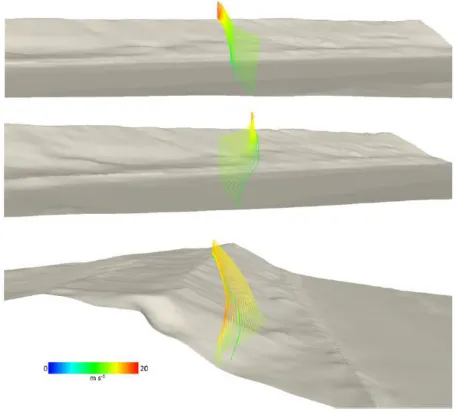
Figure 7: Examples of topographic steering of lower boundary layer flow (0.66 to 2 m) 653
streamlines generated by a field-validated CFD simulation (Hesp et al., 2015) for three incident 654
wind approach directions: 20° (oblique-onshore, uppermost), 40° (oblique, middle) and 80° 655
(oblique-alongshore, lowermost). The lowest streamlines show the strongest response to 656
variations in surface morphological changes and display the greatest degree of deflection. 657
(Hesp et al. 2015: Fig. 8, reproduced with permission). 658
659
36 Figure 8: Near-surface wind speed responses generated by the CFD simulation of Hesp et al. 662
(2015) showing speeds at 1 m intervals across the foredune at heights of 1.66 m(a) and 0.66 m 663
(b) above the dune profile (c) for five incident wind directions. (Hesp et al. 2015: Fig. 7, 664
reproduced with permission). 665
666
667
37 III. Alongshore winds
669
As the incident wind becomes more oblique (i.e., alongshore), the reduction in mean wind 670
speed at the dune toe and the increase in wind speed toward the crest become less 671
pronounced due to the declining effects of flow stagnation and streamline compression over 672
the effectively less steep dune form (Arens et al. 1995; Parsons et al., 2004). Overall, there is 673
also less spatial variability in near-surface flow speed over the dune (Fig. 8), although this does 674
depend on the variability in surface morphology as well as vegetation cover and distribution. 675
The reduced flow acceleration effect over the dune for highly oblique flows can often result 676
in increased sand transport potential along the beach (vs. into the foredune). However, the 677
greater drag on wind flow over the vegetated surface of the lower stoss slope can also produce 678
rapid wind speed decreases and some topographic steering towards the foredune toe, which 679
may enhance sand transport from the upper beach onto the lower stoss slope. Transport 680
potential over the stoss slope also decreases as a consequence of vegetation-induced drag, 681
thereby creating a large disparity between sand transport on the stoss slope versus that on the 682
beach. 683
If the foredune is scarped as a result of storm wave erosion, flow deflection patterns may 684
be significantly different, than that for a non-scarped dune. Winds above the scarp may be 685
deflected onshore towards the crest (Hesp et al., 2013) while flow seaward of the scarp is 686
deflected along the beach during oblique and alongshore winds (Hesp and Smyth, 2016a), 687
which may aid in the development of a dune ramp that rebuilds the eroded region (see 688
38 The geomorphic implications of these flow deflection phenomena are important for several 690
reasons. First, oblique winds can transport sediment onto a foredune or away from it 691
depending on the angle of incident wind or the presence of a dune scarp, thereby affecting 692
sediment supply to the dune. Second, deflected surface winds can influence net transport 693
pathways and sedimentation patterns on the foredune, as has also been documented over 694
transverse desert dunes. Third, transport conditions on the beach may be decoupled from 695
those on the foredune at certain approach angles. Fourth, fetch distances and sand transport 696
pathways into, and over, foredunes may be greater or less than predicted depending on the 697
nature and magnitude of flow deflection. Finally, sedimentary strata may be deposited more 698
crest transverse than the regional wind regime would indicate, thereby confounding paleo-699
environmental interpretations of relict dunes. Thus, assessments of landscape-scale dune 700
evolution using regional wind statistics from nearby weather stations or relict dune morphology 701
must also consider the confounding effects of topographic steering on near-surface flow 702
patterns and the overall foredune sediment budget (Hesp and Hyde, 1996; Walker et al., 2006). 703
In some settings (e.g., offshore oriented wind regimes), this may exert significant control on the 704
total sand supply to, and/or the distribution of sand within, the foredune system (Hesp, 2002; 705
and Davidson Arnott and Law, 1996; Walker et al. 2006; 2009a; 2009b; Lynch et al., 2009; 2010; 706
2013; Jackson et al., 2011; Bauer et al. 2012; Delgado-Fernandez et al., 2013), as discussed in 707
Section 5. 708
At the plot scale, the nature and degree of topographic forcing on near-surface flow 709
39 CFD simulations (e.g., Parsons et al., 2004; Beyers et al., 2010; Jackson et al., 2011; Hesp et al., 711
2015). Implementation of this understanding into predictive models remains a challenge. 712
4.1.5 Innovative Computational Fluid Dynamics (CFD) modeling of flow over foredunes 713
The development of robust CFD modeling has significantly advanced our understanding of 714
flow dynamics over dunes. Due to the logistical limitations of deploying field instrumentation to 715
measure wind flow over complex terrain (Walker, 2005), CFD simulations are being used 716
increasingly as a proxy and/or in conjunction with field measurements to accurately model 717
complex flow behavior over aeolian landforms (e.g., Parsons et al., 2004; Omidyeganeh et al., 718
2013; Pelletier et al. 2015; Hesp et al., 2015; Hesp and Smyth, 2016a; Smyth, 2016). 719
CFD is a numerical method of solving fluid flow by converting the Navier-Stokes (N-S) 720
equations to algebraic equations and solving them iteratively within a gridded computational 721
domain of a study area. Unlike the Jackson and Hunt (1975) model, which solved the N-S 722
equations linearly, CFD is capable of solving complex turbulent flow using a range of methods. 723
The two most common approaches are Reynolds-Averaged Navier-Stokes (RANS) and Large 724
Eddy Simulation (LES). RANS separates velocity and pressure into mean and fluctuating 725
components, which are substituted into the original N-S equations producing a steady state 726
solution of the mean flow dynamics. Unsteady or transient RANS (URANS and TRANS 727
respectively) can also be calculated by retaining the unsteady terms, instead of averaging, 728
making the dependent variables not only a function of space but also of time. LES produces a 729
transient solution of flow dynamics by modelling smaller scale vortices, which are close to 730
40 boundary conditions. The locations in the mesh where the N-S equations are simulated (i.e., 732
the N-S equations are solved) depends on the spatial resolution of the mesh and a spatial filter. 733
Where the cells are larger (smaller) than the filter, the flow is calculated exactly (modelled 734
using approximations). 735
Direct Numerical Simulation (DNS) of the N-S equations without any turbulence modelling 736
is also possible. However, the computational power required to solve all scales of turbulence 737
spatially and temporally makes the computational cost prohibitively expensive for use at high 738
Reynolds numbers over aeolian landforms. To date, most studies of wind flow over aeolian 739
landforms have been performed using RANS turbulence modelling, with the exception of 740
Jackson et al. (2011) who compared RANS, LES and a hybrid RANS-LES model with measured 741
data. In addition, Omidyeganeh et al. (2013) conducted an LES study of flow over a barchan 742
dune at a relatively high Reynolds number, more akin to flow conditions found in fluvial 743
environments. Building on this work, Pelletier et al. (2015) quantified turbulent shear stresses 744
that produce grain flows on the slip faces of aeolian barchan dunes. Smyth (2016) provides a 745
comprehensive review of recent progress in the use of CFD in aeolian research. 746
Despite recent advances, several limitations remain in CFD modelling of flow over aeolian 747
landforms (Smyth, 2016). Most notable for research on coastal dunes is the ability to 748
accurately model surface roughness imposed by vegetation. Vegetation drastically reduces 749
wind velocity and shearing force exerted near the surface, which causes sediment to be 750
deposited, which may over time result in increasing dune mass. In the majority of CFD codes, 751
41 the vertical resolution of the computational domain, as the cell closest to the surface (where 753
the roughness element resides) must equal twice the aerodynamic roughness length. The 754
problem is compounded by the recommendations of Franke et al. (2004), who advise that at 755
least two cells must exist between the surface and the area of interest inside the computational 756
domain. This remains a key challenge in aeolian geomorphology as sediment transport is driven 757
by flow dynamics very close to the surface within the ISL (see section 4.1.1), yet roughness 758
lengths can extend to tens of centimetres within and through the ISL. 759
4.2 Instantaneous sediment transport across the beach-dune profile 760
4.2.1. Classic ideas on equilibrium ‘saturated’ sand transport 761
A great deal of effort has been devoted to understanding the detailed physics of aeolian 762
saltation, usually under ideal conditions such as dry, unimodal sand on a flat, extensive surface 763
without vegetation or moisture controls. Many aspects of saltation (e.g., grain-fluid 764
momentum transfer, impact cratering, boundary layer adjustments) have also been simulated 765
using complex analytical and numerical models (e.g., Bagnold, 1941; Anderson and Haff, 1991; 766
Durán and Herrmann, 2006; Kok and Renno, 2009) but, in general, there is a presumption that 767
the transport rate is in steady-state equilibrium with the wind. This has been referred to as the 768
‘saturated’ flux condition (Sauermann et al., 2001). In parallel, a large number of empirical 769
studies have tested the performance of the basic predictive relations under natural field 770
situations, with often disappointing performance. In early experiments, sand transport was 771
measured with integrating traps over periods of 10-20 minutes and compared to values of u*
772
42 maximum theoretical rate predicted for saturated sand transport (e.g., Sarre, 1988; Bauer et al., 774
1990; Sherman et al., 1998; Sherman et al., 2011). Sherman and Hotta (1990) summarized how 775
the basic transport equations have been modified to accommodate the influence (usually 776
singly) of supply-limiting factors such as surface moisture, binding salts, topographic slope, and 777
sediment texture, which tend to reduce the maximum transport rate below that from standard 778
models (see review in Ellis and Sherman, 2013). 779
In the 1990s, a number of fast response sensors for high frequency measurement of sand 780
transport were developed and tested in the field, including: acoustic impact sensors (Spaan and 781
van den Abeele, 1991; Arens, 1996; Ellis et al., 2009); piezoelectric impact sensors (Stockton 782
and Gillette, 1990; Stout and Zobeck, 1997; Baas, 2004); and electronic balance traps (Jackson, 783
1996; Bauer and Namikas, 1998; McKenna Neuman et al., 2000). These sensors have permitted 784
field measurements of “instantaneous” sediment transport in combination with high frequency 785
measurements of wind flow. As a consequence, greater insight has been gained into the links 786
between wind turbulence and the resulting characteristics of aeolian transport, including 787
transport intermittency (e.g., Davidson-Arnott and Bauer, 2009; Davidson-Arnott et al., 2009; 788
Davidson-Arnott et al., 2012) and the event-based nature of saltation (e.g., “flurry” 789
characterization per Bauer and Davidson-Arnott, 2014). Advances in the ability to measure 790
surface moisture content have also enabled improved understanding of non-saturated flux 791
related to supply-limited conditions (e.g., Yang and Davidson-Arnott, 2005; Davidson-Arnott et 792
43 4.2.2. Improved understanding of the fetch effect on beaches and sand delivery to 794
foredunes 795
Increasing evidence collected from field studies from the 1970s to the 1990s identified a 796
persistent mismatch between measured and predicted transport rates on beaches (e.g., Svasek 797
and Terwindt, 1974; Sarre, 1988; Bauer et al., 1990; Davidson-Arnott and Law, 1990; Nordstrom 798
and Jackson, 1992; 1993). This compelled aeolian geomorphologists working on coasts to 799
contemplate the ways in which the beach-dune environment is different from desert surfaces 800
and wind-tunnel simulations. A primary factor involves the complexities of flow-transport 801
interactions from open water to sandy beach to foredune (Sherman and Bauer, 1993; Hesp and 802
Smyth, 2016b) that generates complex boundary layer adjustments, as well as specific 803
constraints on sediment transport imposed by the 'fetch' effect (Gillette et al., 1996; Bauer and 804
Davidson-Arnott, 2003; Delgado-Fernandez, 2010). Wind tunnel studies with dry, uniform sand 805
showed that the distance downwind from a sediment source boundary required for the 806
saltation cascade to achieve a constant transport rate (i.e., 'saturated' transport) was only a few 807
metres (e.g., Nickling, 1988; Shao and Raupach, 1992; Dong et al., 2004), although this may 808
depend somewhat on working section length, height and flow speed (Dong et al., 2004). 809
However, it has long been recognized for agricultural fields that, where some form of supply-810
limiting factor exists, this distance can be significantly longer (Chepil and Milne, 1939). Coastal 811
geomorphologists began exploring how important the fetch effect was for reconciling 812
differences between measured and predicted transport rates across beaches, especially on the 813