INTRODUCTION
The need for raw water from year to year will increase, along with the growth of world popula-tion (FAO, 2015). In Indonesia, the availability of water is expected to decrease further, along with population growth and ways of managing land that are still not suitable. Water resources in Indonesia are under increasing population pres-sure, rapid urbanization, industrial management and agricultural irrigation that does not pay atten-tion to good management techniques, so that it is feared to lead to water scarcity and will threaten national food security. By 2025, around 1.8 billion people are expected to experience water scarcity, while two-thirds of the population will experience
a lack of water availability (PBB,2014). Policy makers and stakeholders in the field of water resources management will face complex chal-lenges due to a variety of situations including climate change ecosystems, water quality prob-lems, increasing demand for clean water supply in urban areas and challenges to integrated, adap-tive, and watershed management, collaborative. Areas with arid and semiarid climatic conditions will continue to be affected by water scarcity and soil moisture deficit problems. Farmers will face a major challenge because the distribution of spa-tial-temporal rainfall and unpredictable rainfall patterns cause climate uncertainty and the situ-ation of changing seasons. These problems will affect agricultural production and will decrease
Accepted: 2020.01.07 Available online: 2020.01.25 Volume 21, Issue 2, February 2020, pages 126–130
https://doi.org/10.12911/22998993/116331
Effect of Land Use Changes of Upstream Komering Sub Watershed
on Declining Water Availability
Agus Lestari Yuono
1, Dinar Dwi Anugerah Putranto
1*, Sarino Tukirun
11 Department of Civil Engineering and Planning, Faculty of Engineering, Sriwijaya University, South Sumatera, Indonesia
* Coresponding author’s e-mail: [email protected]
ABSTRACT
Potential water resources in the upstream part of the Komering sub-watershed, in March each year ranges from 645.49 m3/sec. With a debit of that size, it should be able to increase national agricultural production in South
Sumatra, Indonesia. However, in August – September, the discharge of water availability in the upstream part of the Komering sub-watershed decreased to only 43.08 m3/sec. To analyze the reduced mainstay discharge of the
Upstream Komering sub-watershed, due to poor land use practices in the upstream area and the effects of climate
variability, it can be analyzed by analyzing land cover conditions, the value of rain variability, and the magnitude
of evapotranspiration and validation of direct measurement of river discharge in the field. Changes in land use for
the upstream part of the Komering sub-watershed, which are used mostly by residents as community plantation areas, have increased the critical condition of the upstream Komering sub-watershed area of 2,517,560 Km2, or
about 65.66% of the total upstream Komering sub-watershed. From the measurement of debit data at the Perjaya
Dam in the last fifteen years (2005–2019), the largest main discharge value in 2 weeks to two months in April
was 241.67 m3/sec, while the smallest mainstay discharge occurred in the first 2 weeks of October at 54.69 m3/sec.
A large difference between the largest and smallest mainstay discharge, it is necessary to think of a way so that the availability of water is always maintained throughout the year (the difference between the mainstay discharge
between the rainy season and the dry season so that it is not so extreme). Some ways that can be done to maintain the availability of water include making a reservoir that can be used during the dry season, or increasing storage in the soil by reforestation and harvesting rain.
food security. Sustainable management of water resources in the agricultural sector is very impor-tant to anticipate food crises and act as a catalyst for socio-economic development for the country. South Sumatera is one of the national food barns for Indonesia. Nearly 65% of the area in South Sumatera Province can become agricultural land. However, in recent years, due to inappropriate land management systems and a lot of land con-version to oil palm plantations, as well as defor-estation that is not well controlled, the main dis-charge of some watershed areas has been disrupt-ed. Many potential irrigation areas that have been designed to project water availability for decades to come, have experienced a very rapid decline in water quality and availability. One example, according to Yuono et all (2016), the Komering sub-watershed irrigation area, currently has expe-rienced a substantial mainstay of depletion during the dry season (June-November), compared to the rainy season (November-June).
This study aims to analyze spatially, the con-dition of the mainstay of the discharge of the up-per Komering sub-watershed, to determine the critical level of watershed in terms of its ability to be the main source of water supply for irriga-tion areas in South Sumatera, especially as the main source of water discharge at the Perjaya Dam in East OKU Regency, South Sumatera, in Indonesia.
MATERIAL AND METHODS
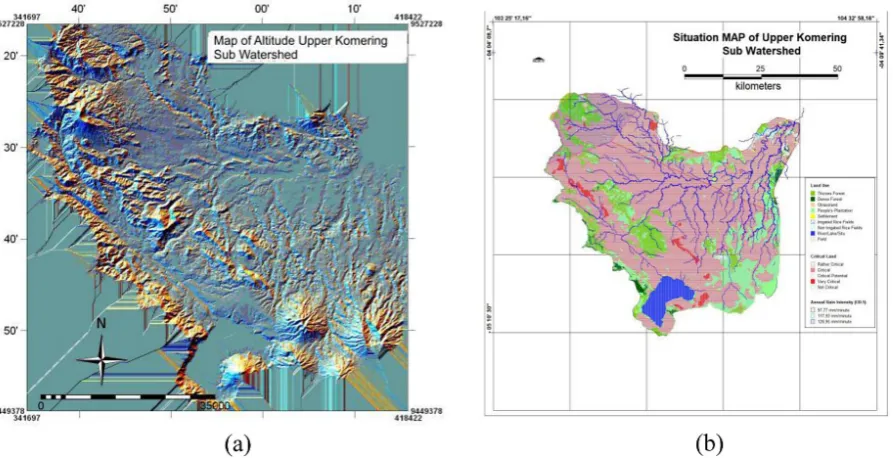
The research area is located in the upstream part of Komering Sub Watershed, which is geo-graphically located at coordinates 103o 34’ 26” – 104o 19’15” East Longitude and between 4o 16’ 22” – 4o 58’ 51” South Latitude (Figure 1). The area of the upstream sub-watershed Komer-ing sub-area is 3,904 Km2 which stretches from the upstream sub-watershed, namely Lake Ranau to the downstream part in Martapura village (Martapura District), East Ogan Komering Ulu (OKU), with the length of the main river of ap-proximately 112 Km.
The average height of the upstream Komering sub-watershed, the highest area is 1,875 m above sea level and the lowest is at an altitude of 100 m above sea level.
Rainfall data was obtained from Banding Agung observation station (South OKU) at an altitude of 700 m above sea level and Belitang station (East OKU) with an altitude of 100 m above sea level for the period of observation for 12 years (2006 – 2018). While the discharge measurements were obtained from measurements at the East OKU, Perjaya Dam, District of Mar-tapura, from 2005 to June 2019. Climatology data collected were monthly data, consisting of temperature, solar radiation, relative humidity, and wind speed. As for the slope obtained from the DEM analysis using height data (contour) obtained from the Shuttle Radar Topography
Mission digital Elevation Model (SRTM) with a resolution of 25 m, from the Balai Besar Wilayah Sungai (BBWS) region VIII, South Sumatera Province, in Indonesia (2016). Likewise, land use data, soil types and other data on a scale of 1: 50,000 were obtained from the BBWS region VIII, South Sumatera Province.
To calculate the mainstay debit data, used 10 years earlier to get the probability of success smaller or equal to 0.9 and 20 years to get the probability of success above 0.9. For mainstay discharge irrigation purposes it is usually set at 80% (0.8), so that the minimum required data is 10 years or more.
Determination of mainstay discharge used Waibul equation (discharge duration curve), namely :
(1) where: P (X> x) is the probability of the occur-rence of variable X (discharge) equal to or greater than x m3 / sec.
m is data rank
n is the amount of data X is a debit data series
X is the mainstay debit data series if the probability matches the designation, for example P (X> 80%) = 0.8
The basic concept used to calculate water availability is the hydrological cycle developed by Mock (1978), in this case the focus of analysis is centered on discharge through the watershed system, including components of rain, evapo-transpiration, interception, ground water, and wa-ter balance . Calculation of wawa-ter balance is adi-fication of the Thornthwaite method by ncluding limited evapotranspiration. It is also assumed that the green plants remain and the maximum soil moisture is 200 mm. The R80 mainstay discharge is used for analysis of water availability.
RESULTS
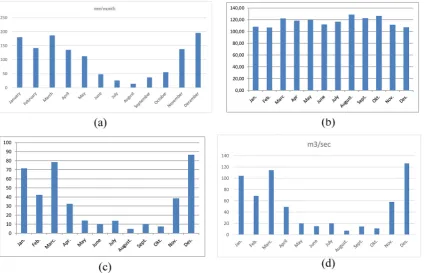
Based on the results of monthly rainfall analy-sis for R80, the highest average rainfall was found in November – May, with maximum rainfall in December (195.15 mm/month), and the lowest rainfall occurred in August (13.19 mm/month).
From Figure 2 it can be seen, the magnitude of potential evapotranspiration is 128.73 mm/ month in August and the lowest of 106.79 mm/month for February. The total run-off for the upstream Komering watershed, with an average slope ranging from 8% – 24%, and mostly dominat-ed by smallholder plantations with an average
infiltration coefficient of 0.317, the magnitude of the total run-off in the Komering sub-section The highest average upstream is between November to April, where the highest occurs in Decem-ber (86.61 m3/sec) and the lowest in August is 6.80 m3/sec.Based on the above conditions, the largest amount of stream flow for the upstream Komering sub-watershed was 126.24 m3/sec in December and the lowest occurred in August at 6.80 m3/sec. Based on the calculation of R
80 using the Mock method, the highest value of the aver-age main discharge occurs in November-May and the lowest in June-September, with the largest mainstay discharge in the second week of April at 248 m3/sec and the lowest in the month October of 52 m3/sec.
Based on field measurements the observations and analysis of the water balance of the upstream Komering sub-watershed for the first planting pe-riod in October and November 2019 to 2024 were in October (a) devisit of -32,668,480 m3 for 2019, while in 2024 devisit will occur – 51,802,592 m3, and if the potential land to be developed has al-ready been done by putting in a new paddy field, then the devisit of water will increase to twice, or
equal to – 133,560,915 m3. While the volume of water shortages, during the first planting period in November 2024 (b), there was a devisit of water debit amounting to – 10,926,188.56 m3 in 2024 and will increase to a devisit – 37,352,510.45 m3 in the second planting period. And if the develop-ment of new fields is then carried out, the devisit of water will increase to – 51,127,851.69 m3.
DISCUSSION
The availability of water in a watershed is related to the arrival of water sources, namely the rainfall that enters the watershed, as well as the amount of evapotranspiration. The relation-ship between the availability of water (Debit) that can be accepted by the watershed with the extent of the watershed is very decisive, although the area is large but not necessarily the resulting discharge is also large. The relationship of water availability with Evapotranspiration is certainly influential because evapotranspiration will re-sult in surface water and also water in plants will evaporate so that will result in reduced water that
Figure 4. Mainstay discharge of the Komering river for one year is calculated every two weeks
can be accepted by the watershed. Likewise, the relationship of water availability will be affected by the length of the river, if the river is long, it is certain that the volume of water it will load will also increase. With the length of the main rivers of the upstream Komering sub-watersheds along 112 Km, then the expected volume of up-per Komering sub-watersheds should be able to flow through the Perjaya Dam irrigation area. But in fact the debit mainstay of the Perjaya dam is declining, due to inappropriate land management. This is closely related to land management in the upstream area, where if the rainy season and soil erosion occur, the river will be eroded so that silt-ation will occur which will result in reduced river capacity. If the capacity of the river decreases while the incoming water exceeds the capacity of the river, the river will overflow and sometimes cause flooding.
At the current upstream Komering Sub-water-shed the maximum current is 269.80 m3/sec and a minimum discharge of 16.07 m3/sec. Monthly average discharge of 116.59 m3/sec. In April the upstream Komering Sub-watershed discharge was 125.28 m3 / sec. This is because the rainfall in the month is smaller because the sub-watershed only accepts rain only and does not receive runoff from other sub-watersheds. So that if it rains a little then the flow is also small or small. Long stream flow should be large because the river can hold more water, but the fact is that even though the river has a long amount of rain received in the watershed there is little or rarely rain, the flow will also be small. On this basis, efforts should be made to restrain the flow of runoff to enter more into the soil layer, which can be done by making more dams or reservoirs. At present, the construc-tion of Tigadihaji Dam weir is still being carried out. If the three haze weir has been completed, then the amount of discharge capacity that can be utilized will still devisit water for irrigation of 299,699,256.72 m3.
CONCLUSION
Based on the results of the analysis and dis-cussion above, it can be concluded as follows : 1. The recurrence of the mainstay discharge of
the upstream Komering sub-watershed is due to an increase in the conversion of the land of the real estate plantations almost 34% turned
function of water infiltration into the soil dur-ing the rainy season
2. To increase the main discharge of the Komer-ing sub-watershed, it is necessary to make ef-forts to increase reservoirs and reservoirs of water (lakes) for efforts in harvesting rain for the continuity of agriculture in the area.
Acknowledgements
Thank you to the Research and Community Service Institute of Sriwijaya University for fund-ing this research through the Competitive grant of the Sriwijaya University for the 2019/2020 fiscal year.
REFERENCES
1. Dinar Dwi Anugerah Putranto, Sarino, Yuono, AL, 2013, Model Monitoring Lingkungan DAS Untuk Pengendalian dan Mitigasi Bencana Banjir, FIT lSI
Conference, no. 5, 213–2020
2. Kadyampakeni D.M., S. Kazombo-phiri, B. Mati, and I. R. Fandika, 2014, Impacts of Small-Scale
Water Management Interventions on Crop Yield ,
Water Use and Productivity in Two Agro-Ecologies of Malawi,” no. April, pp. 454–465.
3. FAO,2015, http://www.fao.org/ag/agp/ greenercities/en/whyuph/
4. Patil J.P., A. Sarangi P. SinghA. K. Singh.T. Ahmad, 2008, Development of a GIS Interface for
Estima-tion of Runoff from Watersheds,” Water Resour.
Manag., vol. 22, no. 9, pp. 1221–1239.
5. Krois J, Schulte A (2014) GIS-based multi-criteria evaluation to identify potential sites for soil and water conservation techniques in the Ronquillo watershed, northern Peru. Appl Geogr 51:131–142 6. Ngigi, 2006. Hydrological Impacts of Land Use
Changes on Water Resources managements and So -cial Economic Development of upper Ewaso Ng’iro River Basin in Kenya
7. Putranto Dinar DA, Yuono AL, Sarino, 2017. Spatial distribution level of land erosion dispotion based on the analysis of slope on central Lematang sub Basin.
3rd International Conference on Construction and Building Engineering (ICONBUILD) 2017. AIP,
1903, 0300071 – 0300078.
8. United Nations (2014) Available online: http:// www.un.org/waterforlifedecade/scarcity.shtml 9. Yuono AL, Putranto Dinar DA, Sarino, 2015.
Digi-tal Terrain Model for Rainfall Run-off Modeling