Supply Chain Operational Performance and Its Influential
Factors: Cross National Comparison between Japan and China
Jingjing Gong Tomohiro Ogasawara Sadami Suzuki
Tokyo Institute of Technology (Tokyo Tech), Tokyo, Japan
Abstract
This research paper is intended to investigate the supply chain operational performance and its potential factors that constitute an efficient supply chain operational performance in Japan and China. In order to perform this, the SCM Logistics Scorecard (LSC) has been utilized as a self-evaluation tool for participating companies. The LSC focuses on four decisive areas, namely, company strategy, planning and execution capability, logistics performance, and IT method and implementation. The number of participating companies was 554 from Japan and 236 from China. The scores in each assessment area were compared between the two countries. Subsequently, factor analysis has been conducted by using the result of LSC in order to identify the significant factors which established the operational performance of SCM in each country. The result of the factor analysis indicated that the structure in generating successful SCM in Japanese industry and the Chinese were considered similar in the aspect of SCM realization, SCM strategy and the utilization of IT along the chain. Finally, the correlation between extracted factors and financial bottom lines was conducted, which indicated that improving SCM performance brought positive impact on financial outcome, especially when IT utilization in cooperation with SCM organization strategy.
Keywords:SCM Logistics Scorecard (LSC), Supply chain performance measurement,
Factor analysis. Introduction
With the information technology development and globalization of corporate activities, individual business in the 21st century, have no longer competed as a solely independent entity, but rather as a supply chain. Companies associated in the same network require efficient supply chain integration to cooperate together in order to optimize their overall performance and achieve maximum benefits as a whole. Therefore, Supply Chain Management (SCM) has been subsequently considered as a vital foundation for improving business competence. Moreover, numerous companies have started to appreciate that SCM could play a key role in building sustainable competitive advantage for their products in a highly competitive market.
accurate performance measures could be used to not only drive business improvement continuously but also set directions for future organizational strategies (Kuwaitti and Kay, 2000). As for the existing SCM performance measurement tools, most of them consist of simple Likert scale based on questionnaires (Li et al., 2006). Although the SCM Logistics Scorecard (LSC) has been developed also based upon the concept of 5-point Likert scale, the definition on level 1-5 of each assessment item was clearly defined in its own way. Furthermore, the LSC was found to be efficient to analyze the relationship between supply chain performance and its managerial performance (Arashida et al., 2008), investigate the correlation between institutional environment and supply chain operations (Yaibuathet et al., 2004), identify influential factors which determine the SCM operational performance and their impacts on financial bottom line indexes (Suzuki et al., 2009). Therefore, SCM Logistics Scorecard (LSC) could be considered practical for utilizing it as a data collection tool for this research.
From these regards, this research extends these previous researches on LSC by collecting much more data samples and explores a cross national comparison of SCM operational perfomance between two Asian countries, namely Japan and China.
The first research objective mainly focuses on analyzing and comparing supply chain operational performance level between Japan and China. In this cross national comparison, the impact of cultural differences between Japan and China on the SCM operational performance were also discussed from the cultural perspective, since organization culture and company sophistication played an important role in the development of supply chain management. Consequently, the second objective of this study attempts to verify that whether different countries produce different weights on approaches to SCM building. In order to derive these approaches, factor analysis was conducted on the LSC data of each country. Finally, the extracted factors were also used to examine whether these factors represented as drivers in leading SCM operational performance to improve the financial outcomes of the focal companies.
The rest of this paper is organized in the following order. The LSC is explained in the subsequent section together with the data collection process in Japan and China. Data analysis which includes comparative analysis in different countries, the comparison on performance structures and the correlation between the extracted factors and the financial bottom line indexes are outlined in the section three. The conclusions and future research approach are given at the final section of this paper.
SCM Logistics Scorecard (LSC) and Data Collection
SCM Logistics Scorecard (LSC)
none of the existing scorecards was considered to balance between these two dimensions. For this reason, the ultimate goal of LSC is to have a balance of these two dimensions together within a simple and versatile concept in order to get an easy database building process for benchmarking purposes.
Consequently, the LSC encompasses 22 assessment items based on four fundamental areas, which are 1) Corporate Strategy and Inter-Organization Alignment; 2) Planning and Execution Capability; 3) Logistics Performance and; 4) IT Methods and Implementation. Each assessment item is allocated into five-point scale from one to five. The detailed description of each level is also given indicating the 5th level as the best practice for each item. This method is different from the normal Likert-scale questionnaire, which, for example, gives statements and asks participants to judge themselves as strongly disagree (Level 1) to strongly agree (Level 5). With clearly provided information on each level, not only the respondents could identify themselves more precisely but also the bias among them could be reduced. The score of one integer and a half (for example 2.5) is also acceptable for managers who placed their companies between two levels. Despite the generality of this scorecard, individual companies could perform their self-assessment, and then compare their performance with competitors in the same industry cluster as well as across sectors. The result of this assessment could indicate the strengths and weaknesses of the existing working method from an SCM perspective (Suzuki et al., 2007, 2009). The detail of LSC is presented in the Appendix 1.
Data Collection Process
The LSC data collection has been carried out initially in Japan and then extended to China, Thailand, Finland and South Korea in order to expand LSC research scope to international comparisons. Accordingly, the LSC has been translated into other languages including English, Chinese, Thai, Finnish and Korean from its original version in Japanese.
The data collection process in Japan was launched in 2001 in cooperation with Tokyo Tech and JILS. Putting the most priority on data reliability, most data were obtained by interviewing high-level managers. The company evaluation through LSC was executed after the interview, which were conducted to ensure the identical understanding to the respondents, for example, the instructions of using LSC. A feedback report was then sent back to each respective company. This report contained the results of the company compared with others in the same group of industrial type including the rank among competitors. Thus, the provided incentive could maintain the reliability level of the achieved data. Then, the data collection has been extended to China from 2006 in cooperation with Tsinghua University, Xi’an Jiaotong University and Shanghai Jiaotong University. Most of the collection processes in China were followed those in Japan as well as targeted respondents. Meanwhile, Chinese data collection has been carried out without providing company feedback report.
companies, 236 valid data were successfully obtained. The category of LSC data both from Japan and China are shown in Table 1.
Data Analysis
Primary comparison between Japan and China
The purpose of this section is to accomplish the first objective of this research. Attempt has been made to verify that SCM performance level between Japan and China is different, and it may be influenced by different cultures. As a result of the data collection process, the data attribute and the distribution of the total score (110) between Japanese and Chinese companies are shown in Table 2 and Figure 1.
In order to ensure the reliability of LSC data which was used in this paper, the Cronbach’s coefficient alpha was calculated during the data collection process. The results were shown in terms of Cronbach’s coefficient alpha at 0.965 for 22 assessment items from Japanese data and 0.957 from Chinese data. These results indicated that high reliability of LSC was ensured. As the data attribute revealed, the average total score between Japanese and Chinese companies were different. Also, the standard
Table 1. Category of participating companies.
Japan China
Food 70 9
Electronics 71 85
Automotive 99 16
Chemistry 93 39
Fiber 8 4
Pharmaceutical 17 1
Others 196 82
Total 554 236
Table 2. Data attribute of total score between Japanese and Chinese companies.
Japan China
Number of data 554 236
Mean 62.53 65.94
Std. Dev 15.01 18.94
Variance 225.29 358.86
Median 61 67
Mode 54 83
Range 91 86
Maximum 105 110
deviation, variance and range of Chinese data were larger than Japanese, which meant that Chinese data showed higher degree of variation.
From the distribution chart of total score between Japan and China, it could be observed that the Japanese data presents a normal distribution, while the Chinese data is shown as a bimodal distribution. This polarization of Chinese data distribution may be caused by regional and cultural disparity. The average total score of these two countries were found different at significant level where the Chinese companies produced high scores than those from Japanese companies.
The average score and standard deviation of four fundamental areas were calculated and represented in Figure 2 and Table 3. T test is respectively conducted on total score with each average area score to identify whether those scores are influenced by country difference. The outcome of t-test is also presented in Table 2. Findings from t-test demonstrate that t-values of total score and all average area scores, except for area 4, are less than 0.05, confirming that those scores are statistically different. Chinese
Figure 1. Distribution chart of LSC total score between Japan and China.
companies occupied higher scores than Japanese ones, especially in area (1) Corporate Strategy and Inter-Organization Alignment, taking up the biggest difference which was noticeable at a fairly high significant level. On the other hand, the area (4) IT Methods and Implementation was dominated by the Japanese companies but not at significant level. The comparative result of each assessment item between Japanese and Chinese companies was also pointed out to recognize the strengths and weaknesses including the variation of those 22 items. This result is displayed in Figure 3 as a radar chart so as to make the data more understandable.
The highest competence items for Japanese industry were revealed in the strategies for optimizing logistics system resources based on design for logistics (item 2-1), delivery performance and quality (item 3-4) and give great attention to environmental activities (item 3-6). Japanese companies also outperformed in using
Table 3. Average scores of four areas between Japanese and Chinese companies. Assessment
Item Average SD Average SDJapan (554) China(236) t test
1. Corporate strategy and inter-organization alignment 3.06 0.71 3.35 0.90 –4.95**
2. Planning and execution capability 2.88 0.71 3.00 0.94 –1.88*
3. Logistics performance 2.83 0.69 2.93 0.92 –1.78*
4. IT methods and implementation 2.91 0.75 2.88 1.02 0.51
Average total LSC score 2.91 0.64 3.04 0.86 –2.32*
*: 5% significant; **: 1% significant
IT evolution such as introducing bar coding systems to synchronize the material and information flow, use electronic data interchange systems in the supply chains (item 4-1,4-2) and take effective usage of computers in operations and decision-making issues (item 4-3). On the other hand, Chinese companies focused on the capability of supply chain management, especially on clarifying contracts and sharing information with customers and suppliers, while much attention has also been paid on improving employee’ abilities to response to customer satisfaction. This conclusion was derived from the superior score in areas (1), (2) and (3).
The preliminary comparison shows that the Chinese industry was found to occupy the higher scores with the higher degree of variation. Findings after the t test confirmed that the supply chain operational performance level was statistically different between Japan and China. The result of raw score comparison between Japan and China could be considered by the following two aspects. On one hand, around 42% of Chinese participants were foreign owned enterprises, which could have obtained advanced knowledge, manufacturing standards and technologies, marketing and management systems from their mother companies in the US, Japan, Germany and so on. Those subsidiary companies must improve their competitive advantages by increasing the product quality, reducing inventory cost as well as leveling up the customer responsiveness instead of decreasing labor cost. Otherwise, the mother companies may relocate their manufacturing base to other countries which may influence the whole country’s economy. Moreover, the domestic firms which confronted a high competition with foreign companies at home and abroad, must improve their competitiveness, or they would be eliminated.
On the other hand, the comparison results also can be explained by the different cultures in the two countries. According to Takada (2003), Japanese people tend to be self-critical or evaluate themselves negatively when they are under a competition-free situation and feel affective bonds to others. Since the Japanese respondents were told that the LSC evaluations were a contribution for academic research and their results would be kept secret, the modestly rating may be tracked down among Japanese participants. On the other side, some studies indicate that, with the economic development, Chinese people become more and more individualistic, and they have a tendency to evaluate themselves rather leniency (Xie et al., 2006), therefore, it could be speculated that Chinese people may rate themselves higher than their actual performance.
Comparative Analysis on Performance Structure
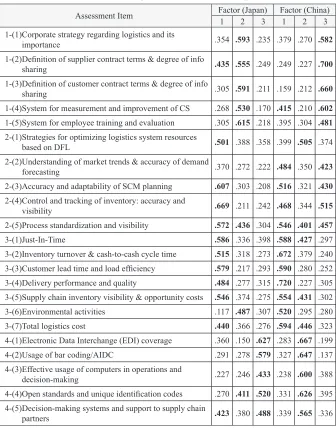
contributions rate at 47.93%, whereas, two factors were obtained from Chinese data at the cumulative contributions rate of 54.47%. In order to simplify the factor comparison between these two countries, the number of Chinese extracted factors was limited to three during the principal axis factoring analysis. Therefore, three factors were obtained from Chinese data with the cumulative contribution rate at 57.34%. Varimax rotation was used during the process of factor analysis in order to remain the independent relations among the extracted factors. The factor matrix is shown in Table 4, the items with factor loading more than 0.4 as well as the highest loading for each item are highlighted in dark.
Table 4. Rotated factor matrix of 554 Japanese and 236 Chinese samples.
Assessment Item Factor (Japan)1 2 3 Factor (China)1 2 3
1-(1)Corporate strategy regarding logistics and its
importance .354 .593 .235 .379 .270 .582
1-(2)Definition of supplier contract terms & degree of info
sharing .435 .555 .249 .249 .227 .700
1-(3)Definition of customer contract terms & degree of info
sharing .305 .591 .211 .159 .212 .660
1-(4)System for measurement and improvement of CS .268 .530 .170 .415 .210 .602
1-(5)System for employee training and evaluation .305 .615 .218 .395 .304 .481
2-(1)Strategies for optimizing logistics system resources
based on DFL .501 .388 .358 .399 .505 .374
2-(2)Understanding of market trends & accuracy of demand
forecasting .370 .272 .222 .484 .350 .423
2-(3)Accuracy and adaptability of SCM planning .607 .303 .208 .516 .321 .430
2-(4)Control and tracking of inventory: accuracy and
visibility .669 .211 .242 .468 .344 .515
2-(5)Process standardization and visibility .572 .436 .304 .546 .401 .457
3-(1)Just-In-Time .586 .336 .398 .588 .427 .297
3-(2)Inventory turnover & cash-to-cash cycle time .515 .318 .273 .672 .379 .240
3-(3)Customer lead time and load efficiency .579 .217 .293 .590 .280 .252
3-(4)Delivery performance and quality .484 .277 .315 .720 .227 .305
3-(5)Supply chain inventory visibility & opportunity costs .546 .374 .275 .554 .431 .302
3-(6)Environmental activities .117 .487 .307 .520 .295 .280
3-(7)Total logistics cost .440 .366 .276 .594 .446 .323
4-(1)Electronic Data Interchange (EDI) coverage .360 .150 .627 .283 .667 .199
4-(2)Usage of bar coding/AIDC .291 .278 .579 .327 .647 .137
4-(3)Effective usage of computers in operations and
decision-making .227 .246 .433 .238 .600 .388
4-(4)Open standards and unique identification codes .270 .411 .520 .331 .626 .395 4-(5)Decision-making systems and support to supply chain
From the Japanese findings, factor one showed strong relationship with all items in area (2) and area (3) except the item 3-(6). Since these items may account for the agility and flexibility to market changes including the ability to respond to customer requirements, this factor was named as “Responsiveness”. Meanwhile, since factor two had high correlation with all the items from area (1) and environmental activities, which are related to the organizational issues in order to build up the efficient supply chain, it was entitled as “SCM Organization Ability”. Factor three was related to all items in area (4), it was, therefore, named as “IT Utilization Ability”. Since the raw score of each item in LSC can be considered as a result of the capability of these factors, these three factors were identified as the measurement indices for SCM operational performance of Japanese sector.
With respect to the results from Chinese companies, three factors were defined as follows. The first factor was found to have high relationship with most items from area (2) and all items from area (3), thus, it was also called “Responsiveness”. Subsequently, the second factor was examined to identify the related items, which were all from area (4) with some contents of 2-(1) that concerned with the strategies for optimizing logistics system resources based on design for logistics. Therefore, the specified name was “IT utilization ability” too. The uncovered final factor had strong correlation with corporate strategy and Inter-organization alignment, in this case, “SCM Organization Ability” was designated for this factor. Consequently, three factors were extracted from Chinese data to point out the structure of generating efficient supply chain for Chinese industry.
The result of the factor analysis revealed that the factors which identify their SCM competencies were considered similar between Japan and China. From the pattern matrix, it was worthwhile to note that both Japanese and Chinese respondents considered the SCM organization issues and technical issues independently. However, the results indicated a slight contradiction to previous research findings, that is, the analysis results both from Finland and Thailand revealed that supply chain organization strategy and IT utilization were considered together as one factor extracted from factor analysis (Yaibuathet et al., 2007). The decisive difference could be explained by the fact that Japanese and Chinese people are all identified to the oriental Confucian culture and both of them have a high long-term orientation (Hofstede, 1994). They believe that the building of long-term collaboration with suppliers is very important, and the IT usage just plays a separated role as an enabler to achieve higher SCM performance. While, both Finland and Thailand seems to believe that effective IT utilization do assist in delivering right strategy about SCM throughout the organization as well as achieving a high degree of information sharing among business partners.
Correlation Analysis Between SCM Operational Performance and Financial Indexes
financial outcome. According to previous research (Yaibuathet et al., 2007), some time-lag considerations which reflect SCM operational performance to the managerial effectiveness have to be taken into account. Theoretically, it could be considered that efficient SCM operational performance could lead to better inventory management, and then, inventory reduction could lead to enhance better cash flow and ROA in a time-lag process. Thus, the following time-lagged data of the financial bottom line indexes were used, that is, the inventory turnover period in the same year when the LSC data were collected, one year later for cash flow and two years later for ROA.
Since the number of financial data from China were only 24, it was too limited to be analyzed in this section. Therefore, only the Japanese data were utilized to explore the correlation between each factor and the corresponding company’s financial bottom line indexes such as ROA, Cash Flow (CF) and the Inventory Turnover Period (ITP) which were obtained from Nikkei Economic Electronic Databank System CD-ROM (NEEDS).
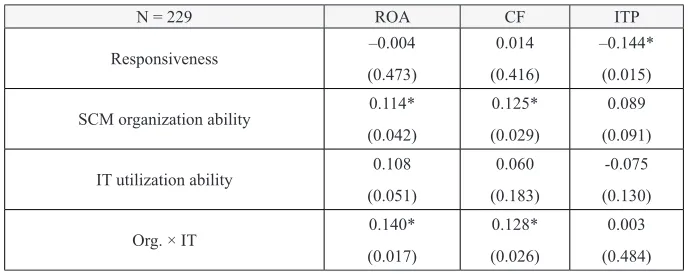
The result of correlation analysis is shown in Table 5. Focusing on independent effect of each factor, it can be seen that, Responsiveness just had a significant impact on inventory turnover period, which indicated that improvement in the ability to respond to market could reduce the inventory turnover period. SCM Organization Ability took a significant positive correlation with ROA and CF, while IT Utilization Ability was found to have little relation with these three selected financial indexes. Since, an improvement in the ability of responsiveness seems to reduce inventory turnover period, this operational performance factor just has a short-term effect on financial performance. Meanwhile, enhancing the SCM organizational ability could produce significant financial outcomes in a long-term effect. The implementation of IT is also a vital factor which can influence the operational performance in supply chain. However, improving IT capability alone can’t be a distinctive factor directly related to financial performance without a proper organization management (Shin, 2001). As well as for the suggestion of the well-known “IT Paradox”, it is difficult to obtain a directly positive effect from IT investment to operational outcomes. Therefore, as shown in Table 5, the IT utilization in cooperation with SCM organization strategy was analyzed, the result illustrated that synergetic effect of organization ability and IT utilization could yield better financial outcomes than the merely extension of IT usage or organization ability separately in supply chain.
Table 5. Correlation between SCM operational performance and financial indexes (Japan).
N = 229 ROA CF ITP
Responsiveness –0.004
(0.473)
0.014 (0.416)
–0.144* (0.015)
SCM organization ability 0.114*
(0.042)
0.125* (0.029)
0.089 (0.091)
IT utilization ability 0.108
(0.051)
0.060 (0.183)
-0.075 (0.130)
Org. × IT 0.140*
(0.017)
0.128* (0.026)
Conclusions and Future Research
In this research, the SCM Logistics Scorecard (LSC) was utilized as an evaluating instrument to investigate the supply chain operational performance and its potential factors which constitute an efficient SCM in Japan and China, respectively. As well, the correlation between SCM operational performance and financial indexes were analyzed based on Japanese data. The findings and implications were concluded as follows:
First, the preliminary comparison between Japanese and Chinese participants’ data indicated that performance level scores from the two observed countries were statistically different, and Chinese scores were higher than Japanese. In addition to the reason that foreign owned enterprises seemed to influence the overall performance of Chinese industry, this unexpected result could be explained by the different cultures between the two countries. As for China, the average score of area (1) was unexpectedly higher than those from Japan, which could be explained by China’s unique culture-Guanxi. Guanxi operated as a governance mechanism which brings direct effects on market performance and indirect effects through channel capability and responsive capability in the transitional economy of China (Flora et al., 2008). However, building up Guanxi would take a lot of time and costs, and managers should also be aware of Guanxi’s risks including reciprocal obligations, corruption, ethical issues and so on. Moreover, according to the Hofstede’s cultural dimensions, the Chinese culture is identified in the low uncertainty avoidance (UAI) dimension (Hofstede, 1984), that is, Chinese people have a tendency to evaluate themselves rather leniency. As a contrast, the Japanese culture is attributed to have a high uncertainty avoidance (UAI) position. This means that the people who are in the high UAI country tend to show more rigor, anxiety and stress, and they are very strict to themselves, consequently, they evaluate themselves rather modestly or strictly. Also, according to Enkawa’s research (2010), the SCM performance is lower as UAI is higher.
Second, the results of factor analysis indicated that the potential factors which impact Japanese supply chain performance structures were similar to the Chinese except for the factor arrangement, but different from previous research. The most significant difference was that the IT usage was not identified as a unique factor from Thai and Finnish data sets, but as an independent factor in Japan and China. The result may be explained by that, both Japanese and Chinese think that long-term collaboration with business partners is very important, and the IT usage is just an enabler to achieve better SCM performance. Meanwhile, both Finland and Thailand seem to believe that effective IT utilization cooperating with strategy throughout the organization could achieve a high degree of SCM operational performance. In addition, the reason why Japanese and Chinese companies build a similar structure of SCM may be explained by that, after China’s reform and open policy, China have been adapting lots of structures from Japan, especially, the business management thinking, method and economic development model, which are deeply influenced by Japan’s management thought. Thus, the way of building SCM is similar between Japan and China.
Utilization Ability has weak relation with financial indexes. However, when considering IT utilization in cooperation with SCM organization strategy, a stronger relationship with financial outcomes could be appeared than when they are considered separately. It is implied that organization strategy is a vital element to enhance IT usage in a company and later bring growth on financial performance. Thus, it is a weakness both for Japan and China, the SCM Organization Stragety and IT Utilization are independent factors to their SCM building.
Since this paper only examines the performance structure between Japan and China in national level, the future research will draw attention to investigate the interactions among different industries as well as their ownership status. In addition, the correlation analysis was conducted between influential factors and financial indexes just based on Japanese data. In order to verify the relationship more clearly, much more financial data are expected to be obtained from developed and developing countries in the future.
Finally, the scope of this research is expected to be extended to collaborate with national organizations for systematic data collection in a larger scale in order to create a reliable database in future. It is also further expected that the directions provided in this research would be utilized as a prototype for investigating and enhancing supply chain operational performance in other newly industrialized developing countries.
References
Arashida, K.; Enkawa,T.; Hamasaki, A. and Suzuki,S. (2004) Developing the SCM logistics scorecard and analysing its relation to the managerial performance. Journal of Japan Industrial Management Association, Vol. 55, No.2, pp.95-103.
Electronic Commerce Council of Canada – ECCC. (1998) Efficient Consumer Response (ECR). Scorecard: ECCC.
Enkawa, T. (2010) A Cultural Perspective on Japanese Strengths and Weaknesses in Operation Management. Journal of Japan Industrial Management Association, Vol. 61, No. 3, pp.131-138.
Flora, F.G.; Hung, K. and David, K.T. (2008) When does guanxi matter ? Issues of capitalization and its dark sides. Journal of Marketing, Vol. 72, pp.12-28. http://dx.doi. org/10.1509/jmkg.72.4.12
Hofstede, G. (1984) Cultural Dimensions In Management And Planning. Asia Pacific Journal of Management, Vol. 1, No. 2, pp.81-99. http://dx.doi.org/10.1007/BF01733682
Hofstede, G. (1994) Management Scientists Are Hunman. Management Science, Vol. 40, No. 22, pp.4-12. http://dx.doi.org/10.1287/mnsc.40.1.4
Kuwaitti, M.E. and Kay, J.M. (2000) The role of performance measurement in business process re-engineering. International Journal of Operations and Production Management, Vol. 20, No.12, pp.1411-1426. http://dx.doi.org/10.1108/01443570010353086
Li,S.; Ragu-Nathan,B.; Ragu-Nathan,T.S. and Rao,S.S (2006) The impact of supply chain management practices on competitive advantage and organizational performance. OMEGA: The international Journal of Management Science, Vol. 34, pp.107-124.
Quick Response Leadership Committee - QRLC. (1996) QRLC Measurements for Excellent. American Apparel Manufactures Association (AAMA).
Shin, N. (2001) The impact of information technology on financial performance: the importance of strategic choice. European Journal of Information Science, Vol. 10, No.4, pp.227-236. http://dx.doi.org/10.1057/palgrave.ejis.3000409
Suzuki, S.; Ohno, A. and Enkawa, T. (2007) Quantifying Inter-organizational Recognition Gaps which Impede SCM Efficiency. Journal of Japan Logistics Society, Vol. 7, No. 2, pp.11-19.
Suzuki, S.; Kitamura, S. and Enkawa, T. (2009) The Influence of Market Uncertainty on SCM Competencies and Managerial Performance. Journal of Japan Industrial Management Association, Vol. 60, No. 2, pp. 69-76.
Takada, T (2003) Self-enhancement and self-criticism in Japanese culture. Journal of Cross-cultural Psychology, Vol. 34, No. 5, pp.542-551. http://dx.doi.org/10.1177/0022022103256477
Xie, J.L.; Chen, Z. and Roy, J.P. (2006) Cultural and personality determinants of leniency in self-rating among Chinese people. Management and Organization Review, Vol. 2, No. 2, pp.181-207. http://dx.doi.org/10.1111/j.1740-8784.2006.00043.x
Yaibuathet, K.; Enkawa, T. and Yoshika, T. (2007) Impact of Information Technology and SCM Organizational Strategy on Corporate Financial Performance and Its Cross National Comparison. International Journal of Information Systems for Logistics and Management, Vol. 3, No.1, pp.13-24
Yaibuathet, K.; Enkawa, T. and Suzuki, S. (2007) Supply Chain Operational Performance and Its Influential Factors: Cross National Analysis. Journal of Japan Industrial Management Association, Vol. 57, No.6, pp.473-482.
Yaibuathet, K.; Enkawa, T. and Suzuki, S. (2008) Influences of Institutional Environment Toward the Development of Supply Chain Management. International Journal of Production Economics, Vol. 115, No.2, pp.262-271. http://dx.doi.org/10.1016/j.ijpe.2008.02.018
Biography
Jingjing Gong received her Master degree in Jilin University, China (2009). She is a research student in the Department of Industrial Engineering and Management, Tokyo Institute of Technology, Japan from 2010. She will continue to conduct researches at the doctorial course in the same department from this October. Her research interest is in Operations Management, mainly concerned with Supply Chain Management, New Product Development.
Contact: [email protected]
Tomohiro Ogasawara received his B.Eng. in the Department of Industrial Engineering and Management, Tokyo Institute of Technology, Japan (2010). He is a master course student there and conducts research to obtain his Master degree. His research interest is in Operations Management, mainly concerned with Supply Chain Management, Financial Engineering.
Contact: [email protected]
Sadami Suzuki is an Associate Professor in the Department of Industrial Engineering and Management, Tokyo Institute of Technology, Japan. He received his B.Eng., M.Eng and D.Eng. from Tokyo Institute of Technology in 1998, 2000, 2007 respectively. His research are focuses in Production and Operations Management, mainly concerned with Supply Chain Management, Logistics and Theory of Constraints. Contact: [email protected]
Article Info:
A
pp
end
ix
Appendix 1.
SCM Logistics scorecard (LSC).
Area
Item
Level 1
Level 2
Level 3
Level 4
Level 5
(1) Corporate strategy regarding logistics and its importance Top executives have not formulated a strategy or policy regarding logistics/ SCM. No department has responsibility
for logistics/
SCM improvement or
innovation.
A department with responsibility for logistics system innovation exists, but
action is limited to that department. Logistics/ SCM strategy is not clearly defined.
Top
management not actively involved. Under leadership of a top executive, there is a program for logistics/ SCM innovation, but the program does not extend company-wide. Supported by a clear corporate- level strategy
, a top executive
(managing executive director or above) leads efforts for logistics/ SCM
innovation.
The
innovation program is making progress.
Under the CEO’
s
leadership and a clear corporate strategy
, there is
an company-wide system that supports rapid adaptation of the supply chain to environmental
change.
(2) Definition of supplier contract terms & degree of information sharing (IS)
No formal written
agreement or information sharing with main suppliers. Decision making is done independently
.
Formal written agreements exist
with some suppliers. Agreements with other suppliers are under consideration.
Formal written
agreements exist with some suppliers, but the agreements are not necessarily based on win-win solutions for
both parties.
Formal, written
agreements exist with nearly all suppliers. Some of these are aimed at win-win solutions based on information
sharing.
Formal written agreements exist with nearly all
suppliers. Company
has a
well-established approach for seeking win-win solutions based on strategy and IS.
1. Corporate strategy and inter
-or
ganization alignment
(3) Definition of customer contract terms & degree of information
sharing
No formal, written
agreement or information sharing with main customers. Decision making is always done by
customers.
Formal written agreements with customers are under consideration.
Formal written
agreements exist with some customers, but the agreements are not necessarily based on win-win solutions for
both parties.
Formal, written
agreements exist with nearly all customers. Company has a partly- established approach for seeking win-win solutions based on information sharing under a leadership of
customers.
Formal, written
Area
Item
Level 1
Level 2
Level 3
Level 4
Level 5
(4) System for measurement and improvement of customer satisfaction
No clear definition of customers. Customer complaints are resolved in a temporary and expedient
way
.
There is a clear definition of
customers. However
,
there are no periodic surveys of customer satisfaction levels; no record of customer complaints is kept. Periodic surveys of customer satisfaction levels are carried out. However
, the survey
results are acted upon only by the sales department, with low cross- function
involvemen.
Periodic
quantitative
surveys of customer satisfaction levels are carried out.
There
is cross-functional
involvement to improve customer satisfaction.
In addition to
Level 4, the results
of customer
satisfaction surveys are shared with relevant customers and are used in the joint development of products/services.
(5) System for employee training and evaluation
No particular training
program exists to develop employee abilities to achieve customer satisfaction and system
optimization.
Company slogans
dealing with customer satisfaction or system optimization exist, but there are no corresponding training
programs.
A
training program for increasing employee abilities to achieve customer satisfaction and system optimization exists and is put into
practice.
Meets Level 3, and in addition, the employee evaluation system directly considers employee abilities to achieve customer satisfaction and system optimization.
Training
leads to increased
employee empowerment.
In addition to Level 4, there is a knowledge management system for sharing knowledge and know-how at the team and
or
ganization level.
(1) Strategies for optimizing logistics system resources based on design for logistics
Efficienct utilization of logistics facilities and resources is not seen as a problem. No improvement
strategy exists.
Importance of
optimizing logistics system resources is recognized, but there is no strategic plan or
review
.
Strategic plan exists for review of transportation modes and inventory allocation among plant, distribution center
, transfer center
.
Optimization ef
forts are
making progress.
In addition to Level 3, suppliers and customers are involved in ef
forts
to optimize logistics systems resources. Clear strategy exists for collaboration and optimization across the supply chain, including product re-design based on design for logistics, and use of other approaches such as joint distribution
and category management.
Appendix 1.
Area
Item
Level 1
Level 2
Level 3
Level 4
Level 5
(2)
Understanding of market trends & accuracy of demand forecasting
Rely on the experience and judgment of the sales department to predict market trends and forecast
demand.
Demand forecasting for certain products
is based on a
quantitative sales history combined with the judgment and experience of the sales
department.
Demand forecasting for key products is based on an analysis of market trends and quantitative sales history
, and
includes the input of sales and related department.
Level 3 approach is
extended to all products, and forecasts for key products are broken down into items or categories. Demand forecasting system is in
place.
Level 4 approach is carried out jointly with supply chain partners. Demand forecasts can be revised dynamically for changing market
conditions.
2. Planning and execution capability
(3) Accuracy
and
adaptability of SCM planning Planning for sales, replenishments and delivery is carried out separately
, without
consideration of inventory
availability
.
Plans for sales,
replenishment and delivery are intended to be coordinated with each other on a monthly basis, but in practice this is only partially achieved. Plans for sales, replenishment and
delivery are supposed to be coordinated with each other on a weekly basis, but individual departments may make their own adjustments
during week.
Linkage of weekly plans between departments is done on a rolling basis. Plan adjustments for customers can be done
on a daily basis.
Linkage of daily plans between departments is done on a continuous basis. Plan adjustments for suppliers or customers can be done on an hourly
basis.
(4) Control and tracking of inventory (product/parts/ WIP): accuracy and visibility No tracking or visibility of inventory/WIP
status.
Management action is taken after
-the-fact.
For most items, inventory status is tracked on a daily basis, and supply is adjusted to meet demand on a monthly
basis.
A
system is in place which enables the
company to manage and track its own inventory and replenishment activities on a daily
basis.
A system is in place which enables the company to manage
and track inventory and replenishment activities for itself and its suppliers on a daily/hourly basis. Inventory and replenishment activities are managed and
tracked throughout the entire supply chain, including suppliers and customers. Information is strategically shared.
Appendix 1.
Area Item Level 1 Level 2 Level 3 Level 4 Level 5 (5) Process
standardization and visibility Little standardization of work methods or use of unit loads. Some process activities are treated as a
“black-box”.
W
ork methods are
mostly standardized, but the overall work flow is not completely
visible.
W
ork methods are
standardized and unit loads are used, but interface activities with suppliers and customers are not made sufficiently visible.
W
ork flow
, including
interface activities with suppliers and customers, is standardized and made visible.
There is
continuous improvement of work activities within
the company
.
In addition to
Level
4, partnerships
are established for each business unit and the entire supply chain is made visible. Process innovation is continually pursued.
(1) Just-In-T
ime
(elimination of idle time and setup time through information sharing and synchronization of material and information flow)
JIT
philosophy is not
part of the company’
s
approach or practices.
Company recognizes the importance of JIT
philosophy
, but
has not implemented
JIT
practices
in production, replenishment,
material handling or
delivery
.
JIT
practices such as
setup time reduction, lot-size reduction, load consolidation or floor
-ready merchandise are implemented, but they are not synchronized with other activities.
Some JIT
activities
are synchronized (e.g, picking sequence is determined from delivery plan, delivery trucks allocated based on picking sequence, etc).
JIT
activities are
synchronized throughout the material flow and involve suppliers and customers.
(2) Inventory turnover & cash- to-cash cycle
time
Neither inventory
turnover nor cash-to-cash cycle time are measured. Inventory turnover is low
,
and cash flow is poor
.
Inventory turnover is known at the aggregate level for each facility
,
but inventory
management is not linked to cash flow
.
Inventory turnover for each supplier and individual product is measured with accuracy at the week-level and actual performance level of less than 12
turns/year
.
Inventory turnover for each supplier and SKU is measured with accuracy at the day-level and actual performance level of 12+ turns/year
, and
linked with cash flow
.
Exceeds Level 4, with inventory measured with accuracy at the hours-level and actual performance of 24+ turns/year
.
Cash-to-cash cycle time is less than
10 days.
Appendix 1.
Area
Item
Level 1
Level 2
Level 3
Level 4
Level 5
(3) Customer lead time (from order placement to receipt) and load efficiency
Lead-time from order placement to receipt is long. Company receives frequent requests from customer to shorten
lead-time.
Lead-times for different customer
categories are known, but orders with short lead time are covered by on-hand inventory
.
Little ef
fort made to
reduce lead-times.
Lead-time is known and managed for each customer or item category
, and is linked
to truck allocation planning to increase load efficiency
.
In addition to Level 3, average lead-time is less than 2 days. Continuous efforts made to further reduce lead-times.
In addition to
Level
4, achieves
load efficiency of 80% or higher
.
3. Logistics performance
(4) Delivery
performance and
quality
On-time delivery rate (on-time deliveries/ total orders) and order fulfillment accuracy (accurate deliveries/total orders) are not known. Company faces many customer complaints. On-time delivery rate and order fulfillment
accuracy are
measured, but actual performance level is less than 95%. Performance is between 95 and 99% for both rates. T
o
improve
performance, ef
forts
are made to collect data on the root causes of late deliveries, stock outs, miss deliveries,
damage...
Performance exceeds 99% for both rates. Based on data about root causes, error prevention measures
such as mistake-proofing are implemented on an
ongoing basis.
In addition to
Level 4, suppliers and customers are involved in improvement ef
forts.
While maintaining high performance, efforts to improve efficiency
, such
as elimination of
incoming inspections,
are promoted.
(5) Supply
chain inventory visibility & opportunity costs Only on-hand inventories within one’
s own facility
or company are known. Opportunity cost of lost sales is not known or
estimated.
Inventory levels
within the company are known. Some estimation is made of the opportunity cost of
lost sales.
Inventory levels are
known for the company and its immediate suppliers or customers. Some estimation is made of opportunity cost of lost sales for
company only
.
Inventory levels are
known for the company and its immediate suppliers and customers. Some estimation is made of opportunity cost of lost sales for the
company only
.
Inventory levels are known throughout the entire supply chain. Estimation is made of opportunity cost of lost sales at the end demand
level.
Appendix 1.
Area
Item
Level 1
Level 2
Level 3
Level 4
Level 5
(6)
Environmental activities Low level of concern for environmental issues. No systematic ef
forts at the
company or business- unit level to reduce environmental impacts. Environmental issues are addressed at the company-level, such as through implementation of an environmental
mgmt system.
W
ithin the company
,
a department has responsibility for coordination of
environmental ef
forts.
Company is making progress in reducing its environmental impacts, as measured in its environmental management system, such as through recycling, source reduction, green purchasing, etc. In addition to Level 3, innovations in logistics system have been implemented to reduce environmental impacts (transport. mode selection, route efficiency
, reduction
of packing materials, supplier selection, etc.). In addition to Level 4, ef
forts
also involve
product design and development to consider design for logistics, design for environment, and other life cycle
issues.
(7) T
otal
logistics cost (transportation costs, inventory holding costs, order management
costs,
administrative costs, etc) Order management costs and product
manufacturing costs are known, but logistics- related costs are not well- defined or separated out.
Most logistics-related costs for the company are known at an aggregate level (e.g. own transportation
costs, freight
payments to outside carriers, inventory holding costs). In addition to Level 2, logistics-related costs are broken down to individual supplier and customer level well enough that they can be utilized in revenue
management.
Total logistics costs (transport., inventory holding, order mgmt, admin. costs, etc) are broken down for each supplier and customer
.
Using activity-based costing approach, this information is used in revenue
management
and
system improvement and
innovation.
In addition to Level
4, total
logistics costs throughout the supply chain are known and shared among supply chain members.
W
in-win scenarios for cost reduction are developed from the viewpoint of supply chain optimization.
Appendix 1.
Area
Item
Level 1
Level 2
Level 3
Level 4
Level 5
4. IT
methods and implementation (1) Electronic data interchange (EDI) coverage
Company is not
electronically linked to any customer or supplier
.
EDI links are set up with some customers or suppliers at their
request.
EDI is used with over 50% of customers or suppliers. Proprietary EDI standards are used
in most cases.
In addition to Level 3, EDI is integrated with the company’
s internal
systems so that manual re-entry of data is not necessary in most cases. EDI is used for nearly all
transactions and is integrated with internal systems. Open standards for EDI are adopted or in-process of adoption.
(2) Usage of bar coding / automatic identification and data capture (AIDC)
Bar codes or other forms of automatic identification and data capture (AIDC)
are not utilized.
Bar codes are utilized in some activities such as inspection, but the data is not used for other purposes. Bar codes are utilized in some activities, such as inspection, and the data is shared with internal systems to synchronize
the material and information flow
.
Extending the scope of Level 3, bar codes are used as a means to accelerate innovation of the logistics system, in addition
to synchronizing
the material and information flow
.
The best mix of bar codes, 2-dimensional symbols, IC tags and other
AIDC
methods
are linked with EDI, and used to support innovation of the logistics system at the supply chain
level.
(3) Ef
fective
usage of
computers in operations and decision-making (ERP
, supply
chain planning software, etc.)
PCs are not utilized
anywhere in the business.
PCs are used to
support some business
operations and activities. Most routine business operations and activities are computerized (e.g, accounting, production, etc.) but are not integrated with each
other
.
In addition to Level
3,
decision support
systems and other IT tools are utilized for logistics planning and
optimization.
ERP
, SCP
, CRM and
other IT
tools are
utilized for planning and optimization of the entire supply chain. Outsourcing and other means are considered for increasing the ef
fective use
of IT
and related resources.
Appendix 1.
Area
Item
Level 1
Level 2
Level 3
Level 4
Level 5
(4) Open standards and unique identification codes Company has no awareness of open standards and unique identification codes. Company understands the importance of open standards and unique identification codes for improving the efficiency of logistics processes.
To exploit the
potential of IT
, unique
identification codes are used within the company and process simplification is also
carried out.
In addition to Level
3,
usage of unique
identifiers is extended to suppliers and/ or customers. Open standards for EDI and other IT
applications
are adopted or under consideration. In addition to Level 4, unique
identification codes are extended to both suppliers and customers. Company is actively working towards adoption of open
standards for
EDI and other IT applications.
(5) Decision- making systems and support to supply chain partners No knowledge or interest in the decision-making processes and systems used by suppliers or
customers.
Has a general
understanding of how a supplier or customer makes its decisions, but does not know the details of the systems
used.
Understands the systems used by a supplier or customer
,
but has made no
proposals or ef
forts to
bring about a win-win
solution.
Exploring ways to
modify or integrate the systems of the company and its suppliers or customers in order to realize win-win
solutions.
Have succeeded in implementing a win-win solution with supply chain partners, and actively provide proposals and support to partners to improve their systems and innovate the supply
chain.
Appendix 1.