Multivariate Regression Modeling of Parameters Affecting
Punching Force during Random Velour Needling
Hasan Mashroteh, PhD, Mohammad Zarrebini, PhD
Isfahan University of Technology, Textile Engineering, Isfahan, Isfahan IRAN
Correspondence to:
Mohammad Zarrebini email: [email protected]
ABSTRACT
Manufacturing of random velour needled fabrics comprises two separate needling operations. In the first stage a carded fibrous assembly is consolidated using a barbed needle. The consolidated assembly is opened-up due to action of fork needles of the second needling stage. In this special needling operation the mono-structure consolidated fibrous assembly is converted to a bi-structure fibrous assembly, comprised of base and pile layers. The extent of imparted structural changes influences physical and mechanical properties of the resultant random velour fabric. Fork needles which are the culprit of the structural alteration are subjected to relatively large forces. In this work the effect of random velour needling parameters and fiber characteristics on force exerted on the fork needle were investigated. Force measurement and data analysis were carried out using a purposely designed twin load cell force measuring unit and required software. Sixty four samples of polyester fabrics were prepared. Separate identification of the effect of principle independent parameters on the exerted force on individual fork needles was achieved using a linear multivariate regression analysis based on SAS 9.1 statistical software. Estimation of total average force (Frms) and
peak average force (FPA) were used as response
variables of the model. Results manifested that force exerted on the fork needle is profoundly affected by a large number of parameters. It was also found that, total fiber displacement "TFD", occurring during random-velour needling was the foremost factor directly influencing force on the fork needles.
Keywords: Needle-Punching; Fibrous assembly; Random-Velour; Fork Needle; Force; Regression
INTRODUCTION
Fibrous batts prepared by conventional carding and cross-lapping were consolidated by needle-felting process as shown in Figure 1, using barbed needles. The consolidated felted material was fed to a structuring needle loom as shown in Figure 2, where a velour-like surface effect was imparted to the
fibrous assembly. Following are the basic designed differences between these two contrasting needle looms:
- The conventional perforated bed-plate in the felting needle loom is replaced by a moveable and densely bristled brush conveyor in the random velour needle loom.
- Fork needles replace the barbed needles used in felting needle loom.
- The gripping action of the brush conveyor results in positive transit of the consolidated material through the needling zone of the random velour needle loom. - The use of the special fork needle results in disentanglement of the fibers and transfer of the fibers to the surface of the fibrous assembly. This is in total contrast to the action of the barbed needles which causes an increase in fiber entanglement of the fibrous assembly.
In random-velour needling, the structuring fork needle prior to penetration of the brush conveyor enters the positively held felted fibrous material. This is in contrast to conventional needle felting process, where barbed needles penetrate the loosely held fibrous assembly passing through the confinement formed by stripper and bed plates. The positive grip provided by the action of the brush results in stabilization of the transferred fibers by the fork needles. These fibers form the dense velour-like layer on the surface upon detachment of the fabric from the conveyor. The extent to which the fork needle enters the brush conveyor below the bristles tip is known as needle penetration depth. This can be altered by changing the vertical position of the brush conveyor.
fabrics. During structural changes fork needles are subjected to various forces which are ultimately transferred to ground through needle loom main structural components [1-3]. Thus, quantification of the forces from engineering design of fork needle and random velour loom is of vital importance. Therefore, in the present work, measurement of forces exerted on the individual fork needle during random-velour needling in relation to fibrous assembly characteristics and needling operations was carried out using a purposely designed force measuring system [4]. As far as general field of needle punching force measurement is concerned, all conducted research are limited to the effect of fiber and needle loom related parameters during the conventional needle-felting process using barbed needles. No study of exerted forces on fork needles has been reported.
FIGURE 1. Needle Felting Process.
FIGURE 2. Random Velour Needling Process.
Hearle et al in their pioneering work found that, increases in parameters such as the mass of the fibrous assembly, fiber coefficient of friction, and needle penetration depth, leads to corresponding increases in magnitude of the force exerted on barbed needles of a fully needled board, when measured statically. It was also reported that, in the case of a heavy fibrous assembly, an increase in needle penetration depth tends to reduce the needle penetration force. This is due to the occurrence of an excessive amount of fiber breakage during needling process [5]. It was confirmed that, dynamically measured needle punching force on single needles initially tended to increase with increases in the mass of the fibrous assembly and then decreases [6]. Goswami reported that, fiber fineness and crimp are the pivotal factors among parameters affecting the static force experienced by the needles of a fully needled board of the laboratory needle loom used in his work [7].
Sarin in his 1994 review of the pertaining published research reported that according to Luenenschloss's studies, total forces exerted on barbed needles of a fully needled board are directly proportional to stroke frequency of the needle board [8]. Seyam studies was concerned with the cumulative contributions of various factors such as needle vibration and inertia on the dynamically measured force experienced by individual barbed needles. Seyam was also successful in determining the location of the needle subjected to the highest force in relation to variations in fiber staple length and amount of punch density [9-13].
Cislo’s investigations show that, the quasi-static force on the barbed needle increases as both fineness and tensile strength of the fiber are increased [14]. Kapusta concluded that, at very high needling stroke frequency, the force experienced by the barbed needle decreases. This was considered to be due to excessive fiber breakage and process generated heat [15]. Watanabe showed that provided both needling and fiber related parameters are held invariant, the force exerted on the needle increases with increases in geometry of barb parameters [16].
FORCE MEASUREMENT SYSTEM
brush conveyor, needle dwell at the bottom dead center and characteristics of consolidated fibrous assembly to the punching force. Since this paper only deals with the effect of fiber and needling related parameters on punching force, only data acquired from one load cell is cumulatively analyzed. Precise needling stroke frequency is displaced due to the use of RVDT in the system. Data acquisition and analysis are carried out using a purposely designed MATLAB R2010a based Force Analysis Software or (FAS). The FAS capabilities includes output tarring within an arbitrary time span, variation of sampling start time and input of the calibration equation of the load cell in the software.
EXPERIMENTAL
It is well known that fiber characteristics together with needling adjustments, during both needle felting and random velour needling operations are pivotal as far as physical and mechanical behavior of random velour needled fabric is concerned. It was also anticipated that these parameters can affect the force exerted on the fork needle [17].
In this work, a total of sixty four different random-velour needled fabrics were prepared. In order to achieve the most comprehensive analysis, a large number of fiber and needling related independent variables (X1 to X9) as shown in Table I, were
defined. The selected independent variables lie in the range that covers end-uses such as automotive and contract flooring for random-velour material. Variables X1 to X3 denote fiber fineness, fiber mean
staple length, and fiber crimp frequency respectively. Variable X4 represents mass per unit area of initial
felted fibrous assembly. X5 and X6 denote barbed
needle penetration depth and punch density during needle-felting operation. The average of three measurements of total average force Frms and Peak
average force FPA, and manipulation of three
independent variables X7, X8 and X9 were selected to
denote dependent or respond variables Y1 and Y2. The
former three variables represent fork needle penetration depth, stroke frequency, and punch density during the random velour needling operation respectively. Total average force represents the root mean value of the squared discrete force signal of individual fork needles acquired during given stroke cycles. The peak average force is the absolute mean of averages of the recorded maximum and minimum magnitude of the downward and upward forces during given stroke cycles. In a two stage software operations, FAS initially averages the absolute maximum and minimum magnitudes of downward
and upward forces during a stroke cycle. In the second stage, the mean of the averages are expressed as parameter FPA. The variable values are shown in
Table II.
The magnitude of Frms of an individual needle is in
fact power of force signal of the particular needle. Provided Frms is considered to encompass all fork needles then, Frms can be regarded as needle loom energy consumption index. It is also believed that, FPA can be regarded as an index of force load bearing
capacity of the fork needles. Carded 25g/m2 polyester web was delivered to a horizontal cross-folding unit and fiber mean staple length for each experimental sample was calculated [18]. Cross-folded batt was fed to a conventional felting needle loom, equipped with GROZ-BECKERT 15*18*32*3 R333 G1002 barbed needles. Mass per unit area of each consolidated felted fibrous assemblies was determined. The felted materials were fed to a laboratory random-velour needle loom. This loom was equipped with GROZ-BECKERT 15*17*25*38*63.5 DG1000 structuring fork needles [19].
In order to predict the force exerted on the fork needles during random-velour needling, a statistical model based on SAS9.1 statistical software was used [20]. This model permits establishment of a quantitative relationship between the random-velour needling adjustments and fiber characteristics with the force exerted on the fork needle.
RESULTS AND DISCUSSION
Error mean values of almost zero, and constant variance uncorrelated are the characteristics of the developed model. Additionally errors have normal distribution and respond and regressors are linearly related. Considering fiber characteristics range and needling parameters, a randomized linear multi-factorial design of experiments capable of individual statistical analysis of response variables based on multivariate linear regression method was developed in the present work. The method quantitatively provides a simple description of the interaction between various properties of textile materials [21]. Linear equations provide estimates of dependent variables Frms and FPA. This allows separate
square error (MSE). The software eliminates insignificant variables and offers regression equations in terms of a reduced number of independent variables. The most distinctive equation among the offered regression equations based on the degree of significance, the highest values of R2 and
R2adj, the minimum value of MSE and the nearest
value of Cp to number of selected variables were
chosen. Following are the most distinctive regression equations analyzed in the present work as respond variables of Y1 and Y2.
TABLE I. Model Variables.
Prediction of Total Average Force (Frms)
Table III represents the first five regressions offered by the model. The optimal regressions are shown in the first row of the table. The number of independent variables is reduced to 7 due to elimination of X2 and
X6. The goodness of the fit for the model can be
assessed by R2 and R2adj, In comparison to the other
equations shown in the table, R2 and R2adj of the
selected equation are at their maximum value while MSE is at its minimum value. Therefore, R2=82.45% is confirmation of the ability of the model to count 82.45% of the variability in Y1.
The elimination of variables by the model improves model validity. This is confirmed by higher F Value in Table IV(b) in comparison to Table IV(a). In the latter table, initial analysis of variance (ANOVA) is carried out using all 9 independent variables. In the former table, identical analysis is carried out in the absent of variables X2 and X6. Therefore, Eq. (1) is
regarded as the final regression equation of respond variable "Frms" as predicted by the model based on
new ANOVA results.
Prediction of Peak Average Force (FPA)
The adopted statistical treatment for Y1 variable was
also followed for Y2 variable. The first five offered
regressions are shown in Table V. The model confirms the selection of all variables except eliminated insignificant variables X2 and X8. The
model is optimal due to the fact that goodness of the fit of the model is assessed by R2 and R2adj. R2 value
of 80.78% confirms that the model takes care of 80.78% of the variability in Y2.
The elimination of variables by the model improves model validity. This is confirmed by higher F Value in Table VI(b) in comparison to Table VI(a). In the latter table, all 9 independent variables are used in initial analysis of variance (ANOVA). In the former table identical analysis is carried out in the absent of variables X2 and X8. Thus, based on new ANOVA
analysis Eq. (2) is considered to be the final regression equation of respond variable "FPA", as
predicted by the model.
(2)
TABLE II. Variables Value (64 Experimental Samples).
Sample Code
1 11 121 4.5 320 7 50 8 231 100 75.44 106.09
2 11 125 4.5 321 7 50 8 463 200 97.43 120.38
3 11 128 4.5 322 7 100 8 581 300 119.69 173.89
4 11 120 4.5 335 7 125 8 696 400 121.75 145.03
5 11 129 4.5 330 9 50 10 347 200 132.51 143.69
6 11 122 4.5 333 9 75 10 233 300 108.42 136.87
7 11 129 4.5 322 9 100 10 461 100 131.77 190.11
8 11 128 4.5 334 9 125 10 579 400 151.51 208.32
9 11 126 4.5 324 11 50 12 697 300 178.92 205.18
10 11 123 4.5 332 11 75 12 463 400 150.57 261.42
11 11 124 4.5 330 11 100 12 231 100 93.3 159.24
12 11 120 4.5 318 11 125 12 582 200 147.71 217.15
13 11 128 4.5 336 13 50 12 346 400 126.92 219.71
14 11 129 4.5 319 13 75 12 462 200 136.16 215.56
15 11 120 4.5 327 13 100 14 581 100 146.71 238.8
16 11 125 4.5 329 13 125 14 695 300 173.95 324.92
17 13 90 2.3 550 7 50 8 230 100 134.13 200.19
18 13 95 2.3 540 7 75 8 462 200 148.68 142.8
19 13 87 2.3 545 7 100 8 578 300 152.34 174.95
20 13 93 2.3 548 7 125 8 691 400 164.03 173.3
21 13 92 2.3 550 9 50 10 346 200 134.5 276.36
22 13 97 2.3 554 9 75 10 231 300 120.43 242.26
23 13 93 2.3 541 9 100 10 461 100 143.9 199.87
24 13 90 2.3 549 9 125 10 693 400 164.61 228.98
25 13 85 2.3 552 11 50 12 699 300 177.92 394.58
26 13 88 2.3 564 11 75 12 462 400 147.96 347.12
27 13 92 2.3 561 11 100 12 231 100 137.47 329.4
28 13 89 2.3 538 11 125 12 585 200 165.76 248.36
29 13 96 2.3 562 13 50 12 346 400 136.33 370.31
30 13 89 2.3 547 13 75 12 463 200 149.88 269.07
31 13 91 2.3 549 13 100 14 579 100 155.58 284.97
32 13 90 2.3 559 13 125 14 695 300 208.1 357.31
33 9 124 2.7 425 7 50 8 230 100 134.42 156.72
34 9 129 2.7 420 7 75 8 462 200 143.64 140.91
35 9 127 2.7 422 7 100 8 576 300 155.45 156.51
36 9 125 2.7 430 7 125 8 695 400 166.56 280.34
37 9 126 2.7 438 9 50 10 346 200 135.74 280.65
38 9 129 2.7 440 9 75 10 233 300 129.15 329.49
39 9 127 2.7 429 9 100 10 461 100 139.28 212.07
40 9 121 2.7 438 9 125 10 579 400 196.23 343.97
41 9 120 2.7 428 11 50 12 696 300 197.91 392.95
42 9 122 2.7 441 11 75 12 462 400 189.5 378
43 9 124 2.7 442 11 100 12 231 100 148.51 260.91
44 9 123 2.7 434 11 125 12 581 200 169.43 307.22
45 9 125 2.7 445 13 50 12 346 400 145.33 362.76
46 9 127 2.7 427 13 75 12 462 200 153.63 266.38
47 9 126 2.7 424 13 100 14 580 100 165.08 264.02
48 9 129 2.7 430 13 125 14 695 300 192.48 369.77
49 9 71 4 640 7 50 8 230 100 106.1 183.19
50 9 73 4 650 7 75 8 462 200 133.4 224.19
51 9 75 4 647 7 100 8 576 300 159.57 179.63
52 9 72 4 652 7 125 8 695 400 162.79 247.74
53 9 74 4 642 9 50 10 346 200 134.55 215.99
54 9 75 4 652 9 75 10 233 300 124.98 340.55
55 9 76 4 637 9 100 10 461 100 138.11 195.56
56 9 78 4 647 9 125 10 579 400 191.41 374.87
57 9 79 4 636 11 50 12 696 300 177.82 339.64
58 9 77 4 645 11 75 12 462 400 184.27 370.81
59 9 75 4 644 11 100 12 231 100 132.41 280.96
60 9 78 4 637 11 125 12 581 200 184.82 296.01
61 9 76 4 662 13 50 12 346 400 137.82 338.69
62 9 78 4 641 13 75 12 462 200 145.71 283.84
63 9 79 4 649 13 100 14 579 100 172.16 289.23
64 9 75 4.05 650 13 125 14 695 300 183.51 377.02
X7 X8 X9 Y1 Y2
TABLE III. The First Five Offered Regressions for Respond Variable Y1.
No. of
Variables Adjusted In Model R-Square
7 6.4148 0.8245 0.8026 139.6757 X1 X3 X4 X5 X7 X8 X9
7 6.8154 0.8232 0.8011 140.70402 X1 X2 X3 X5 X7 X8 X9
6 7.9968 0.813 0.7933 146.25846 X2 X4 X5 X7 X8 X9
7 8.0678 0.8192 0.7966 143.91866 X2 X3 X4 X5 X7 X8 X9
8 8.1771 0.8253 0.7999 141.59403 X1 X2 X3 X4 X5 X7 X8 X9 C(p) R-Square MSE Model Variables
TABLE IV. Respond Variable Y1 ANOVA Results.
a) Nine Independent Variables
Sum of Mean
Squares Square
Model 9 36808 4089.73835 28.45 <.0001
Error 54 7762.21031 143.74464 Corrected
Total 63 44570
Analysis of Variance
Source DF F Value Pr > F
b) Seven Selected Independent Variables
Sum of Mean
Squares Square
Model 7 36748 5249.71656 37.59 <.0001
Error 56 7821.83947 139.6757 Corrected
Total 63 44570
Source DF F Value Pr > F Analysis of Variance
TABLE V. The First Five Offered Regressions for Respond Variable Y2.
No. of Variables In Model
C(p) R-Square Adjusted R-Square
MSE Model Variables
TABLE VI. Respond Variable Y2 ANOVA Results:
a) Nine Independent Variables
Analysis of Variance Source DF Sum of
Squares
Mean Square
F Value Pr > F
Model 9 325206 36134 25.92 <.0001 Error 54 75292 1394.30452
Corrected Total 63 400498
b) Seven Selected Independent Variables
Analysis of Variance Source DF Sum of
Squares
Mean Square
F Value Pr > F
Model 7 323876 46268 33.82 <.0001 Error 56 76622 1368.24822 Corrected Total 63 400498
The above two regression equations show that many fiber and machine parameters significantly affect the grand force exerted on fork needle during random velour needling. Fibers are displaced along the thickness of the felted fibrous assembly towards the pile top layer due to penetration of the fork needle. Thus, the original fiber orientation of the felted fibrous assembly is changed. The extent to which fiber reorientation occurs depends on total fiber displacement factor or TFD factor as is defined by Eq. (3).
A change in initial positions of fibers is generally regarded as fiber displacement. The previous research studies have reported that already displaced fibers are difficult to be further displaced by additional needling operation. This is due to the fact that fiber displacement is increased as the fibrous assembly travels through the needling zone. Comparison of magnitude of the exerted forces on the barbed needles located on the entrance and delivery sides of the needling zone revealed that, larger force is experienced by needle on the entry side than by those located on the delivery side [6, 7, 10 and 13].
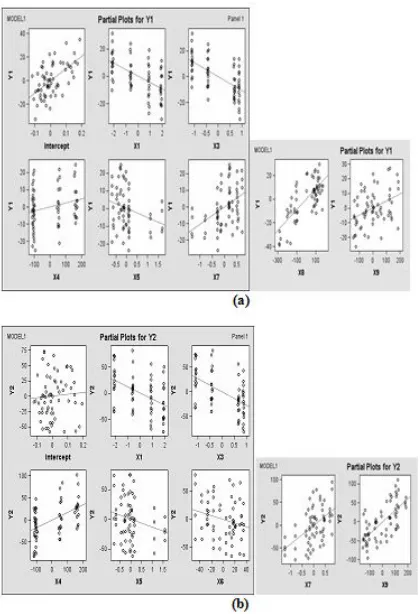
Thus, variation in magnitude of forces exerted on fork needle during random velour needling can similarly be analyzed in terms of total fiber displacement using Eq. (3). Partial representation of behavior of the selected variables is depicted in Figure 3a and Figure 3b.
(3)
When:
n1: Number of Displaced Fibers per Stroke per Unit Area of the Fibrous Assembly
n2: Stroke Frequency (s/min)
: Average Single Fiber DisplacementIt is known that the number of fibers loaded in the forked space of the needle is directly proportional to fiber fineness [22]. Therefore, reduction in fiber denier causes TFD factor to be increased. This in turn subjects the fork needle to greater force during penetration into the fibrous assembly. This is confirmed by partial representation of parameter (X1)
and two respond variables of Frms and FPA in Figure
3.
Regression models indicate that as far as respond variables are concerned, fiber staple length (X2) is not
an influential parameter. In contrast to fiber fineness, since fiber staple length has a subtle effect on TFD factor, variable (X2)is eliminated by the models.
The profound effect of fiber crimp (X3) on the
magnitude of the force exerted on the fork needle is vividly illustrated by partial plots of the regression models in Figure 3. This independent variable is also associated with Eq. (1) and Eq. (2). In spite of the above results, a conclusive explanation based on the present results in respect of the effect of fiber crimp on the force exerted on the fork needle cannot be offered. This is due to the existence of complicated interactions between crimp related factors such as frequency of crimps per fiber unit length, crimp geometry, coefficient of surface friction, and mechanical behavior of fibers on the induced
×
×
=
n
1n
2cohesion and fiber entanglement in the fibrous assembly and their combined effect on the TFD factor. It must be pointed out that, that the present work dealt only with the effect of fiber crimp frequency. Figure 3 shows that force exerted on fork needle is inversely proportional to fiber crimp. However, it was expected that, an increase in crimp frequency would result in subsequent increases in cohesion of the initial felted fibrous assembly and total fiber displacement. Thus, higher effort on part of fork needle is required if fibers are to be displaced.
Mass per unit area (X4) which is function of fiber
population per unit area is a pivotal parameter affecting physical and mechanical properties of nonwoven fabrics. Eq. (3) shows that the force exerted on the fork needle during random velour needling is increased as the direct consequence of higher TFD factor caused by increases in mass per unit area of the felted fibrous assembly. This is also depicted in relevant plots of models in Figure 3.
An increase in needle penetration depth during the needle felting operation using barbed needles reduces the thickness of felted fibrous assembly [23]. Thus, total fiber displacement during random velour needling operation of felted material with reduced thickness is decreased.
Therefore, the exerted force on the fork needle is reduced due to smaller value of TFD factor. This can be seen in (X5) plots of Y1 and Y2 respond variables
in Figure 3.
The punch density or (X6) independent variable
during needle felting operation using barbed needles is eliminated by regression model Frms. This
independent variable alters the extent of fiber entanglements without altering fibrous assembly thickness. This hardly changes total fibers displacement TFD during movement of the fork needle. Therefore, elimination of the variable as shown in Eq. (1) and Figure 3a by the model is conceivable. This is in contrast to Eq. (2), where the effect of (X6) variable is clearly shown. Jerk is
imposed on the fork needle during both fork needle entrance and withdrawal into and from felted fibrous assembly and brush conveyor. The jerk is influenced by the amount punch density. Therefore, magnitude of FPA variable can be considered to be mainly
dependent on the punch density.
The effect of other variables related to the random velour needling operation on the force exerted on the fork needle such as fork needle penetration depth (X7), needling stroke frequency (X8), and punch
density (X9) were also investigated. Average single
fiber displacement (
) which directly leads to proportional changes in TFD factor is increased as fork needle penetration depth (X7) is increased. Thisresults in a higher value of exerted force on the fork needles as can be observed in relevant plots of Figure 3.
The effect of fork needle vibration and inertia on the exerted force on the fork needle in relation to stroke frequency (X8) was investigated [4]. Thus, variable
(X8) is correctly considered as an effective parameter
by Frms in Eq. (1), which is also vindicated by
relevant plot of Figure 3a. Additionally fork needle vibration and inertia are limited by the contact of the needle with the felted fibrous assembly and brush conveyor [4]. The imposed limit on fork needle vibration and inertia and the fact that, magnitude of FPA respond variable changes as the fork needle
momentary comes into contact with felted fibrous assembly or brush conveyor, thus the effect of stroke frequency parameter (X8) on FPA exerted on the fork
needle is correctly ignored by Eq. (2).
As far as punch density or (X9) is concerned, it can be
stated that the former controls total fiber displacement. An increase in the amount of punch density results in higher value of TFD factor. This in turn results in excessive exertion of force on the fork needle during random-velour needling operation.
CONCLUSION
In this work a statistical model using linear multivariate regression analysis was developed. The model quantitatively relates the total average force (Frms) and peak average force (FPA) to fiber
characteristics and needling adjustments. The use of SAS 9.1 statistical software enabled the reporting of all possible regression equations in terms of statistical values of coefficient of multiple determination (R2), adjusted R2 (R2adj), Mallows's Cp (Cp) and mean
square error (MSE). The software eliminated insignificant variables and offered regression equations in terms of reduced number of independent variables. The most distinctive equation among the offered regression equations based on the degree of significance, that encompasses the highest values of R2 and R2adj, the minimum value of MSE and the
nearest value of Cp to number of variables, was
selected.
Results show that, many of the examined fiber and needling parameters significantly affected the grand force experienced by the fork needle. It was found that, variation in respond variables (Frms) and (FPA)
concluded that the extent of total fiber displacement or TFD, during the random velour needling operation directly affects exerted force on the fork needle. Partial analysis of the regression models reveal that, while fiber fineness directly affected the force on the fork needles, the effect of fiber crimp on exerted force on the fork needle cannot be conclusively determined. It was observed that, increases in mass per unit area of the felted fibrous assembly results in higher TFD factor. This in turn caused an increase in the magnitude of the exerted force on the fork needle. It was also found that, an increase in the barbed needle penetration depth during initial needle-felting operation tended to reduce the thickness of the felted fibrous assembly. The reduction in thickness of the material caused TFD during random-velour needling operation to be decreased, thus the force on the fork needle is reduced. Frms model eliminated the punch
density as an affecting variable during initial needle-felting operation due to subtle effect of this variable on total fiber displacement TFD during random-velour needling. However, this variable was found to be effective by FPA regression model.
FIGURE 3. Selected Variables of Regression Models Partial Plots. a) Frms Regression Model, b) FPA Regression Model.
The effect of fork needle penetration during random-velour needling was found to be distinctive in the both regression models. This was due to increase in average displacement of single fiber (
) and its subsequent increase in TFD factor. It was also concluded that, stroke frequency during random-velour needling pivotally influences fork needle vibration and inertia which ultimately affect Frmsvalue. However, this parameter was found to be not effective as far as FPA was concerned. It was
concluded that "TFD" factor which controls Frms and
FPA is directly affected by punch density. Thus punch
density was regarded as an influential variable affecting force exerted on the fork needle.
Finally it is expected that, the findings of the present work provide a better understanding of the intrinsic relationship between the initial needle felting and final random velour needling operations. These can assist manufacturers of this novel and extensively used technical fabric to improve the quality of their product under the most economical production condition as far as energy consumption is concerned.
REFERENCES
[1] Mrstina, V., Fejgl, F., "Needle Punching Textile Technology", Elsevier, ISBN 0 444 988041, New York, USA, 1990.
[2] Purdy, A.T., "Needle-Punching", The Textile Institute, ISBN 0 900739 32 0, Manchester, U.K., 1980.
[3] Tyas, T., "Needle-Felted Fabrics", (P. Lennox-Kerr, Ed.), Textile Trade Press, chapter1: The Design of Needle Looms, Manchester, U.K., 1972.
[4] Mashroteh, H., Zarrebini, M., "Analysis of Punching Force during Random-Velour Needling", Textile Res. J., 81(5), 2011, 471-481.
[5] Hearle, J.W.S., Sultan, M.A.I., "A study of needled fabrics: Part VI: The Measurement of Punching Force during Needling", J. Textile Inst., 59, 1968, 237-242.
[6] Hearle, J.W.S., Purdy, A.T., "A Technique for the Measurement of the Punching Force during Needle-Felting", J. Textile Inst., 63, 1972, 363-374.
[8] Sarin, S., Meng, J., Seyam, A.M., "Mechanics of Needle Punching Process and Products: Part I: Critical Review of Previous Work on Forces Experienced by Needles during Needling of Nonwoven Fabrics", Int. Nonwoven J., 6 (2), 1994, 32-36.
[9] Seyam, A.M., Meng, J., Mohamed, A., "Mechanics of Needle Punching Process and Products: Part II: An On-Line Device to Measure the Punching Forces Experienced by Individual Needles", Int. Nonwoven J., 7 (3), 1995, 31-37.
[10] Seyam, A.M., Sarin, S., "Effect of Needle Position and Orientation on Forces Experienced by Individual Needles during Needle Punching", Textile Res. J., 67, 1997, 772-776.
[11] Seyam, A.M., Mohamed, A., Kim, H., "Signal Analysis of Dynamic Forces Experienced by Individual Needles at High Speed Needle Punching", Textile Res. J., 68, 1998, 296-301. [12] Seyam, A.M., "Application of On-Line
Monitoring of Dynamic Forces Experienced by Needles during Formation of Needled Fabrics", Int. Nonwoven J., 8 (5), 1999, 55-60.
[13] Seyam, A.M., "Impact of Needling Parameters on the Locations of Maximum Needle Force due to Fiber Web / Needle Interaction", paper presented at the proceeding of Needlepunch Conference, The Association of the Nonwoven Fabrics Industry (INDA), Greenville; North Carolina (NC), USA, 2000. [14] Cislo, R., Kapusta, H., "Analysis of Forces
Transmitted by Needles in the Process of Web Needling in Quasi-Static Conditions", FIBERS & TEXTILES in Eastern Europe, 10, 2002, 76-80.
[15] Kapusta H., "Analysis of Values of Punching Forces in the Process of Web Needling in Dynamic Conditions", FIBERS & TEXTILES in Eastern Europe, 11, 2003, 28-32.
[16] Watanabe, A., Miwa, M., Yokoi, T., Merati, A.A., "Predicting the Penetrating Force and Number of Fibers Caught by a Needle Barb in Needle Punching", Textile Res. J., 74 (5), 2004, 417-425.
[17] Mashroteh, H., Zarrebini, M., Alimoradi, S., "Estimation of Properties of Random-Velour Polypropylene Needled fabrics Using Multivariate Regression Models", paper presented at the proceeding of the 4th ITC&DC, Zagreb, Croatia, 2008.
[18] Mashroteh, H, Zarrebini, M., "Effect of Carded Web Weight on Some Properties of Random-Velour Nonwoven Floor Coverings Using Polypropylene Fibers", paper presented at the Proceeding of the 6th Conference on Textile Engineering, Isfahan, Iran, 2007.
[19] GROZ-BECKERT, "Needles; General Catalogue", GROZ-BECKERT, Albstadt, Germany, 2009.
[20] Seber, G.A.F., "Multivariate Observation", John Willey & Sons, ISBN 0-471-88104-X, New York, New York (NY), USA, 1984. [21] Ureyen, M.E., Kadoglu, H., Regressional
Estimation of Ring Cotton Yarn Properties from HVI fiber Properties, Textile Res. J., 76(5), 2006, 360-366.
[22] Zarrebini, M., "Factors controlling the transfer of fibres in pattern needling", PhD thesis, University of Leeds, Leeds, UK, 1986. [23] Gardmark, L., Martensson, L., "An
Experimental Investigation of Fiber Orientation and Some Properties of Needled Felts", Textile Res. J., 36 (12), 1966, 1037-1042.
AUTHORS’ ADDRESSES Hasan Mashroteh, PhD Mohammad Zarrebini, PhD
Isfahan University of Technology Textile Engineering
Daneshgah Blvd.