Experimental Assessment of the Effect of
Distance on the Efficiency of a Renewable
Energy Conversion System
Oladeji Ifedayo. R
Electrical and Electronics Engineering Department Federal University of Technology, Akure (FUTA)
Nigeria.
Oyinlola Aminat. O
Electrical and Electronics Engineering Department Federal University of Technology, Akure (FUTA)
Nigeria.
wumgold @yahoo.com
Abstact-The global energy demand is on the
increase due to population growth and
advancements in industrial and consumer
technologies. In other to reduce the challenges of power systems in terms of stability limits and reliability specifications, the system of distributed generation (DG) must be advanced. Consequently, this research investigates the efficiency of a renewable energy conversion system-photovoltaic energy system. Using a combination of source intensity, source distance and tilt angle, the efficiencies of the system is evaluated. A modified TPS-3720 test bed with digital meters was used for this evaluation. This experiment presents a maximum efficiency of 28.1% for the PV system. Also the efficiencies of the system for the tilt angles and radiation distances were observed to follow a linear trend under input voltages of 12V, 15V and 18V. The improvement in the efficiency of PV systems at low cost has led to the use of spheral, semicrystalline and concentrated cells.
I.
I
NTRODUCTIONThe constant need for the demand of electrical energy to be met by available supply whilst considering greenhouse gas emissions and other environmental damage (global warming and pollution as a downsize of conventional energy sources has shifted attention towards green and renewable energy sources. Global energy consumption in the last half-century has increased very rapidly and is expected to continue to grow over the next 50 years. Statistics from the International Energy Agency (IEA) World Energy Outlook 2004 show that the total primary energy demand in the world increased from 5536 MTOE in 1971 to 10,345 MTOE in 2002, representing an average annual increase of 2%. Of the total primary energy demand in 2002, the fossil fuels accounted for about 80% with oil, coal and natural gas being 35.5%, 23%, and 21.2%, respectively
[12]. The energy demand forecast up to year 2030 is given in Fig1.
Fig 1 Energy Demand Forecast
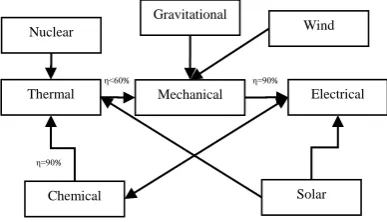
Shift of attention to green and renewable energy sources such as solar and wind energy systems have informed the need for an investigation on parameters that influence the efficiency of such systems. Fig2 shows the different energy carriers with their corresponding efficiencies [3]. This study will be investigating the effect of distance and radiation strength on the efficiency of a solar energy conversion system specifically the photovoltaic system.
Renewable energy occur in various forms which include wind, solar, hydro, geothermal (earth heat), and biomass (waste material). All renewable energy with the exception of tidal and geothermal power, and even the energy of fossil fuels, ultimately comes from the sun. About 1%–2% of energy coming from the sun is
Nuclear
Thermal
Chemical
Gravitational
Mechanical Electrical Wind
Solar
η=90%
η˂60% η=90%
Fig 2 Renewable and Non Renewable Energy Mapping Keywords: Energy conversion, Photovoltaic
Vol. 3 Issue 7, July - 2017
converted into wind energy [5]. Fig3 shows the flow paths of renewable energy
. Today, the most prevalent renewable energy resources are wind and solar.
Fig 3 Solar Energy Flow Path
Renewable energy systems are utilized in power systems through distributed generation (DG), storage technologies and micro grids systems. These systems of operation or generation of electric power is essential for reasons of decrease in fossil fuel resources, poor energy efficiency, environmental pollution issues, stability and reliability challenges and lastly economical reasons.
II.
THEORETICAL BACKGROUND
The principle of operation of a photovoltaic system in the conversion of the energy from the sun to electrical energy is as shown in Fig4.
Solar cells or photovoltaic cells as they are commonly known are mostly made up of high purity silicon which is a semiconductor. When sun rays falls on the photovoltaic cell, the silicon element absorbs solar energy (photon) which energizes the electron to a higher energy state. This excitation causes a movement of electrons to the n type side of the PN (positive –negative) junction formed as a potential barrier. This movement in form of kinetic energy causes voltage to rise at the junction [8]. The energy of a photon is expressed by;
𝐸 = ℎ𝑣 (1)
where h is the planck’s constant and v is the velocity of sun rays.
Absorption of a photon in a material implies its energy is used to excite an electron from an initial energy level 𝐸𝑖 to a higher energy level 𝐸 . Photons can also be
absorbed if electron energy levels 𝐸𝑖 and 𝐸𝑓 are present so that their difference equals the photon energy,
ℎ𝑣 = 𝐸𝑖− 𝐸𝑓 (2)
If an electron is excited from 𝐸𝑖 to 𝐸𝑓, a void is created at 𝐸𝑖. This void behaves like a particle with a positive elementary charge and is called a hole. The absorption of a photon therefore leads to the creation of an electron-hole pair. The radiative energy of the photon that is converted to chemical energy is limited by thermodynamics [4]. Photochemical conversion involves the process of photoexcitation and material charge separation. The separation of the ionized reactants by a double membrane imitating a perfect organic material is expressed by [10] as;
A + hv→ A* A* + B → A+ + B-
This molecular excitation as a result of ionization caused by photoexcitation produces sufficient energy to power connected load [8] and [6].
A. Related laws
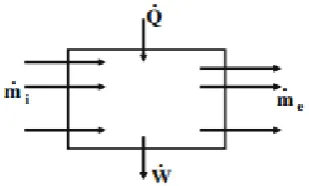
Generally, with energy conversion systems, energy can neither be created nor destroyed but converted as desired. However, the conversion process from one form to the other must obey fundamental laws. The system under investigation is an open thermodynamic one therefore must obey the first and second laws of thermodynamics. Fig5 shows an open system where the efficiency is determined by parameters outside the thermodynamic system.
Fig 5 Open Thermodynamic System
𝑄̇ and 𝑊̇ are the heat and work of the system respectively.
The conservation law in terms of rate of increase in mass is written as
𝑑𝑚
𝑑𝑡 = ∑ 𝑚̇𝑖 𝑖− ∑ 𝑚̇𝑒 𝑒 (3)
where i is the inlets and e is the exits of the system, 𝑚̇𝑖
and 𝑚̇𝑒 are the mass flow rate into the system and exiting the system [4]. However for an open thermodynamic system operating in the steady state, the mass Solar
Energy (photon)
Kinetic Energy
Chemical Energy
Electrical Energy
(DC)
conservation equation simplifies to the following expression;
𝑚̇𝑖= 𝑚̇𝑒 (4)
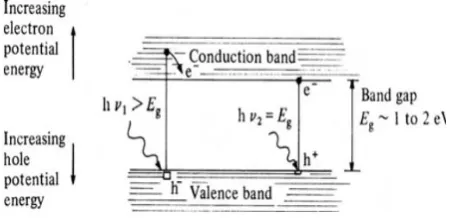
B. Physics of Solar Cell and Energy
Significant electrical energy can only be generated using two methods- the process of electromagnetism and photovoltaic cells. Photovoltaic generation of power is caused by electromagnetic radiation separating positive and negative charge carriers in absorbing material. The materials are usually a semiconductor junction. Fig6 shows the flow of energy between the conduction and valence bands of the P-N junction [7].
Fig 6 Semiconductor Band Structure
The width/gap between the conduction and the valence bands is determined by the expression in Equation 5.
𝑤 ≅ [2𝜀0𝜀𝑟𝑉𝐵
𝑒√(𝑛𝑝)]
1 2
(5)
where 𝜀0 is the permittivity of free space, 𝜀𝑟 is the relative permittivity of the material, 𝑉𝐵 is the electric potential difference and 𝑛 and 𝑝 are the electron and hole carrier densities respectively. Electrons and holes are generated when solar radiation hits a P-V cell e generated thermally or by light, and so become carriers in the material. Minority carriers, once in the built-in field of the depletion zone, are pulled across electrostatically down their respective potential gradients. Thus minority carriers that cross the zone become majority carriers in the adjacent. The passage of these carriers becomes the generation current Ig, which is predominantly controlled by temperature in a given junction without illumination. For a given material, the generation current Ig is given by Equation 6.
𝐼𝑔= e𝑁𝑖2(1 𝑝
𝐿𝑝
𝜏𝑝+
1 𝑛
𝐿𝑛
𝜏𝑛) (6)
where 𝑁𝑖 is the intrinsic carrier concentration, 𝐿𝑝 and 𝐿𝑛 are the diffusion lengths of the holes and electron
minority carries respectively, 𝜏𝑝 and 𝜏𝑛 are the holes and electrons recombination times [7].
C. PV Systems and Cell Efficiency
The technology for photovoltaic systems utilizes the knowledge and application of the physics of
semiconductor elements. Steady but slow
advancements have been made since the discovery of generation of electricity through the process of solar energy conversion. The main objectives amongst several others are to reduce the production price of the solar panel so as to increase its application penetration and also to improve its efficiency. The major advantages of generation of electric energy using photovoltaic systems include;
i. Short lead time to design, install and start up a new plant
ii. High modularity, hence plant economy is not dependent on size
iii. Easy peak load match with power output iv. It is stationary i.e no moving parts, hence no
noise
v. High mobility and portability because of light weight.
The progressive effort to produce more efficient solar panel at low cost has led to various types of solar PV technology discussed which includes Single Crystalline Silicon, Polycrystalline and Semicrystalline, Thin Films, Amorphous Silicon, Spheral, Concentrated Cells [9].
The performance of a PV system is measured in terms of its efficiency. The efficiency of a solar cell radiant-to-electrical energy conversion is the ratio of the power delivered and the equivalent incident energy. The system efficiency however is dependent on several variables which include the tilt angle of the incident energy, the distance between the incident energy and the PV system and environmental conditions. Equation 7 gives the relation for the evaluation of the system.
𝜂 =𝐸𝑙𝑒𝑐𝑡𝑟𝑖𝑐𝑎𝑙 𝑒𝑛𝑒𝑟𝑔𝑦 𝑜𝑢𝑡𝑝𝑢𝑡 𝑓𝑟𝑜𝑚 𝑡ℎ𝑒 𝑠𝑦𝑠𝑡𝑒𝑚
𝑅𝑎𝑑𝑎𝑡𝑖𝑜𝑛 𝐸𝑛𝑒𝑟𝑔𝑦 𝑖𝑛𝑡𝑜 𝑡ℎ𝑒 𝑠𝑦𝑠𝑡𝑒𝑚 = 𝑄
𝑃_𝑟 (7)
The maximum efficiency 𝜂𝑚𝑎𝑥 as described by [10] of a PV system beyond which any further increase in the parameters (source intensity and distance) will result in a system of diminishing returns is expressed by
𝜂𝑚𝑎𝑥=
𝑄𝑚𝑎𝑥
𝑟_𝑖 (8)
where 𝑄𝑚𝑎𝑥 is the maximum power output and 𝑟_𝑖 is the incident radiation flux.
Vol. 3 Issue 7, July - 2017
This research investigates the parameters influencing the efficiency of a photovoltaic system. The clear sky model provides a relation to evaluate the attenuation of the solar radiation due to dust air pollution, water vapour clouds and turbidity as given by Equation 8.
𝐺𝐵_0= 𝐴𝑒𝑠𝑖𝑛𝛼−𝐾 (9)
where 𝐺𝐵_0 is the solar radiation reaching the earth at normal angle zero degree, 𝛼 is the altitude inclination angle. A is an apparent extraterrestrial flux, K is a dimensionless factor called optical depth. All parameters are expressed as a function of day numbers, N [11].
𝐴 = 1160 + 75𝑠𝑖𝑛[0.9863(𝑁 − 275)] (10a)
𝐾 = 0.174 + 0.035𝑠𝑖𝑛[0.9863(𝑁 − 100)] (10b)
However, when there exits an angle between the solar radiation and the collector, the total solar radiation reaching the inclined surface is given as;
𝐺𝐵𝑇_𝛼= 𝐺𝐵_0𝑅𝐵+ 𝐺𝐷𝑅𝐷+ 𝐺𝑅𝜌𝑅𝑅 (11)
where 𝐺𝐷is the diffused radiation and 𝐺𝑅 is the solar radiation on an inclined surface.
The coefficients 𝑅𝐵, 𝑅𝐷 and 𝑅𝑅 are fundamental in evaluating the solar energy components on an inclined surface.
𝑅𝐵=cos(𝐿−𝛽)𝑐𝑜𝑠𝛿𝑠𝑖𝑛𝜔𝑠𝑠+𝜔𝑠𝑠sin(𝐿−𝛽)𝑠𝑖𝑛𝛿
𝑐𝑜𝑠𝐿𝑐𝑜𝑠𝛿𝑠𝑖𝑛𝜔𝑠𝑠+𝜔𝑠𝑠𝑠𝑖𝑛𝐿𝑠𝑖𝑛𝛿 (12)
𝑅𝑅=1−𝑐𝑜𝑠𝛽
2 (13)
Several models exist for the evaluation of 𝑅𝐷 which includes the isotopic and anisotropic models. The anisotropic model for 𝑅𝐷 is given by [11] as;
𝑅𝐷=𝐺𝐵
𝐺𝑇𝑅𝐷+ [1 −
𝐺𝐵
𝐺𝑇] [
1+𝑐𝑜𝑠𝛽
2 ] (14)
where 𝑅𝐵 is the ratio of solar energy on a normal surface to inclined surface, 𝑅𝐷 is the ratio of diffuse solar energy on normal surface to inclined surface and 𝑅𝑅 is the factor of reflected solar energy on an inclined surface. ρ is ground Aledo, L is the latitude of the location, δ is the angle of declination and 𝜔𝑠𝑠 is the sunset hour.
III.
EXPERIMENTAL SETUP/FRAMEWORK
The experimental procedure of evaluation of the efficiency of the PV energy conversion system is shown in the block diagram given in Fig7. The highlighted section depicts the area under study. The setup consists majorly of input, output, transducer and measuring
parameters used in the evaluation of the performance of the PV system setup.
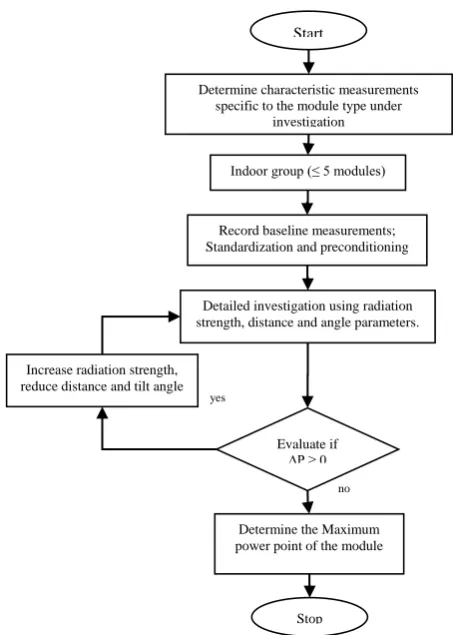
The flowchart to determine the maximum power, 𝑃𝑚𝑎𝑥 under standard testing condition (STC) is given in Fig8. The difference in the output power of the solar module is given by the relation in Equation 15.
∆𝑃 = 𝑃𝑘− 𝑃𝑗 (15)
𝐾 = 𝑗 + 1
where 𝑃𝑗 and 𝑃𝑘are the powers delivered in jth and kth experimental steps respectively.
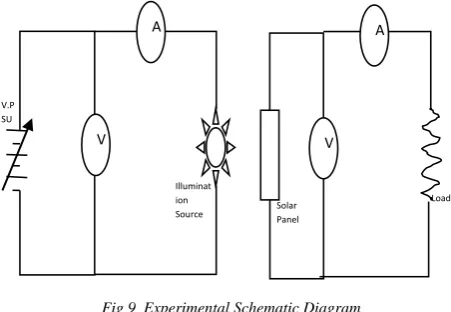
Figure9 shows the schematic diagram of the experimental setup of the system under study. A simple
Start
Determine characteristic measurements specific to the module type under
investigation
Indoor group (≤ 5 modules)
Record baseline measurements; Standardization and preconditioning
Determine the Maximum power point of the module
Stop Evaluate if
∆P ≥ 0
Detailed investigation using radiation strength, distance and angle parameters.
no yes
Increase radiation strength, reduce distance and tilt angle
Electrical Energy source/input
Transducer:Ele ctrical Energy –Light Energy
Transducer:Light Energy – Electrical Energy
Electrical Energy output/load
Ammeter, Voltmeter
Ammeter, Voltmeter Lux meter,
Photon meter
Fig 7 Experimental Procedure
resistive load is chosen for the experiment because of its linear I-V characteristics. The radiation recorded from the lamp is dependent on the supply voltage from the power supply. Within the normal range of input voltage variations the illumination output from the lamp will change by about 3.5% for a 1% change of input voltage.
Figure 10 shows the experimental setup model using Simulink on MATLAB 2013b.
Fig 10 Simulink Model of Photovoltaic Energy Conversion System
The solar panel block consists of several in-built solar cells arranged in arrays to yield the desired physical PV panel specifications. To obtain the I-V and P-V characteristics, the load is changed to a variable resistor.
Table 1 shows the ranges, types and specifications of the laboratory equipments used for the experiment. The rating of the load is proportional to the wattage of the solar panel.
Table 1 Components and Equipment Specifications
Equiment/Compo nent
Specifications/T ype
Rating/Ran ge
Quanti ty
Voltmeter Digital Voltmeter 0-50V DC 2
Ammeter Digital Ammeter 0-10mA DC 2
Lamp DC 35W,12V 1
Solar Panel Monocrystalline 3W, 6V 1
PSU Variable 0-35V DC 1
Load Resistive,
Variable
1.2kΩ 1
The components connection is shown in the setup shown in Fig11. The enclosed test bed for the experiment is the TPS-3720. The system is modified to include the load and measuring devices. The experiment was performed under ambient conditions of temperature and humidity.
Fig 9 Experimental Setup
The enclosures for the electric lamp and the general set up are needed to direct and focus the energy from the lamp and also to minimize energy conversion losses.
IV.
RESULTS AND DISCUSSIONS
The results of experimental investigation of the effect of radiant energy source distance from the transducer in a PV energy conversion system are presented in Figures 12 to 16. The efficiency and behaviour of the solar panel was evaluated using several distance/tilt angle/input voltage combinations.
Fig 10 System Efficiency at 6V Input Voltage
At constant input power of 10.44mW, the peak efficiency experienced occurred at 0o and 5o at 90mm to the solar panel. The response of the system with input voltage of 6V is best for 25o tilt angle with an accuracy of 95%.
2 4 6 8 10 12 14
0,000 0,005 0,010 0,015 0,020 0,025 0,030 0,035 0,040 0,045 0,050
90 110 130 150 170 190
Im
u
t
Pow
e
r
(m
W)
Eff
ic
ie
n
cy
,
η
Distance (mm)
Eff0 Eff5 Eff10
Eff15 Eff20 Eff25
Pi Linear (Eff25)
V A
V A
V.P SU
Illuminat ion
Source Solar Panel
Load
Vol. 3 Issue 7, July - 2017
Fig 11 System Efficiency at 9V Input Voltage
Analyses of the result shown in Fig13 shows that there exits some disparities in the behaviour of the system for distances of 90mm to 140mm while the input power is constant at 19.44mW.
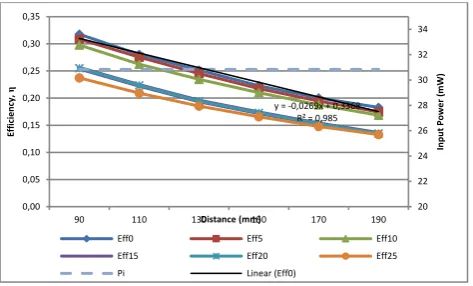
Fig 12 System Efficiency at 12V Input Voltage
Figure14 shows that the efficiency of the set up is minimum for tilt angles 20 and 25 degrees at 30.84mW input power. A mean difference of 0.0652mW was recorded for the system for 12V input voltage.
Fig 13 System Efficiency at 15V Input Voltage
Fig 14 System Efficiency at 18V Input Voltage
The result of investigation of the characteristics of the PV energy conversion system in Figures 15 and 16 shows that the efficiencies at 15V and 18V input voltages at different tilt angle scenarios follow a common linear trend described by Equation 16. A linear mismatch of 0.003 and 0.009 are experienced for the system under 20o and 10o tilt angles for the 15V and 18V input voltages respectively.
𝑎 = −0.011𝑏 + 0.238 (16)
Fig15 Output Voltage Vs Maximum Efficiency
Figure 17 shows the plots of the output voltage and system efficiency against the radiation distance independently. The maximum efficiency of 28.1 % was obtained from an input voltage of 12V from the solar cell. In addition, it is shown from the experiment that the efficiency and output voltage of a PV energy conversion system increases nearly linearly with the source radiation intensity.
V.
CONCLUSIONS
The need for renewable energy sources cannot be overemphasized. Generation of electric energy from the sun using solar cells is one of the most viable and promising methods of implementing an efficient and reliable energy conversion system. From the analysis of 0 5 10 15 20 25 0,00 0,05 0,10 0,15 0,20 0,25 0,30 0,35
90 110 130 150 170 190
In p u t Pow e r ( m W0 Eff ic ie n cy , η Distance (mm)
Eff0 Eff5 Eff10
Eff15 Eff20 Eff25
Pi
y = -0,0269x + 0,3368 R² = 0,985
20 22 24 26 28 30 32 34 0,00 0,05 0,10 0,15 0,20 0,25 0,30 0,35
90 110 130 150 170 190
In p u t Pow e r ( m W) Eff ic ie n cy , η Distance (mm)
Eff0 Eff5 Eff10
Eff15 Eff20 Eff25
Pi Linear (Eff0)
25 30 35 40 45 50 55 0,00 0,05 0,10 0,15 0,20 0,25 0,30
90 110 130 150 170 190
In p u t Pow e r ( m W) Eff ic ie n cy , η Distance (mm)
Eff0 Eff5 Eff10
Eff15 Eff20 Eff25
Pi Linear (Eff20)
30 35 40 45 50 55 60 65 70 75 80 0,00 0,05 0,10 0,15 0,20 0,25 0,30
90 110 130 150 170 190
Ib p u t Pow e r ( m W0 Eff ic ie n cy , η Distance (mm)
Eff0 Eff5 Eff10
Eff15 Eff20 Eff25
Pi Linear (Eff10)
0,00 0,05 0,10 0,15 0,20 0,25 0,30 0,0 0,5 1,0 1,5 2,0 2,5 3,0 3,5 4,0
0 5 10 15 20
Ef fi ci e n cy (η ) O u tp u t Vol tag e (V)
Input Voltage (V)
the result obtained through this experiment, it can be concluded that the efficiency of the photovoltaic energy conversion system lies between 25%-35%. Furthermore, the efficiency of a PV system is contingent on the source distance to impact, the angle of inclination and lastly the radiation energy source. The maximum efficiency beyond which these parameters would no lo longer improve the performance of the PV system is also assessed. Lastly, the efficiency of the system can be improved by maintaining the tilt angle at approximately 0o at all times through the use of solar tracking control mechanism and also the use of highly conductive semiconductor material with minority carriers and lesser width between the conduction and the valence bands.
VI.
REFERENCES
[1] Ann-Marie, B., & Kreider, J. F. (2001). Distributed Generation- The Power for the New Millenium. New York: CRC Press.
[2] Archie, W. C. (1991). Principles of Energy Conversion. New York: McGraw-Hill Inc.
[3] Arno, S., Klaus, J., Olindo, I., Rene, V. S., & Zeman, M. (2016). Solar Energy; The Physics and Engineering of Photovoltaic Conversion Technologies and Systems. Cambridge: IUT Cambridge Ltd.
[4] Efstathios, E. S. (2012). Alternative Energy Sources-Green Energy and Technology. Berlin: Springer.
[5] Gonen, T. (2012). Electrical Machines with MAtlab. London: CRC Press.
[6] John, S. C. (1981). Photochemical Conversion and Storage of Solar Energy. New York: Academic Press.
[7] John, T., & Tony, W. (2006). Renewable Energy Resources. New York: Taylor & Francis.
[8] Mary, D. A., & Arthur, J. N. (2008). Nanostructured and Photoelectrochemical Systems for Solar Photon Conversion. Cambridge: Imperial College Press.
[9] Mukund, R. P. (2000). Wind and Solar Power Systems. London: CRC Press .
[10] Sorenson, B. (June 2007). Renewable Energy Conversion, Transmission and Storage. New York: Gilleleje.
[11] Tamer, K., & Elmenreich, W. (2016). Modeling of Photovoltaic Systems Using Matlab-Simplified Green Codes. New Jersey: Wiley.