R E G U L A R A R T I C L E
Open Access
Gendered behavior as a disadvantage in
open source software development
Balazs Vedres
1*and Orsolya Vasarhelyi
2*Correspondence:
[email protected] 1Oxford Internet Institute, University of Oxford, Oxford, United Kingdom Full list of author information is available at the end of the article
Abstract
Women are severely marginalized in software development, especially in open source. In this article we argue that disadvantage is more due to gendered behavior than to categorical discrimination: women are at a disadvantage because of what they do, rather than because of who they are. Using data on entire careers of users from GitHub.com, we develop a measure to capture the gendered pattern of behavior: We use a random forest prediction of being female (as opposed to being male) by behavioral choices in the level of activity, specialization in programming languages, and choice of partners. We test differences in success and survival along both categorical gender and the gendered pattern of behavior. We find that 84.5% of women’s disadvantage (compared to men) in success and 34.8% of their
disadvantage in survival are due to the female pattern of their behavior. Men are also disadvantaged along their interquartile range of the female pattern of their behavior, and users who don’t reveal their gender suffer an even more drastic disadvantage in survival probability. Moreover, we do not see evidence for any reduction of these inequalities in time. Our findings are robust to noise in gender recognition, and to taking into account particular programming languages, or decision tree classes of gendered behavior. Our results suggest that fighting categorical gender
discrimination will have a limited impact on gender inequalities in open source software development, and that gender hiding is not a viable strategy for women.
Keywords: Gender inequality; Gendered behavior; Software development; Open
source
1 Introduction
Women suffer a considerable disadvantage in information technology: their proportion in the workforce is decreasing, and they are especially underrepresented in open source soft-ware development. The proportion of women in computing occupations has been steadily declining from 36% in 1991 to 25% today [1–3]. In open source software only about 5% of the developers are women [4], and they exit their computing occupation careers with higher probability. Women suffer from a gender wage gap in STEM—and especially in computer programming—more so than in other fields [5]: that has not decreased over the past two decades [6]. Many women quit their computing occupation careers in the middle [7]. These developments are puzzling, especially in the face of a favorable shift in public consciousness, and considerable private and public policy efforts to counter gender discrimination. With accumulating evidence of the benefits of gender diversity in teams
against women [11]; however, as much of the scholarship in gender studies had shown, to understand gender inequalities one needs to shift the focus to the gendered pattern of behavior [12,13]: The more likely causes of discrimination are actions that are typical of men and women, rather than the gender category of the person [13–15]. Women in leadership roles often feel compelled to (or are expected to) follow male behavioral traits [16], just as men in feminine occupations take on female-like behavioral traits [17], and the choice of collaborators and mentors often follows gender homophily [18].
While categorical gender discrimination is an easy target for policies, discrimination based on behavioral expectations are more difficult to counter. Recently Google was sued by women for categorizing women as ‘front-end’ developers without reason, blocking their access to higher pay and faster promotion that ‘back-end’ developers enjoy, who are more likely to be male [19,20]. This also underscores that when we analyze the gendered pat-tern of behavior, we should not assume that such behavior is a result of free choice. In fact, the history of computing occupations is also a history of marginalizing women from an increasing number of specializations [21]. Thus far there have been no analysis based on large data in a contemporary setting, to analyze behavioral traces, and to assess the relative weight of categorical and behavioral gender in gender inequality. Our data source is GitHub: the most popular online open source software project management system, which provides an opportunity to track the behavior of software developers directly, iden-tify gender from user names, and observe success and survival [22,23]. In open source software development the most important payoff to participants is reputation [24], hence we operationalize success as the number of users declaring interest in one’s work by “star-ring” a repository. As a second dependent variable we analyze differences in the odds of sustaining open source development activity over a one year period subsequent to our data collection time window.
Using data about behavior in a large sample allows us to construct a measure of female-ness of observed behavioral choices over the entire career, as a measure of gender typical-ity. This approach has a long history, using survey data [12,25,26], and more recently with behavioral trace data in diverse settings [27–29]. In addition to the interval scale gendered behavioral dimension, we also identify multiple kinds of gendered behavioral patterns us-ing a decision tree classification approach, and we assess the relative explanatory power of one behavioral dimension when controlling for multiple patterns of behavior.
We first compare men and women: users who display a recognizable gender on their profile, but we also analyze data of users with unidentifiable gender. The first question is whether gendered behavior makes any difference at all, or is it only the gender category, that relates to female disadvantage. If gendered behavior is related to outcomes, is that relationship the same for both women and men? Are there signs of change in patterns of gendered disadvantage?
face-to-face settings [30–32]. Our first question here is whether we see evidence for surround-ing users recognizsurround-ing the gender from the behavior of focal users that are hidsurround-ing their categorical gender. Our second question is whether success and survival for unknown-gender users are related to their unknown-gendered behavior as well.
2 Empirical setting and data
2.1 GitHub
Github (github.com) is a social coding platform that allows software engineers to develop and publish software together, recording their contributions to a collaborative activity. It is the most popular web-based ‘git’ software repository hosting and version tracking service, with 20 million users and over 57 million private and public repositories in May, 2018. Working in repositories collaboratively can lead to success through visibility and reputation, which helps developers to be noticed by potential employers [22,24,33]. We used coding and collaboration activity to conceptualize individual careers.
The empirical basis of this study is a data set acquired via githubarchive.org between 2009-02-19 and 2016-10-21 about the following: creation of a repository, push to a repos-itory, opening, closing and merging a pull request. To collect information about users’ names, e-mail addresses, number of followers, number of public repositories and the date they joined GitHub, we sent calls to the official Github users API.
2.2 Inferring gender
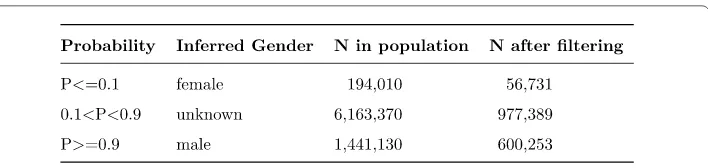
Since users do not list their gender directly, we infer each person’s gender using their first names. This is a commonly and successfully used method in Western societies [27,34]. In this work, we rely on the 2016 US baby name dataset published by the US Social Security Administration annually (SSA 2016). Users’ first names for gender recognition come from a number of data points. Users can add their full names and e-mail addresses to their profiles, but only a nickname is required to use GitHub. We first check whether a user’s full name is available and separate its first and last name(s). If not, we check the availability of the e-mail address and separate the part before the “@” by various punctuation marks or capital letters, and save first and we then last name(s). Since in some countries such as Japan or Hungary the given name is the second or the third name, if our baby name database does not contain the inferred first name, we ran the algorithm on last name(s) as well. Baby names dataset mainly covers American and European names, and lacks Asian names. In Asia, it is a common tradition to choose Western given names and use them in real and online life [35–37] thus if no full name or e-mail data is available or not inferable we use the user’s nickname as the name for gender recognition.See Fig.1for population size.
2.3 Accuracy of gender inference
Figure 1Inferring name for gender recognition. Due to some names being used for both males and females, we assign a probability of being male to each candidate based on the fraction of times their first name was assigned to a male baby in the name dataset. We define gender probability cutoffs of 0.1 and 0.9 consistent with previous studies [38]. Our gender recognition yielded 11.87% females and 88.13% males out of all users with names. All in all we found 194,010 females, 1,441,130 males, and 6,163,370 unknowns
Figure 2Comparing gender inferring algorithms. Accuracy of our gender inference against a baseline and two alternative methods. Precision (a) measures for each category how many categorized items are relevant, and recall (b) captures how many relevant items are selected from all good ones, F score (c) takes the harmonic average of precision and recall, reaches 1 when both metrics are perfect
There were 73 cases (12.2%), where the opinion of us, two manual coders differed. We re-checked these cases, and came to a consensus about each. To quantify our inter-rater reliability, we used Krippendorff ’s alpha [39]; a commonly used statistic of agreement. Considering three gender categories—female, male, and unknown—the alpha was 0.80. Considering female and male users only, the alpha was 0.95. Both of these are convention-ally considered to be good reliability.
40 users profiles had been deleted over the past two years, so our final tally is 300 males, 156 females and 104 unknowns. Using this consensus classification as our baseline, we compared our gender inference method, and two other well-known algorithms trained for inferring gender in online communities; Gender Computer by Valiescu [22] and Simple Gender by Ford [40]. Figure2shows the Precision, Recall and F Score of each algorithm by gender.
suf-ficiently accurate in comparison to other already published methods, while it has the ad-vantage of being simple and easy to implement.
2.4 Data cleaning
We decided to filter users by their level of activity, as there are many users who establish a GitHub account with hardly any subsequent developer engagement (but use GitHub, for example, as a web hosting platform). First we excluded organizational and company accounts, then selected those 1,634,373 users in our data set with at least 10 traces of ac-tivity over their careers. Then we deleted 1604 users for evidence of being artificial agents (having a substring, like “bot”, “test”, “daemon”, “svn2github”, “gitter-badger” in their user-names). As we were interested in patterns of gendered behavior (for which we encountered resource and time intensive data crawling challenges regarding pages of connected users), we took a biased sample with 10,000 users of each gender groups (men, women, unknown gender). We repeated the sampling procedure five times, to test for robustness to sampling error. We crawled the profile pages of all sampled users, and collected who they follow, and whom they are followed by. Gender of followers and followed users were identifies with the same approach outlined above.
3 Measures
3.1 Identifying specializations
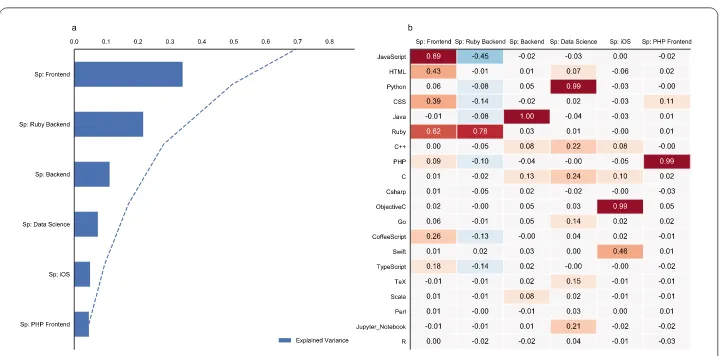
To capture the specialization of activity, we used principal component analysis of pro-gramming languages, where variables represented the number of times a given program-ming language was used by the individual. For each repository, GitHub auto-detects the main language. In total, we extracted 103 different programming languages, and kept those which appeared at least in 1000 projects within our samples, resulting in 22 most commonly used ones. Fig. 3 shows the language frequency. We used Scipy’s PCA.decomposiation package with Varimax Rotation to identify independent factors [41]. We ran the PCA analysis on each sample, than used the least square criteria to extract the factors and compare them.
3.2 Femaleness
The main variables of interest in our article is the gendered pattern of behavior, which we operationalize as the probability of being female given behavior. Several studies had adopted a similar approach of using an empirical typicality measure as an explanatory vari-able, in a wide range of empirical problems, from the phonological typicality of words [42] to the typicality of music [43], careers [44], businesses [45], or restaurants [46]. Typicality has been used to investigate gender as well [27,47]. We selected variables that capture the most relevant aspects of behavior in open source software development. We use variables that represent choices reasonably under the control of the individual.
Figure 3Identifying specializations. Our method captured the same 6 factors in each sample. The correlation matrix shows the “importance” and the sign of the relationship of the language in the component. We identified 6 main specializations; (1) Frontend development (JavaScript, HTML, CSS, Ruby), (2) Developers using Ruby for backend development (strong positive Ruby and quite negative JavaScript), (3) Backend Development with high activity in Java, (4) Data Science (Python, Jupyter Notebook, R, C++), (5) iOS development (Objective C, Swift) and (6) PHP enthusiastic with Frontend focus (PHP, CSS)
being female). The size of our dataset allows us to setk= 10, which is a commonly used value in applied machine learning [48,49].
The Random Forest classification was moderately accurate—behavior in open source is not drastically different by gender. The area under the ROC curve was 0.71, which was con-sistent across five samples, and decreased to no less than 0.67 with 5% and 10% swapped gender. Variable importance scores were also robust to gender classification error. See S5 and S6. This is a moderate classification performance, which is weaker than classic in-struments devised to measure gendered behavior [26] (AUC for inkblots test = 0.94, for combined test = 0.96), but similar to the performance of gender classifiers based on inter-net messaging [28] (AUC = 0.72), graphic design works [27] (AUC = 0.72), or biometric gender prediction based on screen swiping [29] (AUC = 0.71).
Figure 4Variable importance. Variable importance in gendered behavior prediction by the Random Forest Prediction and Female univariate Odds Ratios in predicting gender with logistic regression
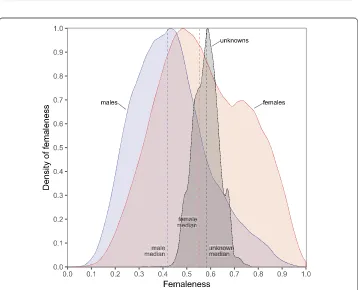
Figure 5The probability density of femaleness for males, females, and unknown gender. Males have a median femaleness of 0.42, females 0.55, and the highest is unknown gender, with a median femaleness of 0.58. This indicates that users who do not reveal their gender are either females, or males with a decidedly female-like behavioral profile. Users with unknown gender also show the narrowest range of femaleness (0.32 to 0.76; compared to males: 0.07 to 0.96; and females: 0.06 to 0.99)
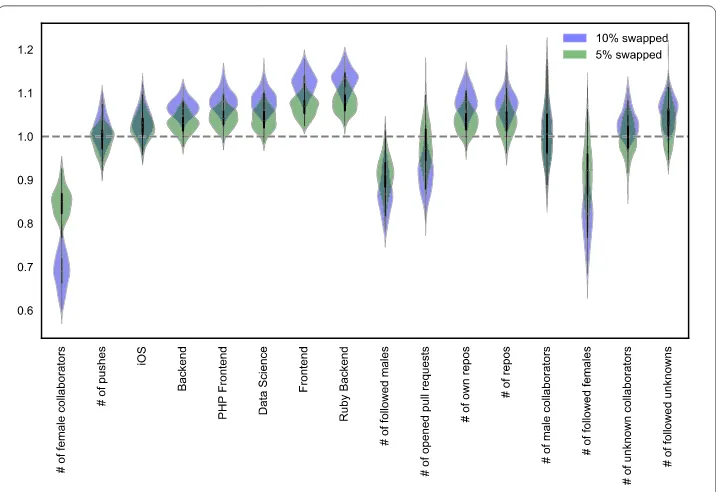
Figure 6Relative variable importance after randomization, normalized by original importance (n= 100). Random Forest prediction with 100 datasets where 5% gender swapped AUC’s mean is 0.672 (SE:0.002), and 10% mean: 0.651 (SE:0.003). Variables indicate female-gender homophily, number of female collaborators and the number of followed females and males are the most sensitive to gender swapping
their gender swapped. This amount of error is in the range of mis-classification that we saw comparing our method to the baseline (7.5% of users with known gender was mis-identified by our method). We created 100 mis-classified datasets for each randomization type. Variable importance in the Random Forest prediction was robust to swaps of gender, Fig.6shows original variable importance (dashed grey line) compared with the distribu-tion of new variable importance calculated on gender-swapped datasets.
3.3 Classes of gendered behavior
With our gender typicality measure we assume that the gendered nature of behavior varies along one continuous dimension. This assumption has been challenged before [50,51], so we test whether multiple categories of gendered behavior is a more adequate approach. To accomplish this we identify multiple classes of femaleness with a decision tree prediction approach. We then include a set of binary indicator variables representing decision tree classes, with the most gender-balanced class being the reference category in our models for success and survival. We also identify a range of classes, from 5 to 100, to test the robustness of our findings to the resolution of the classification tree.See section Models.
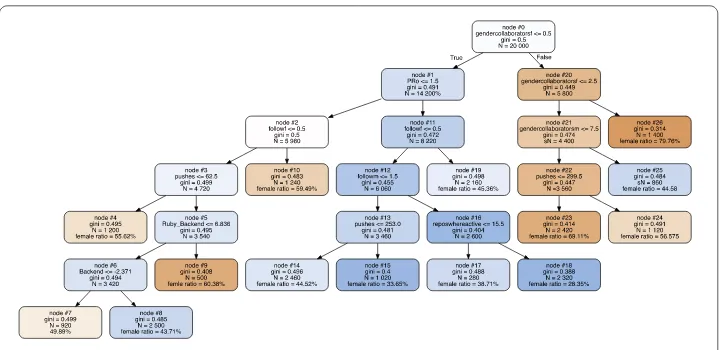
Our Decision Tree classifier is based on the same variables we calculatedfemaleness. Figure7shows the final tree with classes of typical gendered constellations of behavioral variables.
Figure 7Decision Tree model for gendered constellations of behavioral variables. Our final tree (minimum samples split = 1000, max depth = 10, test size = 0.6) resulted with a 0.6327 AUC and 14 classes
4 Models
Our dependent variables are success and survival. Our success measure is the total num-ber of times other users have starred (bookmarked as useful) repositories owned by our focal user, during the entire career. A star is a statement of usefulness: interest from an-other user to easily locate and to utilize the given repository in the future. Since success and our behavioral variables co-evolve during the career, causal arguments can not be tested. We measured survival by re-visiting all users’ pages exactly one year after the end of our data collection, and recording the number of actions taken by the user over this one year. If a user did not make any actions on the site for one year, we recorded exit for that user; otherwise we marked the user as survivor. Users seldomly close their accounts (0.3% of users), since keeping an account is free. In the case of survival we can test causal hypotheses, as behavior precedes cessation.
Our measure of success is an over-dispersed count variable, thus we use a negative bi-nomial model specification. Moreover, we also know that many users of GitHub are not interested in accumulating stars for repositories, but use the platform for other purposes (e.g. as a personal archive); in other words users are a mixture of two latent classes: one interested in achieving success, and one without such interest. We therefore estimated a zero-inflated negative binomial model (ZINB), where we separately modeled excess zeros with a logit model, and the accumulation of stars with a negative binomial model. We also tested the robustness of our findings with an OLS model with the log of success as the dependent variable, and a specification identical to the count model of our zero inflated negative binomial models.
logit(πi) =γ0+γgxgi+γbxbi+γgb(xgixbi) +γnxni+γgn(xgixni) +γcxci, (2)
log(λi) =β0+βgxgi+βbxbi+βgb(xgixbi) +βnxni+βgn(xgixni) +βcxci. (3)
As an auxiliary test for the presence of discrimination by categorical gender, we added a variable that records the relative frequency of the first name of the user (relative to the total number of users of the same gender)—an approach recently taken to measure dis-crimination in patenting [52]. If discrimination is by categorical gender, we expect women to be significantly disadvantaged in proportion to the frequency (easy recognizability) of their names. We expect that women with names like “Mary” (the most common female name) are more disadvantaged than women with names like “Maddie” (one of the least common female names). We thus includexnas the normalized logged relative frequency of first name within gender:xngi=logNfig/max(xn), wherefiis the overall frequency of the first name of useri, andNgis the overall number of users of genderg.
Finally,xcistands for control variables. Our control variables represent alternative expla-nations connecting gender and outcomes: Tenure (number of years since joining) might fa-vor men, as women tend to have shorter tenure (and drop out). The level of activity (num-ber of own repositories and num(num-ber of repositories where the user contributed) might also favor men, as women usually have less time to devote to professional activities. Social ties (number of followers and collaborators) might also favor men, as gender homophily is expected. Finally, we measure the total number of potential bookmarkers as the num-ber of developers who worked with the same programming languages as our focal subject. A developer with a large potential audience might gather stars more easily for his or her repositories.
We estimate a logit model for survival with an identical specification to the success model (4), whereγi= 1 for users with sustained activity over one year after data collec-tion, andγi= 0 for cessation. The independent variables are defined in the same way as described above.
ln P(γi= 1|x) 1 –P(γi= 1|x)
=β0+βgxgi+βbxbi+βgb(xgixbi)
+βnxni+βgn(xgixni) +βcxci. (4)
5 Results
5.1 Femaleness and outcomes
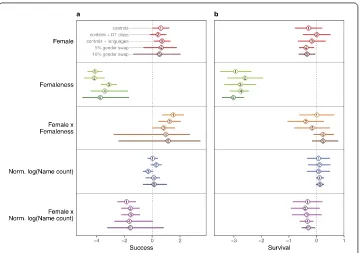
Figure 8Point estimates, with 95 percent CIs, for variables related to gender (variables are listed on the vertical axis). Panel (a) shows coefficients from count models of zero-inflated negative binomial models predicting success (the number of stars received), while panel (b) shows log odds ratios from logit models predicting survival over a one year period following our data collection. Labels of five specifications (identical for success and survival models) are shown in the legend. The first model enters gender variables and controls, the second enters controls and categorical gender behavior classes from the decision tree analysis, the third enters controls and 23 variables recording programming language use. The fourth is identical to the first, but with data with 5 percent gender swaps, and the fifth is with 10 percent gender swaps. For the fourth and fifth models confidence intervals show the 2.5–97.5 inter-quantile range from 100 simulated datasets
survived one year after our data collection, while only 88.2% of women (odds ratio = 0.575, Chi-squared = 126.1).
The femaleness of the pattern of behavior is significantly negatively related to success, using both at-test (t= –5.337), and a ZINB model (zero inflation modelz= 23.947; count modelz= –12.365). Femaleness is also negatively related to survival (bivariate logit model
z= –9.875).
Turning to multivariate models, Fig.8shows point estimates of expected success and ex-pected probability of survival for gender-related variables from five model specifications. All variables are measured on the 0–1 scale, making estimates comparable. In our full models—ZINB models for successSI 1. in Additional file1and logit models for survival
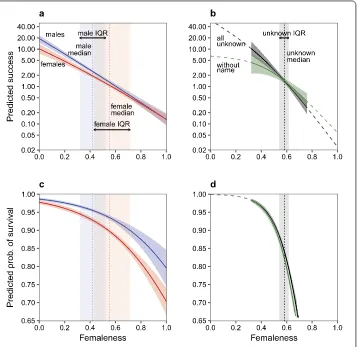
Figure 9Marginal predictions for femaleness by gender category from model 1 from Fig.8of success and survival, with fixing all other variables at their means. Panels (a) and (c) uses data for males and females, panels (b) and (d) uses data of users with unknown gender. Prediction is only shown for the observed range of femaleness. Vertical dashed lines indicate medians of femaleness, and shaded vertical bars show the interquartile range (IQR)
confidence intervals from 100 trials. Of the five models, only models 4 and 5 (with 5% and 10% randomly swapped gender) show significant disadvantage for females in survival. Our findings for success were robust with an OLS specification predictinglog(success + 1) as well(SI. 2.).
While categorical gender is not a consistently significant predictor of outcomes, the fe-maleness of behavior is in all models for both success and survival. Fefe-maleness of behavior is a strong negative predictor of both success and survival, and it is the only coefficient re-lated to gender that is consistently and significantly different from zero. Figure9shows predictions for success and survival along the range of femaleness, keeping all other vari-ables constant at their means. The difference between females (red line) and males (blue line) is small compared to the difference along the range of femaleness.
in femaleness. In other words, only 15.4% of the expected female disadvantage in success is due to categorical gender, and 84.5% is due to femaleness of behavior. Considering the same decomposition for probability of survival (Fig.9panel (c)), we see a smaller disad-vantage for women: 6.1% points, of which 4.0% points is doe to categorical gender, and 2.1% due to differences in femaleness (34.8% of the expected disadvantage in survival).
Males are also disadvantaged by their gendered behavior. Considering the interquartile range of femaleness, the expected success of males at the first quartile of femaleness (0.32) is 4.16 stars, while the same expectation at the third quartile (0.52) is only 1.51 stars, which is 63.7% less. For females the predicted success at the first quartile of femaleness (0.43) is 1.84 stars, while at the third quartile (0.72) it is only 0.51 stars—a difference of 72.2%. For survival the same inter-quartile disadvantage for males is 2.7%, for females it is 8.8%.
The coefficient of the interaction between female gender and femaleness is positive for success, but not significantly different from zero for survival (considering model 1). This indicates that the penalty for femaleness is higher for males overall than for females. (The female disadvantage over the interquartile range is nevertheless higher than males because of the wider spread of femaleness for females.)
Using the frequency of first name shows some evidence of discrimination in success, but not in survival. The interaction of being female and having a frequent name is negative, while the coefficient for name frequency itself is not significant, indicating that it is only women, who suffer a disadvantage if their name is more common, and thus their gender is easier to recognize. The prediction for a woman with the rarest name is 2.74 stars, while the prediction for a woman with the commonest name is only 0.95 stars—a 65.5% lower success.
Figure9also shows predicted outcomes for users with unknown gender. To predict out-comes for unknowns, we use a specification identical to model 1, without variables for categorical gender and name frequency(see SI 4.). Again, our findings about success were robust with an OLS specification predictinglog(success + 1)(see SI 2.). As apparent on Fig.9panel (b) and (d), the femaleness disadvantage is also demonstrable for those who do not reveal their gender. At the first quartile of femaleness (0.54) the expected number of stars is 1.99, while at the third quartile (0.62) it is only 1.03 stars—a 48.0% drop. The disadvantage for survival is even more severe: a reduction of 10.4% across the interquartile range (compared to 2.7% for males, and 8.8% for females). These results are robust if we restrict our analysis to those users who do not reveal any name, and omit those who do reveal a name that was not listed in the US baby name dataset.
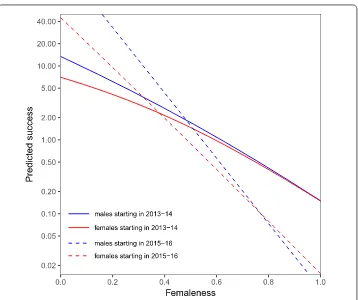
Do we see evidence for change in femaleness-based disadvantage? Are there signs for a decreasing salience of femaleness in predicting success? To answer this, we split our sam-ple by tenure, showing separate predictions for those starting in 2013-14, and in 2015-16. Figure10is a version of Fig.9panel (a), now split to earlier and later recruits. For a decreas-ing disadvantage we expect to see the dashed lines (drawn for the more recent cohort) to be closer to horizontal, than the solid line drawn for the earlier cohort. Unfortunately we see evidence for the contrary: disadvantage by femaleness of behavior is increasing.
5.2 Classes of gendered behavior and outcomes
Figure 10 Marginal predictions from zero-inflated negative binomial model (model 1) of success, for femaleness by gender category, separately for those who started in 2013–14, and those who started in 2015–16. As a simple analysis of a time trend, we introduced a variable capturing those who started in the years of 2015 and 2016 (as opposed to starting in 2013 or 2014), and entered interactions for this time variable with categorical and behavioral gender into our model of success(SI 9). We do not see evidence for a mitigating trend in the effect of behavioral gender, in fact, it seems that inequalities in success along the behavioral gender dimension have become more severe
(specifically model 2 on Fig.8) we entered 14 decision tree classes of gendered behavior alongside the continuous dimension (omitting the most gender balanced as reference cat-egory), and found that the coefficient of the continuous dimension remains unchanged. This indicates that classes of gendered behavior do not add qualitatively different insights into how behavioral disadvantage operates. Now we test this idea further, by estimating models of success and survival by substituting the continuous dimension of femaleness by the classes of gendered behavior.
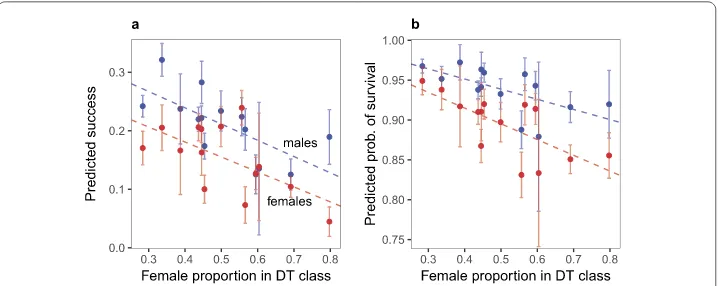
Figure 11 Marginal predictions of success and survival in classes of gendered behavior. Predicted means and 95 percent CI for 14 classes of gendered behavior are marked separately for males (blue) and females (red). Classes are aligned by the female proportion in the decision tree class. Dashed lines show OLS predictions for the predicted class means by the female proportion of the class, separately for males (blue line) and females (red line). Panel (a) shows OLS predictions of log(success+ 1) as the dependent variable. Panel (b) shows predicted probabilities from a logit model
To test the significance of this downward trend, we ran multilevel models, where we entered the class level female proportion instead of the dummies of behavioral class. We specified these models otherwise the same way as model 1 on Fig.8. We found that the female proportion in the decision tree class is a significant negative predictor for both success and survival, and that the difference between the intercepts and slopes of males and females is not significant. This finding holds with a range of decision tree class res-olutions, from 5 to 100.SI 8. SI 9.This suggests that gender segregation operates along emergent types of activities, regardless of the level of detail. It is chiefly the female quality of these classes of activities that relates with outcomes, and one dimension of femaleness is adequate to capture that.
6 Discussion
We found that gendered behavior is a significant source of disadvantage in open source software development: our models show negative coefficients for femaleness, and only weak support for categorical discrimination. Femaleness of behavior is not only a disad-vantage for women: men and users with unidentifiable gender are just as disaddisad-vantaged along this dimension. Even of we consider classes of gendered behavior with as many as 100 different decision tree classes, outcomes are chiefly related to the female proportion in those classes, both for men and women. This is an important finding, as thus far the rela-tive importance of categorical and behavioral gender have not been studied in the context of software development, and gender segregation was only studied at the level of profes-sions.
from their decision making, but they can perpetuate discrimination based on behavioral typicality, as a recent case at Amazon’s AI-aided hiring have shown [53]. It will be difficult to hold such algorithms accountable, as the particular behavioral specializations figur-ing in gendered behavior can be shiftfigur-ing constantly. Today activist target the front end– back end dichotomy at Google [19,20], but tomorrow they might need to target D3 and Hadoop.
We should re-think the place of coding schools for women that are becoming widespread. These schools are typically training women in specialties that already have a number of women working in them (such as Ruby), and thus might perpetuate the disad-vantage of women by their femaleness of behavior [54]. Another unintended consequence of these schools is that they contribute to gender homophily by creating more women-to-women ties among the participants.
Users, and especially women, should re-think the potential benefits of hiding their gen-der online. It seems that the inequalities stemming from gengen-dered behavior impact those just as much who hide their gender. A hidden gender identity can prevent discrimination by categorical gender, but it might also lead to a lack of trust and exclusion from projects, that might be behind the higher exit rate of such users. Comparing our calculation of the marginal effects of behavioral gender for users with unknown gender and women with known (manifest) gender shows that there is no advantage for gender hiding, the effect of categorical discrimination can not be escaped from by hiding.
While we were discussing gendered behavior, it is important to distinguish gendered be-havior from gendered free choice. We were composing our measure of gendered bebe-havior out of variables that could be controlled by the individual, but we don’t want to leave the impression that these traits are fully under the control of the individual. It is likely that the reasons behind the high (and increasing) negative slope of femaleness of behavior is due to constrained choice and deep-rooted stereotypes, rather than free choice. Women are being boxed into specializations even despite their manifest protest against it, as the legal case against the front end–back end distinction have shown. What is hopeful though, is that there is already a recognition that action needs to be targeted at discrimination by specializations.
Additional material
Additional file 1:Supplementary information (PDF 161 kB)
Acknowledgements
Funding
This research was supported by the “Intellectual Themes Initiative” of Central European University, 2016-18.
Abbreviations
ZINB, Zero-inflated negative binomial model.
Availability of data and materials
The datasets used and analyzed during the current study are available from the corresponding author (B.V.) on request.
Competing interests
The authors declare that they have no competing interests.
Authors’ contributions
BV and OV designed research, performed research, analyzed data, and wrote the paper. All authors read and approved the final manuscript.
Author details
1Oxford Internet Institute, University of Oxford, Oxford, United Kingdom.2Department of Network and Data Science,
Central European University, Budapest, Hungary.
Publisher’s Note
Springer Nature remains neutral with regard to jurisdictional claims in published maps and institutional affiliations.
Received: 4 December 2018 Accepted: 18 June 2019 References
1. United States Census Bureau (2011) Women’s Employment in Science, Tech, Engineering and Math Jobs Slowing. Available at:https://www.census.gov/newsroom/press-releases/2013/cb13-162.html[Accessed September 4, 2018] 2. United States Department of Labor. Women’s Bureau (WB)—Computer and Information Technology Occupations
[Accessed September 4, 2018]
3. Beckhusen J (2016) Occupations in Information Technology. Available at
https://www.census.gov/content/dam/Census/library/publications/2016/acs/acs-35.pdf[Accessed September 4, 2018]
4. Robles G, Reina LA, Gonzalez-Barahona JM, Dominguez SD (2016) Women in free/libre/open source software: the situation in the 2010s. In: IFIP International Conference on Open Source Systems. Springer, Berlin, pp 163–173. https://doi.org/10.1007/978-3-319-39225-7-13
5. Blau FD, Kahn LM (2017) The gender wage gap: extent, trends, and explanations. J Econ Lit 55(3):789–865. https://doi.org/10.1257/jel.20160995
6. Michelmore K, Sassler S (2016) Explaining the gender wage gap in STEM: does field sex composition matter? RSF: the Russell sage foundation. J Soc Sci 2(4):194.https://doi.org/10.7758/rsf.2016.2.4.07
7. Ashcraft C, Mclain B, Eger E (2016) Women in Tech: the Facts 2016 Update. Available at
https://www.ncwit.org/sites/default/files/resources/womenintech_facts_fullreport_05132016.pdf[Accessed September 4, 2018]
8. Powell K (2018) These labs are remarkably diverse—here’s why they’re winning at science. Nature 558(7708):19–22. https://doi.org/10.1038/d41586-018-05316-5
9. Bear JB, Woolley AW (2011) The role of gender in team collaboration and performance. ISR Interdiscip Sci Rev 36(2):146–153.https://doi.org/10.1179/030801811X13013181961473
10. Nielsen MW, Alegria S, Börjeson L, Etzkowitz H, Falk-Krzesinski HJ, Joshi A, Leahey E, Smith-Doerr L, Woolley AW, Schiebinger L (2017) Opinion: gender diversity leads to better science. Proc Natl Acad Sci 114(8):1740–1742. https://doi.org/10.1073/pnas.1700616114
11. Hacker HM (1951) Women as a minority group. Soc Forces 30(1):60–69.https://doi.org/10.2307/2571742 12. Udry JR (1994) The nature of gender. Demography 31(4):561.https://doi.org/10.2307/2061790
13. West C, Fenstermaker S (1995) Doing difference. Gend Soc 9(1):8–37.https://doi.org/10.1177/089124395009001002 14. Lemons MA, Parzinger M (2007) Gender schemas: a cognitive explanation of discrimination of women in technology.
J Bus Psychol 22(1):91–98.https://doi.org/10.1007/s10869-007-9050-0
15. Rosenbloom JL, Ash RA, Dupont B, Coder L (2008) Why are there so few women in information technology? Assessing the role of personality in career choices. J Econ Psychol 29(4):543–554.https://doi.org/10.1016/J.JOEP.2007.09.005 16. Wajcman J (1998) Managing like a man: women and men in corporate management. Pennsylvania State University
Press, University Park
17. Cross S, Bagilhole B (2002) Girls’ jobs for the boys? Men, masculinity and non-traditional occupations. Gend Work Organ 9(2):204–226.https://doi.org/10.1111/1468-0432.00156
18. Lutter M (2015) Do women suffer from network closure? The moderating effect of social capital on gender inequality in a project-based labor market, 1929 of 2010. Am Sociol Rev 80(2):329–358.
https://doi.org/10.1177/0003122414568788
19. McEwen M (2017) Is Frontend Web Development Sexist? Available at
https://medium.com/@melissamcewen/is-frontend-development-sexist-220040c952b1[Accessed September 4, 2018]
20. Google pay discrimination case: judge dismisses women’s class action | Technology | The Guardian (2017) Available athttps://www.theguardian.com/technology/2017/dec/06/google-women-pay-discrimination-lawsuit[Accessed September 4, 2018]
https://doi.org/10.1016/S0048-7333(03)00051-9
25. Udry JR (2000) Biological limits of gender construction. Am Sociol Rev 65(3):443.https://doi.org/10.2307/2657466 26. Terman LM, Miles CC (1936) Sex and personality, 1st edn. McGraw-Hill Book Company, New York
27. Wachs J, Hannak A, Voros A, Daróczy BZ (2017) Why do men get more attention? Exploring factors behind success in an online design community. In: 11th international conference on web and social media, ICWSM 2017. AAAI Press, Montreal, pp 299–308.http://eprints.sztaki.hu/9326/
28. Rosenfeld A, Sina S, Sarne D, Avidov O, Kraus S (2018) A Study of WhatsApp Usage Patterns and Prediction Models without Message Content. Comp Res Repos 02
29. Miguel-Hurtado O, Stevenage SV, Bevan C, Guest R (2016) Predicting sex as a soft-biometrics from device interaction swipe gestures. Pattern Recognit Lett 79:44–51.https://doi.org/10.1016/j.patrec.2016.04.024
30. Turkle S (1995) Life on the screen: identity in the age of the Internet. Simon & Schuster, New York 31. Wajcman J (2004) TechnoFeminism. Polity
32. Reagans R (2002) Network structure and knowledge transfer: the effects of cohesion and range bill McEvily. Adm Sci Q 48(2):240–267
33. Coffman KB (2014) Evidence on self-stereotyping and the contribution of ideas. Q J Econ 129(4):1625–1660. https://doi.org/10.1093/qje/qju023
34. Karimi F, Wagner C, Lemmerich F, Jadidi M, Strohmaier M (2016) Inferring gender from names on the web: a comparative evaluation of gender detection methods. In: Proceedings of the 25th international conference companion on world wide web—WWW ’16 companion, pp 53–54.https://doi.org/10.1145/2872518.2889385 35. Tiwsakul RA, Hackley C (2012) Postmodern paradoxes in Thai-Asian consumer identity. J Bus Res.
https://doi.org/10.1016/j.jbusres.2011.02.027
36. Smith LE (1998) English is an Asian language. Asian Engl 1(1):172–174. https://doi.org/10.1080/13488678.1998.10801003
37. Chen LNH (2015) Choices and patterns of English names among Taiwanese students. Names. https://doi.org/10.1179/0027773815Z.000000000122
38. Vasilescu B, Serebrenik A, Filkov V (2015) A data set for social diversity studies of GitHub teams. In: 2015 IEEE/ACM 12th working conference on mining software repositories. pp 514–517
39. Computing Krippendorff’s Alpha-Reliability (2011) Available athttps://repository.upenn.edu/asc_papers/43 [Accessed: March 29, 2019]
40. Ford D, Harkins A, Parnin C (2017) Someone like me: how does peer parity influence participation of women on stack overflow? In: Proceedings of the IEEE symposium on visual languages and human-centric computing (VL/HCC). VL/HCC ’17, pp 239–243.https://doi.org/10.1109/VLHCC.2017.8103473
41. Pedregosa F, Varoquaux G, Gramfort A, Michel V, Thirion B, Grisel O, Blondel M, Prettenhofer P, Weiss R, Dubourg V, Vanderplas J, Passos A, Cournapeau D, Brucher M, Perrot M, Duchesnay E (2011) Scikit-learn: machine learning in python. J Mach Learn Res 12:2825–2830
42. Farmer TA, Christiansen MH, Monaghan P (2006) Phonological typicality influences on-line sentence comprehension. Proc Natl Acad Sci USA 103(32):12203–12208.https://doi.org/10.1073/pnas.0602173103
43. Askin N, Mauskapf M (2017) What makes popular culture popular? Product features and optimal differentiation in music. Am Sociol Rev 82(5):910–944.https://doi.org/10.1177/0003122417728662
44. Kleinbaum AM (2012) Organizational misfits and the origins of brokerage in intrafirm networks. Adm Sci Q 57(3):407–452.https://doi.org/10.1177/0001839212461141
45. Zuckerman EW (1999) The categorical imperative: securities analysts and the illegitimacy discount. Am J Sociol 104(5):1398–1438.https://doi.org/10.1086/210178
46. Kovács B, Johnson R (2014) Contrasting alternative explanations for the consequences of category spanning: a study of restaurant reviews and menus in San Francisco. Strateg Organ 12(1):7–37.
https://doi.org/10.1177/1476127013502465
47. Scott IM, Clark AP, Josephson SC, Boyette AH, Cuthill IC, Fried RL, Gibson MA, Hewlett BS, Jamieson M, Jankowiak W, Honey PL, Huang Z, Liebert MA, Purzycki BG, Shaver JH, Snodgrass JJ, Sosis R, Sugiyama LS, Swami V, Yu DW, Zhao Y, Penton-Voak IS (2014) Human preferences for sexually dimorphic faces may be evolutionarily novel. Proc Natl Acad Sci 111(40):14388–14393.https://doi.org/10.1073/pnas.1409643111
48. James G, Witten D, Hastie T, Tibshirani R (2013) An introduction to statistical learning: with applications in R, 1st edn. Springer, New York
49. Kuhn M, Johnson K (2013) Applied predictive modeling, 1st edn. Springer, New York
50. Constantinople A (1973) Masculinity-femininity: an exception to a famous dictum? Psychol Bull 80:389–407. 51. Hoffman RM (2001) The measurement of masculinity and femininity: historical perspective and implications for
counseling. J Couns Dev 79(4):88–101.https://doi.org/10.1002/j.1556-6676.2001.tb01995.x
52. Jensen K, Kovács B, Sorenson O (2018) Gender differences in obtaining and maintaining patent rights. Nat Biotechnol 36(4):307–309.https://doi.org/10.1038/nbt.4120
53. Dastin J (2018) Amazon scraps secret AI recruiting tool that showed bias against women. Available at
https://www.reuters.com/article/us-amazon-com-jobs-automation-insight/amazon-scraps-secret-ai-recruiting-too-that-showed-bias-against-women-idUSKCN1MK08G[Accessed: November 30, 2018]
54. Posner M (2017) We can teach women to code, but that just creates another problem. Available at