R E S E A R C H
Open Access
Performance analysis of concurrent
workflows
Andreas Kempa-Liehr
1,2,3Correspondence:
[email protected] 1Freiburg Materials Research Center, University of Freiburg, Stefan-Meier-Straße 21, 79104 Freiburg im Breisgau, Germany 2EnBW Energie
Baden-Württemberg AG, Durlacher Allee 93, 76131 Karlsruhe, Germany Full list of author information is available at the end of the article
Abstract
Automated workflows are the key concept of big data pipelines in science, engineering and enterprise applications. The performance analysis of automated workflows is an important topic of the continuous improvement process and the foundation of designing new workflows. This paper introduces the concept of process evolution functions and event reduction policies, which allow for the time resolved visualization of an unlimited number of concurrent workflows by means of aggregated task views. The visualization allows for an intuitive approach to the performance analysis of concurrent workflows. The theoretical foundation of this approach is applicable for workflows represented by directed acyclic graphs. It is explained on the basis of a simple IO-workflow model, which is typically found for distributed resource management systems utilized for many-task computing.
AMS subject classification: 68Mxx
Keywords: Big data pipeline; High performance computing; Complex event processing; Communicating sequential processes; Continuous improvement process
Introduction
Big data pipelines build on automated workflows which are executed in massively par-allel applications. In order to improve the performance of automated workflows the respective systems and workflows have to be monitored [1, 2]. In general it has to be distinguished between the monitoring of continuously changing states of a distributed system, e.g. server load and bandwidth [3–5] and the monitoring of events [6, 7] indicat-ing the progress of a specific workflow or even a group of concurrent workflows. In this context the classical monitoring approaches are combined with elements from complex event processing [8–10] in which the progress of a workflow is captured as an ordered set of events, the so-called trace or lifeline [11–13]. Applications comprise the identifi-cation of wait states in large scale simulations [14], the analysis of for-loops [15], or the visualization of execution and wait times in distributed systems [16].
Background and literature review
We observe that the performance analysis of workflows is either designed for a small number of workflows and delivers a detailed view on their timing and their dependencies applying the concept of task views, or it is considered on a very high level due to the shear number of concurrent tasks. In the latter case the available information is aggregated
to time series documenting the number of pending and finished tasks, which is crucial for the scalability of event based monitoring [17–20] and deriving scheduling strategies [21, 22].
In this paper we present a generic approach to the analysis of workflow performance by introducing aggregated task views, which are capable of analyzing both needs: Detailed information on the progress of concurrent workflows and scalability to a large, respec-tively very large number of concurrent workflows. While the application of aggregated task views to IO-workflows has been introduced in the course of a poster presentation at the International Supercomputing Conference 2010 [23], this paper discusses the the-oretical foundation of aggregated task views on basis of process evolution functions and their policy-based aggregation.
However, the theoretical foundation of process evolution functions is not trivial, there-fore we are following the ansatz of C. A. R. Hoare for introducing communicating sequential processes [24] and start with grossly oversimplified examples which are suc-cessively extended to more complex problems. Thus showing the universal applicability of analyzing the performance of automated workflows by means of aggregated task views. For this purpose we have chosen an example from the so-called capacity computing or many-task computing (MTC), which denotes high-performance computations compris-ing multiple distinct activities, coupled via file system operations or message passcompris-ing [25]. These remote computations are often used for preparing high-performance computing (HPC) simulations considered as capability computing [26, 27]. MTC is often config-ured and run by means of a tool chain creating sets of parameterized computations, initiating the remote computations on a computing cluster and providing the results for further processing [28]. Therefore the IO-workflow of these tasks exhibit extensive pre-and post-processing phases which significantly influence the overall performance of the computational tasks. This bottleneck becomes even more important for data intensive computing [29, 30].
A central aspect of this paper is the utilization of temporal objects for purposes of per-formance analysis. Consequently, the nomenclature is in accordance with the glossaries of Jensen et al. [31] and Bettini et al. [32]. A comprehensive review on the treatment of time in computing is given in [33].
Research design and methodology
The remainder of this paper is organized as follows: The first section introduces aggre-gated task views on the basis of a sequential workflow. Then the concept of process evolution functions is derived, which is extended to MTC workflows. For scalability pur-poses some event reduction policies are introduced and the rendering of task views is explained. Finally, the example of a performance analysis is discussed. The paper closes with a review on related work and a conclusion.
Visualizing concurrent workflows
initial workstation. In this example each computing task is processed by the following workflow:
1. transfer initial data from workstation to HPC cluster, 2. submit computing task to grid engine and wait for execution, 3. execute computing task,
4. transfer result data from HPC cluster to workstation.
The processing of a specific computing task by this workflow is called a job and a set of jobs is called job array. In our first example, there are no dependencies between the computing task such that all jobs can be started at once and parallelization can be used on appropriate infrastructure. However, each job progresses through five different states:
job started→task pending→task running→task finished→job finished.
In order to evaluate the performance of a MTC job array its progress can be visual-ized by means of task views. The general idea of task views is to draw a progress bar for each job while its drawing colour changes with respect to the state of the correspond-ing job. Progress bars from different jobs are stacked one below the other such that a two-dimensional graph is rendered.
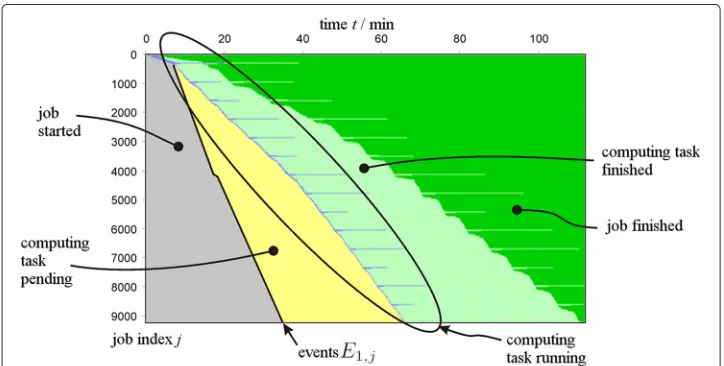
In order to introduce the concept of aggregated task views, an ex-post analysis of 9253 data intensive computing tasks is shown in Fig. 1. The initial data of these jobs have been transferred from a workstation to a HPC cluster consisting of 10 Quad-Core computing nodes, which are managed by Univa Grid Engine [34]. The results of the computations have been transferred back to the original workstation. Of course it is not reasonable to draw 9253 individual progress bars in such a visualization, therefore the jobs have been clustered into 283 groups of approximately 32 jobs and for each job group an aggregated progress bar is drawn. In this example thetasks pendingstate of the aggregated progress bar starts with the firsttask pendingevent of any job of the respective job group and lasts until the firsttask runningstate of any job of the respective job group. Itstasks running
state continues until all jobs of the job group have finished computation, which is the starting point of thetasks finishedstate. The latter lasts until all jobs of the respective job group have signalled ajob finishedevent.
The horizontal axis of the aggregated task view shown in Fig. 1 reveals that all 9253 jobs have been finished in approximately 110min. The coloured regions of the diagram indicate the five states of the workflow from which is visible that the majority of comput-ing tasks execute less than one minute on the cluster system and only 14 groups contain at least one task, which computes up to 15 minutes on the cluster system. Note, that the incline of the interfaces between the coloured regions reveal the aggregated transfer rates between the different job states. Therefore, the first 360 jobs start their computation on the cluster system almost immediately after being submitted to the grid engine, which corresponds to an input data transfer rate from the workstation to the cluster system of approximately 50 jobs/minute. Afterwards the transfer rate increases to approximately 315 jobs/minute, which is accounted to the data transfer protocol dedublicating the input data. Because the HPC cluster finishes on average 150 jobs/minute a queue of pending tasks forms, which reaches a maximum of 5700 jobs approximately 35 minutes after the start of the job array. A more accurate look at the slope between thetasks pendingstate and thetasks running state reveals that after 40 minutes the slope increases from 130 tasks/minute to 170 jobs/minute, which reduces the computing time by 10 minutes. This is attributed to the fact, that cluster resources have been released from a job array running in parallel.
Process evolution functions
While the general concept of aggregated task views becomes quite clear from the example above, their theoretical foundation is not trivial. Therefore, as starting point, we are going to model the workflow of the MTC jobs visualized in Fig. 1 on basis of communicating sequential processes [24]. Here, the transition from one process state to the next state is triggered by a specific eventEi. In order to model our example the following events have
been chosen:
E0 : job starts to copy input data from workstation to HPC cluster, E1 : job submits computing task to batch queuing system,
E2 : computing task is scheduled and starts execution,
E3 : computing task is finished and job starts copying result data from HPC cluster to workstation,
E4: job has finished copying the results data.
In terms of communicating sequential processes the modelled IO-workflow is a process
P=E0→E1→E2→E3→E4→STOPP (1)
with alphabetαP= {E0,E1,E2,E3,E4}. The sequence
s= E0,E1,E2,E3,E4 (2)
of events E0,. . .,E4 represent the trace of process P [24] or so-called lifeline [11]. Recording the instanttof these events is a mapping
of the process alphabetαP to a time domainT. This mapping realizes an ordered set of clocks{τ(E0),. . .,τ(E4)}with ∀i : τ(Ei) < τ(Ei+1). The clocks are assumed to be synchronized even in a distributed system [35]. These clocks allow for the monitoring of the stateSP(t|s)of processPwith respect to its tracesas continuous function of timetby
SP(t|s)=
E∈s
θ (t−τ(E))= 4
i=0
θ (t−τ(Ei)). (4)
Here,θ(·)denotes the Heaviside step function [36]
θ(x)=
1, x≥0,
0, x<0. (5)
In terms of our IO-workflow example P, the process evolution function SP(t|s) is
bounded 0≤ SP(t|s) ≤5 and increases stepwise at the occurrence of an eventE ∈sof
traces. Therefore the value of the process evolution function can be directly related to the state of processPas
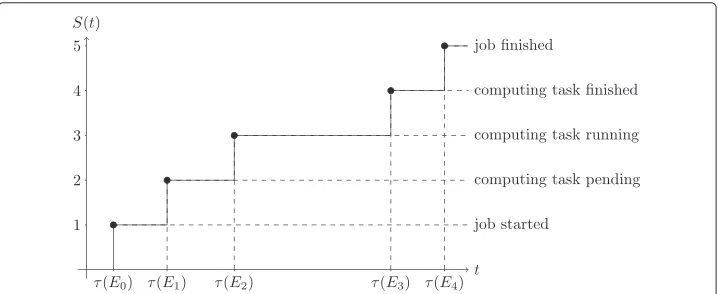
SP(t|s)=
⎧ ⎪ ⎪ ⎪ ⎪ ⎪ ⎪ ⎪ ⎪ ⎨ ⎪ ⎪ ⎪ ⎪ ⎪ ⎪ ⎪ ⎪ ⎩
0, t<E0, job not started, 1, E0≤t<E1, job started,
2, E1≤t<E2, computing task pending, 3, E2≤t<E3, computing task running, 4, E3≤t<E4, computing task finished, 5, t≥E4, job finished.
(6)
An example of which is shown in Fig. 2. From a more general point of view the process evolution functionSP(t|s)maps timetto process state indexkfor a given traces. Because
the IO-workflow examplePdoes not exhibit cycles between process states, the relation between eventsE∈sand process state indexksimplifies to
SP(t|s)=
k, Ek−1≤t<Ek,
0, otherwise. (7)
Process evolution functions combine a specific process modelPand the related event series of processes, which are inherently time-discrete, to a time-continuous analytical representation of the respective processes. It is important to note, that a process evolu-tion funcevolu-tion maps the recorded events of a process to a process state irrespectively of the
number of recorded events. Therefore process evolution functions are useful for analyz-ing and optimizanalyz-ing live processes. Eg. in machine learnanalyz-ing pipelines the process evolution function might be chosen as a robust feature.
Process evolution functions for MTC
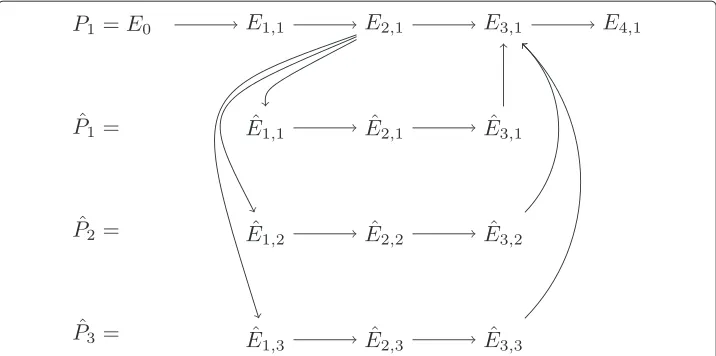
For MTC we have to take account of the fact that in general a process or so-called job is defined by a directed acyclic graph (DAG). In terms of our previous example, this is exactly the case for a computing task submitting child tasks to the DRMS, in order to wait for the results and aggregate them later on (Fig. 3). Such child tasks have a reduced alphabetαPˆ = { ˆE1,Eˆ2,Eˆ3}with process
ˆ
P= ˆE1→ ˆE2→ ˆE3→STOPPˆ (8)
and events
ˆ
E1 : computing task submits child to batch queuing system, ˆ
E2 : child task is scheduled and starts execution, ˆ
E3 : child task is finished and provides results to parent task.
The DAG of a parent job, which submits three child jobs to a DRMS is shown in Fig. 4. In order to take account of the required scalability for monitoring MTC applications the discrimination between parent and child jobs has to be neglected. Therefore, child jobs inherit thejob startedeventE0from its parent, such that their progress is documented by trace
ˆ
s= E0,Eˆ1,Eˆ2,Eˆ3 (9)
and process evolution function
SPˆ(t|ˆs)=
E∈ˆs
θ (t−τ(E)). (10)
With this definition at hand it becomes clear, that process evolution functionsSP(t|s)
given in Eq. (4) andSˆPˆ(t|ˆs)map to identical process state indices (6). The only difference is that child jobs do not throw ajob finishedevent from which follows 0≤ SPˆ(t|ˆs) ≤4. However, this is acceptable, because the results of child tasks are aggregated by the parent task, which is responsible for delivering thejob finishedevent (Fig. 4).
Fig. 4Example of parent jobP1from which three child jobsPˆ1,Pˆ2, andPˆ3are submitted to batch queuing
system
With this simplification at hand, parent and child jobs of MTC applications are regarded as indistinguishable jobs of job array{Pj}with processes
Pj=E0→E1,j→E2,j→E3,j→E4,j→STOPPj (11)
forj = 1,. . .,N and alphabetαPj = {E0,E1,j,E2,j,E3,j,E4,j}. Here, it is assumed that all jobs of job array{Pj}are started by the same eventE0. The traces{sj}of job array{Pj}are given by
sj= E0,E1,j,E3,j,E3,j,E4,j (12)
and itsN-dimensional process evolution function
SP(t|{sj}) = SP(t|s1,. . .,sj,. . .,sN) (13a) = SP(t|s1),. . .,SP(t|sj),. . .,SP(t|sN) T
with
SP(t|sj)=
E∈sj
θ (t−τ(E)), (13b)
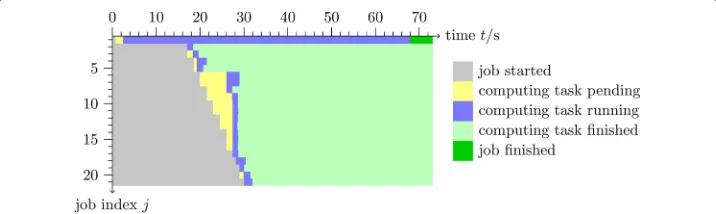
an example of which is visualized in Fig. 3 as task view. Each elementSP(t|sj)represents
an individual process evolution function, which can be independently plotted (e.g. Fig. 2). The chosen representationSP(t|{sj})is convenient because it allows to monitor e.g. the
amountpk(t)of jobs being in a specific statekat timetby simply counting the number of
process evolution functions holdingSP(t|sj)=kand dividing this number by the number
Nof jobs:
pk(t)=
1 N
j:SP(t|sj)=k
1. (14)
A snapshot of all job states{p0(t),p1(t),. . .,pK(t)}at instantt= tis often
Event reduction policies
In order to visualize theN-dimensional process evolution functionSP(t|{sj})for large job
arrays (e.g. Fig. 1), the information density has to be reduced whereby balancing the com-pleteness of the picture and the significance of certain events. Therefore, in view of several thousands jobs to be analyzed, the dimension of process evolution functionSP(t|{sj})has
to be reduced.
We begin by aggregating theN-dimensional vector functionSP(t|{sj})of job array{Pj}
to a scalar functionSP(t|˜s)by applying event reduction policies. These policies aggregate
theNtraces{sj}of job array{Pj}to a single traces˜containing the most important events of the job array. The central idea is to sort all eventsEk,j ∈ {sj}, which initiate a certain
process statek, with respect to their occurrenceτEk,j and choose, depending on the
reduction policy, the first or the last event of the considered process statek.
Therefore the reduction policies provide a filter for emphasizing certain process states. E.g. in the IO-workflow example it might be important for the user to identify the time interval in which at least one job is in state task running. Therefore we choose the reduction policies by selecting the firsttask pendingevent
˜
E1=arg min E:E1∈{sj}
τ(E), (15a)
the firsttask runningevent
˜
E2=arg min E:E2∈{sj}
τ(E), (15b)
the lasttask finishedevent
˜
E3=arg max E:E3∈{sj}
τ(E), (15c)
and the lastjob finishedevent
˜
E4=arg max E:E4∈{sj}
τ(E). (15d)
Consequently, the time intervall in which at least one job is in statetask runningstarts atτE˜2
and ends atτE˜3
. The reduced trace˜sis given by
˜
s= E0,E˜1,E˜2,E˜3,E˜4 (16)
and its aggregated process evolution functionSP(t|˜s)computes from Eq. (4). It maps time
tto the aggregated job array state (Table 1) indicating that the job array{Pj}has not been startedSP(t|˜s) = 0 , input data are copied to the HPC clusterSP(t|˜s) = 1, at least one
computing task has been submittedSP(t|˜s)=2, at least one computing task is executing
SP(t|˜s) = 3, all computing task have been finishedSP(t|˜s) = 4, and all jobs have been
finishedSP(t|˜s)=5.
Table 1Interpretation of aggregated process evolution functionSP(t|˜s)
Interval SP(t|˜s) Interpretation
t< τ(E0) 0 Job array{Pj}has not been started
τ(E0)≤t< τ(˜E1) 1 Input data are being copied to the HPC cluster
τ(E˜1)≤t< τ(˜E2) 2 At least one computing task has been submitted
τ(E˜2)≤t< τ(˜E3) 3 At least one computing task is executing
τ(E˜3)≤t< τ(˜E4) 4 All computing task have been finished
τ(E˜4)≤t 5 All jobs have been finished
EventsEiare registered by a set of synchronized clocksτ(Ei)
reduction is not applied to all traces{sj}. Instead, the job array is split intoMjob groups of approximatelyM/N jobs with the exact number of jobs per group being retrieved from a variant of Bresenham’s line algorithm [37]. Finally, the event reduction policies are applied to each of the job groups respectively their set of traces resulting intoMreduced traces˜s1,. . .,˜sM, which can be visualized with respect to their process evolution function
SP(t|˜s1),. . .,SP(t|˜sM)by means of an aggregated process evolution function ˜
Sp(t|˜s1,. . .,˜sM)=(SP(t|˜s1),. . .,SP(t|˜sM))T, (17)
which is an M-dimensional vector function being the analytical representation of an aggregated task view, an example of which is shown in Fig.1.
Results and discussion Rendering task views
In the previous sections it has been shown that process evolution functions are an analyti-cal time continuous representation of event series. Therefore they are useful for rendering task views because they allow for the transformation of event series into discrete time signals by sampling the stateSP(t|s)of processP.
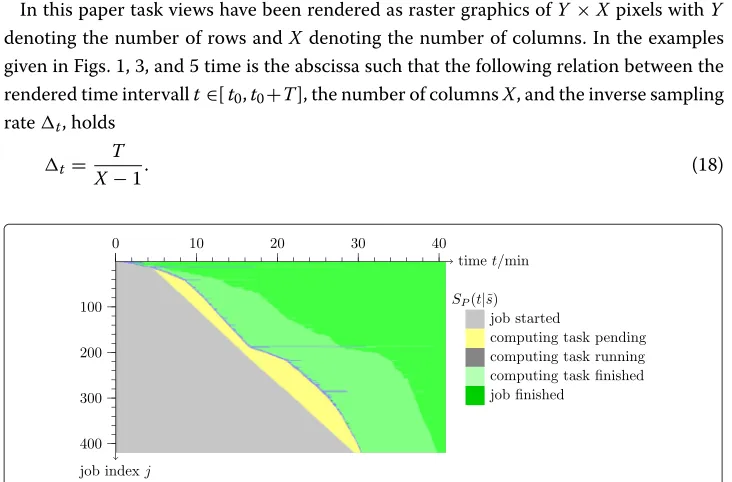
In this paper task views have been rendered as raster graphics ofY×Xpixels withY denoting the number of rows andXdenoting the number of columns. In the examples given in Figs. 1, 3, and 5 time is the abscissa such that the following relation between the rendered time intervallt∈[t0,t0+T], the number of columnsX, and the inverse sampling ratet, holds
t=
T
X−1. (18)
With this relation at hand a sampleSP,xof process evolution functionSP(t|s)is given as
SP,x =SP(t0+(x−1)t|s) withx=1, 2,. . .,X. (19)
Consequently, the discrete time signalSPof processPis a process evolution sequence
SP = SP,1,SP,2,. . .,SP,x,. . .SP,X
= (SP(t0|s),SP(t0+t|s),. . .,SP(t0+(x−1)t|s),. . .,SP(t0+T|s)). (20)
If the number of rowsY is equal to the number of processesN exactly one sequence SP quantifies the pixel values of one row of the raster graphics. If the number of rowsY
is larger than the number of processesNthe event reduction policies (15) are applied for computingM=Yreduced traces˜s1,. . .,˜sM, from which the process evolution sequences
(20) are computed (Fig. 1). The last scenario comprises situations, where the number of rowsY is smaller than the numberN of processes. In this case theY rows are split into Ngroups of approximatelyY/Nrows per job. Consequently, each of theNprocess evo-lution sequences is repeatedly used for filling the pixels of its corresponding row group. The exact distribution of rows on process evolution sequences might be retrieved from Bresenham’s line algorithm [37]. An example of this kind of task view is shown in Fig. 3.
Analyzing job array performance
Frequently, the question arises whether the throughput of an MTC application can be increased by increasing the number of computing nodes or by refactoring the underlying algorithms with respect to the MTC workflow. In order to decide on this question an aggregated task view of a representative job array might provide useful information.
In order to demonstrate such kind of analysis an aggregated task view visualizing the performance of 419 jobs is shown in Fig. 5. Similar to the introductory example the jobs have been configured to transfer the input data to a HPC cluster, submit the computing task to Univa Grid Engine, wait for their execution and copy the results back to the origi-nal workstation. The aggregated task view reveals that the job array contains at least two computing tasks running up to 15 minutes, while the majority of computing tasks has fin-ished in less than a minute. It becomes clear that one of the long running jobs finishes after all other jobs have been finished. Therefore, rearranging the job array such that jobs with long execution times are started right at the beginning will be a first measure of increasing the job array performance.
The aggregated task view also shows that the last ten minutes of processing the job array is spent for copying result files from the HPC cluster to the original workstation. There is a good chance, that compressing the result files will decrease the duration of the final file transfer significantly.
However, although such kind of performance issues could be easily detected by estab-lished monitoring tools, the example demonstrates that aggregated task views are a useful tool not only for system administrators but also for users of MTC.
Related work
Monitoring of concurrent workflows is an important issue in computational science and information technology due to its relevance for running complex IT-systems and provid-ing stable IT-services. Therefore, nearly every workflow management system includes a monitoring component. On basis of a selection of established workflow management and monitoring frameworks we are discussing the integration ability of aggregated task views. P-GRADE is a portal for managing grid computing workflows on a variety of grid sys-tems [38]. It includes the monitoring program Prove [39], which is able to visualize task views from trace files of individual jobs. Due to its combination of an existing workflow model and the capturing of traces the concept of aggregated task views could be easily integrated into P-GRADE either by chosen default aggregation policies are by providing a configuration interface for aggregation policies.
ASKALON is a cloud and grid application development and computing environment, which is designed as a distributed service-oriented architecture [40]. Two services are important to mention in this context: the performance prediction service and the per-formance analysis service. Both services benefit from a rich set of perper-formance metrics including metrics operating on workflow events. Combining the recorded events with the specified workflow model and an additional configuration layer for aggregation poli-cies, the presented concept of aggregated task views could be integrated into ASKALON. Furthermore, the concept of process evolution functions might even extend the exist-ing performance analysis capabilites of ASKALON, because it maps time-discrete event series to a time-continuous representation, which calls for an integrated analysis of time-discrete and time-continous performance attributes.
Web Service Navigator is a visualization tool for service-oriented architecture appli-cations, which among others is used for analysing performance bottle necks [41]. It correlates metric information about web services requests and responses, models the transactions they represent, and extracts a process model, which is visualized as task view and is used to access performance statistics on selected transactions. Due to its auto-matic conduction of a process model and the collection of transaction events the Web Service Navigator could be enhanced by rendering aggregated task views of concurrent transactions in order to simplify the identification of performance bootle necks. Again, these aggregated task views might be configured by an additional configuration layer for aggregation policies.
advantage of the approach presented in this paper, because it provides an intuitive per-formance evaluation, which is extremly useful for the users of workflow management systems.
Conclusions
The task views discussed in this paper are snapshots, which have been taken from the implementation of a productive workflow management system running at EnBW Energie Baden Württemberg AG [23]. This system is used for running time-critical data-intensive jobs conducting operational research computations for asset planning purposses and energy market analysis.
We have introduced a new paradigm for the performance analysis of MTC workflows on basis of process evolution functions and their policy based aggregation leading to the visualization of aggregated task views. The concept has been explained on basis of IO-workflow monitoring with the computational tasks being scheduled by Univa Grid Engine to a HPC cluster.
The presented analysis paradigm introduces process evolution functions in order to solve the problem of analyzing event series, which are inherently time-discrete, within the context of concurrent workflows by mapping them to a time-continuous representation. The results of this approach are promising with respect to its detailed view on workflow progress and its scalability to thousands of concurrent jobs. It can be directly applied to workflows described by DAGs especially in highly automated systems like big data pipelines, the P-GRADE grid portal [38], ASKALON [40], Petascale science applications [44], the development of new HPC services like hybrid computing [26], or even event-driven business processes [45, 46] and the visualization of web services [41].
We expect that the visualization paradigm of aggregated task views will be integrated into established monitoring tools in order to provide a scalable time-resolved visual performance analysis of concurrent workflows. Furthermore, the concept of process evo-lution functions might become important in data science and big data applications in the context of process optimization projects, because it provides a robust feature for characterizing the state of running workflows.
Competing interests
The concept of process evolution functions and the first draft of this paper have been developed in the context of the CIO agenda topicHigh Performance Computingat the department of corporate IT strategy at EnBW Energie
Baden-Württemberg AG. The presented theoretical framework and the final manuscript have been written in the course of the associated membership of the author at the Freiburg Materials Research Center.
Acknowledgements
The author likes to thank Energy Solution Center e.V. for its networking support, A. Treml for the opportunity to develop the theoretical foundation of this paper, A. Celan for fruitful discussions in an early stage of the manuscript, and Th. Fanslau for the original visualization concept. The article processing charge was funded by the German Research Foundation (DFG) and the Albert Ludwigs University Freiburg in the funding programme Open Access Publishing.
Author details
1Freiburg Materials Research Center, University of Freiburg, Stefan-Meier-Straße 21, 79104 Freiburg im Breisgau,
Germany.2EnBW Energie Baden-Württemberg AG, Durlacher Allee 93, 76131 Karlsruhe, Germany.3Blue Yonder GmbH,
Ohiostraße 8, 76149 Karlsruhe, Germany.
Received: 9 January 2015 Accepted: 19 May 2015
References
2. Zhan J, Zhang L, Sun N, Wang L, Jia Z, Luo C (2012) High volume throughput computing: Identifying and characterizing throughput oriented workloads in data centers. In: Parallel and Distributed Processing Symposium Workshops PhD Forum (IPDPSW), 2012 IEEE 26th International. IEEE, Piscataway (NJ). pp 1712–1721.
doi:10.1109/IPDPSW.2012.213
3. Hollingsworth J, Tierney B (2003) Instrumentation and Monitoring. In: Foster I, Kesselmann C (eds). The Grid 2: Blueprint for a New Computing Infrastructure. The Elsevier Series in Grid Computing. Elsevier Science, Amsterdam. pp 319–352
4. Zanikolas S, Sakellariou R (2005) A taxonomy of grid monitoring systems. Futur Gener Comput Syst 21:163–188. doi:10.1016.j.future.2004.07.002
5. Kokkinos P, Varvarigos EA (2012) Scheduling efficiency of resource information aggregation in grid networks. Futur Gener Comput Syst 28(1):9–23. doi:10.1016/j.future.2011.06.008
6. Brunner P, Truong HL, Fahringer T (2006) Performance monitoring and visualization of grid scientific workflows in ASKALON. In: Gerndt M, Kranzlmüller D (eds). High Performance Computing and Communications. Lecture Notes in Computer Science. Springer, Berlin Heidelberg Vol. 4208. pp 170–179. doi:10.1007/11847366_18
7. Wang TD, Plaisant C, Shneiderman B, Spring N, Roseman D, Marchand G, Mukherjee V, Smith M (2009) Temporal summaries: Supporting temporal categorical searching, aggregation and comparison. Vis Comput Graph IEEE Trans 15(6):1049–1056. doi:10.1109/TVCG.2009.187
8. Suntinger M, Schiefer J, Obweger H, Groller ME (2008) The event tunnel: Interactive visualization of complex event streams for business process pattern analysis. In: Visualization Symposium, 2008. PacificVIS ’08. IEEE, Piscataway (NJ). pp 111–118. doi:10.1109/PACIFICVIS.2008.4475466
9. Moser O, Rosenberg F, Dustdar S (2010) Event driven monitoring for service composition infrastructures. In: Chen L, Triantafillou P, Suel T (eds). Web Information Systems Engineering - WISE 2010. Lecture Notes in Computer Science. Springer, Berlin Heidelberg Vol. 6488. pp 38–51. doi:10.1007/978-3-642-17616-6_6
10. Balis B, Kowalewski B, Bubak M (2011) Real-time grid monitoring based on complex event processing. Futur Gener Comput Syst 27:1103–1112. doi:10.1016/j-future.2011.04.005
11. Tierney B, Johnston W, Cowley B, Hoo G, Brooks C, Gunter D (1998) The netlogger methodology for high performance distributed systems performance analysis. In: In Proc. 7th IEEE Symp. on High Performance Distributed Computing. IEEE, Piscataway (NJ). pp 260–267
12. Gunter DK, Jackson KR, Konerding DE, Lee J, Tierney B (2005) Essential grid workflow monitoring elements. In: Arabnia HR, Ni J (eds). GCA. CSREA Press, Athens. pp 39–45. http://acs.lbl.gov/publications/NetLogger-GID.pdf 13. Bailey SJ, Tierney B, Gunter DK (2005) Scalable analysis of distributed workflow traces. In: Arabnia HR (ed). PDPTA.
CSREA Press, Athens. pp 849–855
14. Böhme D, Geimer M, Wolf F, Arnold L (2010) Identifying the root causes of wait states in large-scale parallel applications. In: Proc. of the 39th International Conference on Parallel Processing (ICPP), San Diego, CA, USA. IEEE Computer Society, Washington, DC. pp 90–100. doi:10.1109/ICPP.2010.18. Best Paper Award
15. Nou R, Juliá F, Hogan K, Torras J (2011) A path to achieving a self-managed grid middleware. Futur Gener Comput Syst 27:10–19. doi:10.1016/j.juture.2010.07.002
16. Zhao Y, Raicu I, Foster I, Hategan M, Nefedova V, Wilde M (2008) Realizing Fast, Scalable and Reliable Scientific Computations in Grid Environments. In: Wong J (ed). Grid Computing Research Progress. Nova Science Publishers, Hauppauge, NY. pp 1–40
17. Kunz T, Black JP (1995) Using automatic process clustering for design recovery and distributed debugging. Softw Eng IEEE Trans 21(6):515–527. doi:10.1109/32.391378
18. Kunz T (1997) High-level views of distributed executions: convex abstract events. Automated Softw Engg. 4(2):179–197. doi:10.1023/A:1008685117587
19. Kunz T, Khouzam M (2000) Concurrent single stepping in event-visualization tools. Cluster Comput 3(3):231–243. doi:10.1023/A:1019092506798
20. Kranzlmüller D (2000) Event graph analysis for debugging massively parallel programs. PhD thesis,. Johannes Kepler University, Linz
21. Mandal A, Kennedy K, Koelbel C, Marin G, Mellor-Crummey J, Liu B, Johnsson L (2005) Scheduling strategies for mapping application workflows onto the grid. In: High Performance Distributed Computing, 2005. HPDC-14. Proceedings. 14th IEEE International Symposium On. IEEE, Piscataway (NJ). pp 125–134.
doi:10.1109/HPDC.2005.1520947
22. Zhang Y, Mandal A, Koelbel C, Cooper K (2009) Combined fault tolerance and scheduling techniques for workflow applications on computational grids. In: Proceedings of the 2009 9th IEEE/ACM International Symposium on Cluster Computing and the Grid. CCGRID ’09. IEEE Computer Society, Washington, DC, USA. pp 244–251.
doi:10.1109/CCGRID.2009.59
23. Liehr AW, Fanslau T, Celan A (2010) Monitoring IO-Workflow by Means of State-Time Diagrams. In: International Supercomputing Conference (ISC). ResearchGate, Berlin. doi:10.13140/2.1.4818.6244
24. Hoare CAR (1985) Communicating Sequential Processes. June 21th 2004 edn. Prentice Hall International, Upper Saddle River, NJ. http://www.usingcsp.com/cspbook.pdf
25. Raicu I, Foster IT, Zhao Y (2008) Many-task computing for grids and supercomputers. In: Many-Task Computing on Grids and Supercomputers, 2008. MTAGS 2008. Workshop On. IEEE, Piscataway (NJ). pp 1–11.
doi:10.1109/MTAGS.2008.4777912
26. Mateescu G, Gentzsch W, Ribbens CJ (2011) Hybrid computing where HPC meets grid and cloud computing. Futur Gener Comput Syst 27(5):440–453. doi:10.1016/j.future.2010.11.003
27. Liehr AW, Moskalenko A, Bode M, Purwins HG (2000) Intergradient Simulations of Dissipative Quasi-particle Interactions with Solutions of a Three-component Three-dimensional Reaction-diffusion System. In: 6th Granada Seminar on Computational Physics. ResearchGate, Berlin. doi:10.13140/RG.2.1.5131.6641
28. Deelman E, Gannon D, Shields M, Taylor I (2009) Workflows and e-science: An overview of workflow system features and capabilities. Futur Gener Comput Syst 25(5):528–540. doi:10.1016/j.future.2008.06.012
30. Kosar T (ed) (2012) Data Intensive Distributed Computing: Challenges and Solutions for Large-Scale Information Management. Information Science Reference, Hershey, PA
31. Jensen C, Dyreson C, Böhlen M, Clifford J, Elmasri R, Gadia S, Grandi F, Hayes P, Jajodia S, Käfer W, Kline N, Lorentzos N, Mitsopoulos Y, Montanari A, Nonen D, Peressi E, Pernici B, Roddick J, Sarda N, Scalas M, Segev A, Snodgrass R, Soo M, Tansel A, Tiberio P, Wiederhold G (1998) The consensus glossary of temporal database concepts – February 1998 version. In: Etzion O, Jajodia S, Sripada S (eds). Temporal Databases: Research and Practice. Lecture Notes in Computer Science. Springer, Berlin Heidelberg Vol. 1399. pp 367–405. doi:10.1007/BFb0053710 32. Bettini C, Dyreson CE, Evans WS, Snodgras RT, Wang XS (1998) A glossary of time granularity concepts. In: Etzion O,
Jajodia S, Sripada S (eds). Temporal Databases: Research and Practice. Lecture Notes in Computer Science. Springer, Berlin Heidelberg Vol. 1399. pp 406–413. doi:10.1007/BFb0053711
33. Furia CA, Mandrioli D, Morzenti A, Rossi M (2010) Modeling time in computing: A taxonomy and a comparative survey. ACM Comput Surv 42(2):6–1659. doi:10.1145/1667062.1667063
34. Univa Corporation (2014) Univa grid engine. Technical report, Univa Corporation. http://www.univa.com/resources/ files/gridengine.pdf
35. Lamport L (1978) Time, clocks, and the ordering of events in a distributed system. Commun ACM 21(7):558–565. doi:10.1145/359545.359563
36. Kanwal RP (1998) Generalized Functions: Theory and Technique. 2nd edn. Birkhäuser, Boston, MA
37. Bresenham JE (1965) Algorithm for computer control of a digital plotter. IBM Syst J 4(1):25–30. doi:10.1147/sj.41.0025 38. Kacsuk P, Kiss T, Sipos G (2008) Solving the grid interoperability problem by P-GRADE portal at workflow level. Futur
Gener Comput Syst 24(7):744–751. doi:10.1016/j.future.2008.02.008
39. P-GRADE Portal Developer Alliance (2010) The prove program. P-GRADE Portal 2.10, MTA SZTAKI LPDS. http://portal. p-grade.hu/manual/user/v210/UsersManualRelease2_10.html#3_The_Prove_program_
40. Qin J, Fahringer T (2012) Scientific Workflows: Programming, Optimization, and Synthesis with ASKALON and AWDL. Springer, Berlin
41. Pauw W, Lei M, Pring E, Villard L, Arnold M, Morar J (2005) Web service navigator: Visualizing the execution of web services. IBM Syst J 44(4):821–845
42. Cardoso J, Sheth AP, Miller JA, Arnold J, Kochut KJ (2004) Quality of service for workflows and web service processes. Web Semantics: Sci Serv Agents World Wide Web 1(3):281–308
43. Truong HL, Dustdar S, Fahringer T (2007) Performance metrics and ontologies for grid workflows. Futur Gener Comput Syst 23(6):760–772. doi:10.1016/j.future.2007.01.003
44. Baranovski A, Bharathi S, Bresnahan J, Chervenak A, Foster I, Fraser D, Freeman T, Gunter D, Jackson K, Keahey K, Kesselman C, Konerding DE, Leroy N, Link M, Livny M, Miller N, Miller R, Oleynik G, Pearlman L, Schopf JM, Schuler R, Tierney B (2007) Enabling distributed petascale science. J Phys: Conference Series 78(1):012020.
doi:10.1088/1742-6596/78/1/012020
45. Durand J, Cho H, Moberg D, Woo J (2011) XTemp: Event-driven testing and monitoring of business processes: Leveraging XML, XPath and XSLT for a practical event processing. In: Proceedings of Balisage: The Markup Conference 2011. Balisage Series on Markup Technologies. Mulberry Technologies, Inc., Rockville (MD) Vol. 7. doi:10.4242/BalisageVol7.Durand01
46. Luckham D (2012) Event Processing for Business. Organizing the Real-Time Enterprise. John Wiley & Sons, Hoboken, New Jersey
Submit your manuscript to a
journal and benefi t from:
7 Convenient online submission
7 Rigorous peer review
7 Immediate publication on acceptance
7 Open access: articles freely available online
7 High visibility within the fi eld
7 Retaining the copyright to your article