R E S E A R C H
Open Access
Compile- and run-time approaches for
the selection of efficient data structures for
dynamic graph analysis
Benjamin Schiller
1*, Clemens Deusser
1, Jeronimo Castrillon
2and Thorsten Strufe
1*Correspondence:
[email protected] 1Privacy and Data Security, Department of Computer Science, TU Dresden, Nöthnitzer Straße 46, 01187 Dresden, Germany Full list of author information is available at the end of the article
Abstract
Graphs are used to model a wide range of systems from different disciplines including social network analysis, biology, and big data processing. When analyzing these constantly changing dynamic graphs at a high frequency, performance is the main concern. Depending on the graph size and structure, update frequency, and read accesses of the analysis, the use of different data structures can yield great
performance variations. Even for expert programmers, it is not always obvious, which data structure is the best choice for a given scenario.
In previous work, we presented an approach for handling the selection of the most efficient data structures automatically using a compile-time approach well-suited for constant workloads.
We extend this work with a measurement study of seven data structures and use the results to fit actual cost estimation functions. In addition, we evaluate our approach for the computations of seven different graph metrics. In analyses of real-world dynamic graphs with a constant workload, our approach achieves a speedup of up to 5.4× compared to basic data structure configurations.
Such a compile-time based approach cannot yield optimal results when the behavior of the system changes later and the workload becomes non-constant. To close this gap we present a run-time approach which provides live profiling and facilitates automatic exchanges of data structures during execution. We analyze the performance of this approach using an artificial, non-constant workload where our approach achieves speedups of up to 7.3×compared to basic configurations.
Keywords: Dynamic graph analysis, Data structures, Performance, Measurement study, Compile-time optimization
Introduction
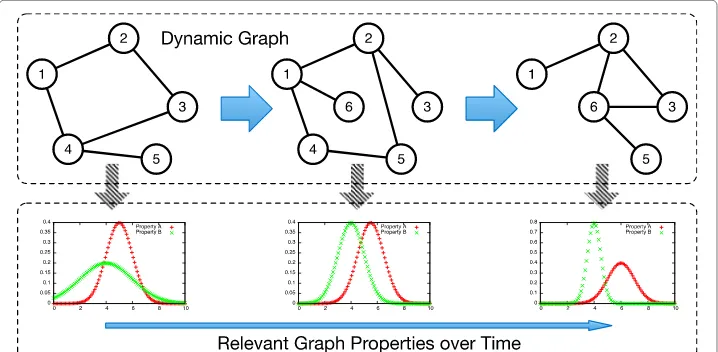
There is an emerging application domain that deals with the analysis of dynamic graphs. They serve to model dynamic systems across different disciplines, such as biological (Candau et al. 1982; Marti 2000), transportation (Chabini 1998), computer (Gonçalves 2012), and social networks (Braha 2009; Kossinets 2006; Mucha 2010). The analysis of such dynamic graphs is challenging and its complexity arises from the frequent changes to their topologies and properties rather than their size alone. Due to a proliferation of applications and the ever increasing size of dynamic systems, performance has quickly become a major concern (Ediger 2010, 2012; Madduri and Bader 2009).
The general application pattern of dynamic graph analysis consists of a sequence of graph modifications followed by a computation of metrics (cf. Fig. 1). Several metrics investigate local properties such as the clustering coefficient and assortativity. Other met-rics determine global properties like degree distribution, all-pairs shortest paths, and connected components. Each metric has a different interpretation depending on the application domain. As an example, a high betweenness centrality identifies users with high influence in social networking and potential communication bottlenecks in com-puter networks. Such an analysis serves to better understand the states of a system and improve its design in a variety of applications (Ambedkar et al 2015; Trequattrini et al. 2015; Zhao et al. 2015). The analysis of the states of a dynamic graph can be implemented using snapshot- or stream-based approaches (Ediger et al. 2010). We use snapshot-based algorithms in the following since the problem of modifying and accessing the in-memory representation of a dynamic graph is the same for both.
For performance reasons, dynamic graph analysis is implemented on an in-memory graph representation (Ediger et al. 2010; 2012). There are well understood representations of graphs, such as adjacency lists and matrices, on which algorithms, data structures, and complexity analyses have been studied extensively. For practical applications, however, it remains challenging to find the best suited match of algorithms and data structures as the result often depends on the combination of a number of factors. In the case of dynamic graphs this includes graph size and structure, frequency of updates to its topology, and access patterns of the metric computation. Different graph representations result in high performance deviations but are challenging for programmers to predict (Hunt and John 2011; Shirazi 2003).
There exist many frameworks for the efficient analysis of static graphs (Bader et al. 2008; Batagelj et al. 1998; Malewicz et al. 2010). While they are all built for efficient analysis, the graph representation is fixed and selected by the developers. Many graph databases have been developed to represent graph over time (McColl et al. 2009). While they allow for complex queries of the graph over time and the storage of additional properties, they are neither suited for a large number of updates nor the efficient computation of topological
graph properties for specific states (Ciglan et al. 2012). A lot of work has been done to develop compact representations of graphs. These approaches do not focus on runtime efficiency but on obtaining a small memory footprint (Blandford and et al. 2004). They often are not even applicable to arbitrary graphs as they are developed for separable or sparse graphs (Blandford et al. 2003; Sun et al. 2007). Special graph representations for dynamic graphs have also been developed. Their underlying data structures are tuned for memory (Madduri and Bader 2009) or runtime efficiency (Bader et al. 2009; Ediger et al. 2012; Macko 2014) but cannot be adapted to different scenarios.
Many approaches have been developed for profiling programs to facilitate their subse-quent optimization. Frameworks likePin(Luk et al. 2005) orJFluid(Dmitriev 2004) allow the instrumentation of existing programs to collect statistics about CPU usage, memory consumption, or call frequencies of code fragments. In addition to this instrumenta-tion,Brainy(Jung et al. 2011) enables the optimization of the data structures used by a program. Based on benchmarks of available data structures, the approach uses machine learning to generate rules like, e.g.,if operation o is called more than k times use data structure d. After the analysis of a complete execution of the program, data structures are exchanged based on these general rules. This approach is not applicable to the problem of dynamic graph analysis because the generated rules are generalized for all data types and do not take into account the specific runtime properties of handling vertices or edges in specific lists.
Other approaches attempt to exchange the used data structures during run-time. Just-in-Timedata structures (JitDS) (DeWael et al. 2015) is an extension of the Java language enabling the combination of multiple representations for a single data structure. For each instance, swap rules can be defined by an expert programmer to declare when and how to switch between representations. While this approach is powerful, it relies on the pro-grammer’s intuition and foresight to define such rules.Chameleon(Shacham et al. 2009) provides a framework for run-time profiling without the need to adapt the program. In case the program uses data structure wrappers provided by the framework, data struc-tures can be replaced during runtime which comes at the high cost of performing a separate monitoring of all data structures. Based on fixed rules for exchanging data struc-tures as well,CoCo(Xu 2013) requires the programmer to use wrappers provided by the framework in order to optimize the selected data structures during run-time. With their use of pre-defined rules that do not adapt to the current properties of the graph and read accesses of the analysis, both approaches are not suited for the analysis of dynamic graphs.
In previous work (Schiller et al. 2015), we presented a compile-time approach for opti-mized data structure selection in the context of dynamic graph analysis. We benchmarked five data structures as potential candidates and evaluated our approach for the computa-tion of three graph metrics. In this article, we extend this work by benchmarking a total of seven data structures, creating actual estimation functions via curve fitting, and evalu-ating the impact on a total of seven graph metrics. Furthermore, we propose and evaluate a run-time approach for the selection of optimal data structures during the execution of an application to handle highly dynamic workloads.
results, and evaluate its performance benefits. We outline and evaluate our run-time approach in Section “Run-time selection of efficient data structures” and summarize our work in Section “Summary, conclusion, and outlook”.
Terminology and notation
In this Section, we introduce our terminology and notations for graphs, dynamic graphs, and their analysis. We introduce the different lists for representing graphs in mem-ory as well as the operations required to adapt them over time and access them for analysis. Finally, we define the problem of selecting the best data structures for these lists.
Graphs and adjacency lists
A graph G = (V,E) consists of a vertex set V = {v1,v2,. . .} and an edge set E. In
undirected graphs, edges are unordered pairs of vertices and ordered pairs in directed graphs. Theadjacency listof a vertex in an undirected graph is then defined asadj(v):= {{v,w} ∈ E}. For directed graphs, incomingandoutgoing adjacency listsare defined by in(v) := {(w,v) ∈ E}andout(v) := {(v,w) ∈ E}. In addition, the vertices with bidirec-tional connections are commonly stored in theneighborhood list, i.e.,n(v) := {w∈ V :
(w,v)∈in(v)∧(v,w)∈out(v)}.
Dynamic graphs
As adynamic graph, we consider a graph whose vertex and edge sets change over time. Each change is represented by an update ofV or Ethat adds or removes an element. Applying any of these updatesadd(v),rem(v),add(e), andrem(e)implies the modification ofV,E, and adjacency lists.
We consider a dynamic graph at an initial stateG0=(V0,E0)and its development over
time:G0,G1,G2,. . .. The transition between two statesGiandGi+1of the graph can then
be described by a set of updates we refer to as a batchBi+1. Then, the complete transition
of a dynamic graph over time can be understood as the consecutive application of batches to it:G0
B1 −→G1
B2 −→G2
B3 −→. . ..
Analysis of dynamic graphs
Analyzing a dynamic graph means to determine its topological properties at certain states, e.g., forG0,G1,G2,. . .. Examples of such topological metrics are the degree
distri-bution (DD), connected components (C), assortativity (ASS), clustering coefficient (CC), rich-club connectivity (RCC), all-pairs-shortest paths (SP), and betweenness centrality (BC).
Representing a dynamic graph in memory
element type stored in a list byt : L → T witht(V) = t(n) := vandt(E) = t(in) = t(out)=t(adj):=e.
Each list must provide operations to modify it and retrieve certain information. To cre-ate and maintain a list, it must provide means to be initialized (init), add elements to it (add), and remove existing elements (rem). It must provide operations to fetch a specific element using a unique identifier (get) or iterate over all elements (iter). Often, it is also necessary to retrieve a random element from a list (rand), determine its cardinality (size), or determine if a specified element is contained in the list (cont).
The execution ofadd,rem, andgetcan be successful or fail depending on the current state of the list. Likewise, the execution ofcont can return true or false. For example, adding vertexvtoVfails in case it already exists while the removal ofefromEis success-ful in case the edge exists. Similarly, the result of acontainsoperation can betrueorfalse, also considered as success or failure. Depending on the data structure used to implement a list for storing elements of a specific type, the runtime can differ significantly when an operation fails compared to a successful execution. We do not need to make this distinc-tion for the other operadistinc-tions:sizeanditercan not fail andrandreturnsnullin case the list is empty.
Therefore, we distinguish between successful (s) and failed (f) execution of add, rem, get, and cont and consider a set O of 12 different operations: o ∈ O := {init,adds,addf,rems,remf,gets,getf,iter,rand,size,conts,contf}.
Problem definition
In this article, we consider the problem of finding the most efficient data structures for representing a dynamic graph during analysis in memory. AssumeDto be a set of data structures that implement all required operations. Then, we must find the most effi-cient configuration cfg which maps each list to a data structure:cfg : L → D. For undirected graphs, this means to select data structures forV,E, andadjwhile directed graphs require data structures for in, out, and n in addition to V and E. In the fol-lowing, we focus on undirected graphs since all results can be transferred to directed graphs.
Compile-time selection of efficient data structures
In this Section, we describe a compile-time approach for the selection of efficient data structures for the analysis of dynamic graphs. Afterwards, we discuss benchmarking results for different data structures and give examples. Then, we present results of oper-ation counts obtained during profiling for the computoper-ation of graph metrics and the adaptation of a dynamic graph. Finally, we evaluate our approach on two real-world datasets and summarize our results.
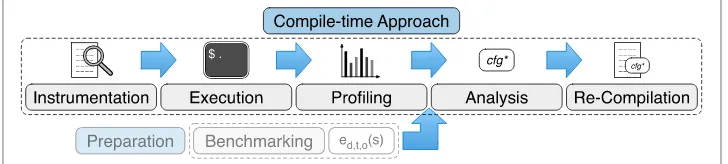
Compile-time approach
To understand and estimate the performance of data structures when executing specific operations, we benchmark them beforehand. This preparation phase must be executed only once for a platform where the application should be executed.
An overview of our compile-time approach is given in Fig. 2 and it consists of five components: First, a given application is instrumented to enable profiling. Second, it is executed for some batches to record access statistics for all lists. Third, these access statis-tics are aggregated by the profiling component. Fourth, these statisstatis-tics are analyzed using the runtime estimations obtained during benchmarking to recommend the most effi-cient configuration. Fifth and finally, the program is re-compiled to use the recommended configuration.
Benchmarking
The runtime of executing an operationo∈Oon a listl∈Ldepends on the element type t(l) ∈ T, the data structured ∈ Dused to implement the list, and its sizesl ∈ N+. To estimate this runtime, we perform measurements for data structures and element types with all operations and list sizess∈[ 1,smax]. As a result, we obtain a set of measurements for each list sizes:md,t,o:[ 1,smax]→Rk.
To obtain an estimation functioned,t,o from the runtime measurementsmd,t,o, we fit the following functions using thenonlinear least-squares (NLLS) Marquardt-Levenberg algorithm provided bygnuplot1:
• f1(x)=a+b·x+c·x2 • f2(x)=a+b·log(x)
We chose these functions to reflect the complexity classes O(1), O(s), O(s2), and
O(log(s))of the operations on different data structures. We fitf1andf2via median value
and standard deviation of the data points inmd,t,oand select the function with the smallest error ased,t,o.
Instrumentation, execution, and profiling
Two actions are performed during the analysis of a dynamic graph: graph modification and metric computation. Graph modification means that the in-memory representation is changed to reflect the updates that occur in the graph over time, i.e.,addandrem. For the computation of metrics, read operations likeiter,size, andcontainsare executed on certain lists depending on metrics and algorithms.
In the first part of our approach, we instrument a given application such that these accesses to data structures can be recorded. Then we execute the instrumented application for some batches and aggregate the recorded access statistics for each listl andoascl:O→N. We refer toclas operation counts. In addition, we record the average
size of all instances of listlassl. For example,cV(add)records how many elements have been added toV andsadjdenotes the average size of all adjacency listsadj.
Analysis and re-compilation
The analysis component takes as input operation countscland average sizeslfor all lists lgenerated during profiling. From that, we estimate the runtime of any data structured aso∈Ocl(o)·ed,t(l),o(sl). Then, the most efficient data structured∗∈Dfor executingcl forslcan be estimated by
d∗(cl,sl)=arg min d∈D
o∈O
cl(o)·ed,t(l),o(sl).
Hence, the most efficient configuration for all listslcan be estimated as
cfg∗(l):=d∗(cl,sl), l∈L.
As a result, the analysis components returns the configurationcfg∗which was estimated to be the most efficient for executing the operation counts for the given list sizes. Finally, we re-compile the application to usecfg∗.
Benchmarking results
We performed a measurement study of Java data structures to obtain md,v,o(s) and md,e,o(s)for sizess ∈[ 1, 105], and seven data structures that provide the required oper-ations:Array(A),ArrayList(AL),HashArrayList(HAL),HashMap(HM),HashSet(HS), HashTable(HT), andLinkedList(LL), i.e.,D = {A,AL,HAL,HM,HS,HT,LL}. HashAr-rayListis an implementation that stores all elements simultaneously in a HashSet and an ArrayList to take advantage of their respective performance for different opera-tions as proposed by Xu (2013). For the other data structures, we used the default Java implementations.
All measurements are executed on anHP ProLiant DL585 G7server running a Debian operating system with 64 2.6GHzAMD OpteronTM 6282SEprocessors. We guaranteed that no more than 60 processes were running during the evaluation executed using a 64-bit JVM version 1.7. Our implementation of the benchmarking phase is available as an open-source repository2.
We used implementations of vertices and edges and repeated all measurements 50 times. A vertexvis identified by a unique indexid(v). An edgee = (v,w) is identi-fied by a 32-bit (int) hash computed from the indexes of the connected vertices, i.e., h(e):=id(v)+id(w)·216 mod32. Selected results formd,e,oanded,e,owiths∈[ 1, 100] are given in Fig. 3. Measurements for all operations and list sizes can be found in the technical report3.
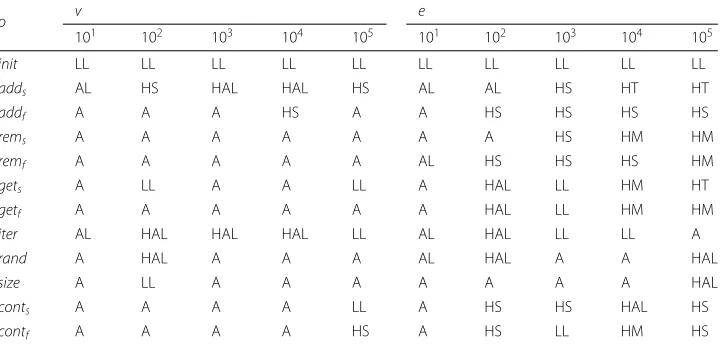
As examples, we list the estimation functions forgetsandgetf in Table 1.
(a) (b)
(c) (d)
(e) (f)
(g) (h)
Fig. 3Selected runtime estimations (fitted functionsed,t,owith median of 50 measurementsmd,t,o) for list
sizess∈[ 1, 100]
For storing vertices,ArrayandHashArrayListappear to be the fastest data structures overall (cf. Table 2). They perform best for most operations and list sizes.
Table 1Estimation functions ofgetsandgetfdepending on data structure and element type
t d ed,t,gets(x) ed,t,getf(x)
v
A 23.74+0.91·x−0.01·x2 16.72+0.15·x−0.00·x2
AL 24.49+1.41·x−0.01·x2 41.09+1.82·x+0.04·x2 HAL 47.58+0.18·x−0.00·x2 60.36+3.23·x−0.00·x2
HM 73.57+0.93·x−0.00·x2 57.48+15.46·log(x)
HS 56.20+40.23·x−0.18·x2 54.05+40.99·x−0.17·x2
HT 153.87+18.14·log(x) 98.70+19.96·log(x)
LL 39.80+0.24·x−0.00·x2 26.28+14.04·x+0.22·x2
e
A 22.92+1.88·x+0.02·x2 27.78+1.51·x+0.02·x2
AL 23.49+3.65·x−0.00·x2 29.81+3.63·x−0.00·x2
HAL 51.42+5.26·x−0.02·x2 53.08+4.77·x−0.02·x2
HM 371.51+1.38·x−0.00·x2 357.04+1.44·x−0.00·x2 HS 33.45+15.87·x−0.04·x2 69.20+34.08·x+0.01·x2
HT 442.95+2.09·x−0.01·x2 407.83+5.01·x−0.04·x2
LL 31.36+11.18·x+0.10·x2 35.44+10.59·x+0.11·x2
The reason for the difference in performance when storing vertices or edges lies in the identification of elements. Vertices are identified by a unique identifier which can simply be used as the index ofArray,ArrayList, orHashArrayList. Therefore, performing con-tainsorgetoperations translates to a simple lookup at a deterministic location in memory. In contrast, hash-based data structures perform the overhead of looking up this identi-fier in the corresponding hash table and potentially determining its location in memory. Edges are identified by a hash computed from the two unique indexes of the adjacent ver-tices. Their lookup in an array-based data structure is time consuming since the complete list has to be scanned. Representing all possible indexes of an edge list in an array-based data structure would require each list to map all possible hash values, and hence always be of size 232 which is infeasible. While the lookup in array-based data structures is still faster for small lists, hash-based data structures are faster for larger lists as they only need to check for the respective hash in their hash table.
From these results, we assume that array-based data structures should be recom-mended for storing vertices. Similarly, we see that for storing small edge lists, array-based
Table 2Fastest data structure according to our estimation for different list sizes
o v e
101 102 103 104 105 101 102 103 104 105
init LL LL LL LL LL LL LL LL LL LL
adds AL HS HAL HAL HS AL AL HS HT HT
addf A A A HS A A HS HS HS HS
rems A A A A A A A HS HM HM
remf A A A A A AL HS HS HS HM
gets A LL A A LL A HAL LL HM HT
getf A A A A A A HAL LL HM HM
iter AL HAL HAL HAL LL AL HAL LL LL A
rand A HAL A A A AL HAL A A HAL
size A LL A A A A A A A HAL
conts A A A A LL A HS HS HAL HS
contf A A A A HS A HS LL HM HS
data structures should be recommended as well. For larger edge lists with more than 100 elements, there is not a single data structure which appears best. Hash-based data struc-ture perform better thanArrayandArrayListbut which one depends on the combination and count of the performed operations.
Profiling results
We instrumented the graph component ofDNA (Dynamic Network Analyzer)4, a frame-work for the analysis of dynamic graphs (Schiller and Strufe 2013), to recordclandslfor all listsl∈Lduring graph modification and metric computation usingAspectJ(Kiczales et al. 2001). In the following, we present such results generated using the profiling com-ponent. With these operation counts and average list sizes, we can perform an analysis to estimate the most efficient configuration.
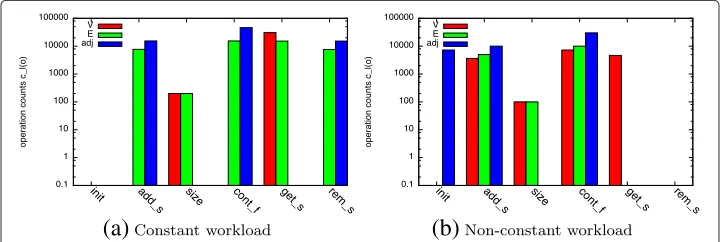
First, we compareclfor two different workload types of dynamic graphs:constantand non-constant workload. We refer to a workload asconstantin case the list sizes and opera-tion counts do not change significantly over time. In the example shown in Fig. 4a, batches only consist of a similar amount of edge removals and additions. Such a workload is char-acterized by an equal number of additions and removals toEandadjwithout additions toV. We consider a workload asnon-constantin case the list sizes or operation counts change over time. Such a workload is produced when growing a graph, i.e., adding new vertices and further interconnecting them (cf. Fig. 4b). This workload is reflected by add operations onV,E, andadjbut not a single removal.
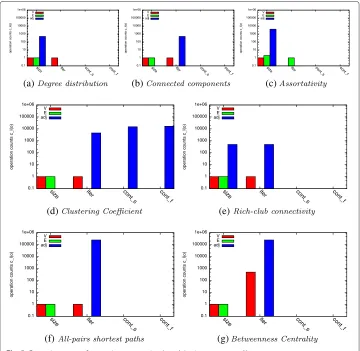
Second, we observe cl during the computation of seven metrics on an instance of a dynamic graph: degree distribution, connected components, assortativity, clustering coef-ficient, rich-club connectivity, all-pairs shortest paths, and betweenness centrality. We selected these metrics to cover all operations and their combinations commonly found in graph analysis5. To compute the degree distribution of a graph, an algorithm iterates once overVand determines the degree of each vertex using the size operation of its adjacency listadj(cf. Fig. 5a). Similar operation counts can be observed for the rich-club connec-tivity (cf. Fig. 5e) with the difference that the iteration is performed overEinstead ofV. To determine the connected components of a graph, a breadth-first search is performed by iterating overV and the adjacency listsadj(cf. Fig. 5b). All-pairs-shortest paths and betweenness centrality are computed by performing similar operations from every ver-tex resulting in a higher count (cf. Fig. 5f and g). Computing the clustering coefficient of a graph implies an iteration over all vertices and iterations over all adjacency listsadj(cf.
(a)
(b)
(a) (b) (c)
(d) (e)
(f) (g)
Fig. 5Operation counts for metric computation (o∈ {size,iter,conts,contf})
Fig. 5d). On these adjacency lists, contains operations are executed to check which neigh-bors of a vertex are connected to each other. Some of these operations fail, others are successful.
During the profiling phase, executed for each program at the beginning of our compile-time approach, the counts for graph modification as well as metric computation are recorded and used as basis for the recommendation.
Evaluation
Now, we evaluate our compile-time approach on the analysis of two real-world dynamic graphs: one that produces a constant workload (MD) and a second one that generates a non-constant workload (FB). Our analysis scripts for performing the evaluation are available as an open-source repository6.
Datasets
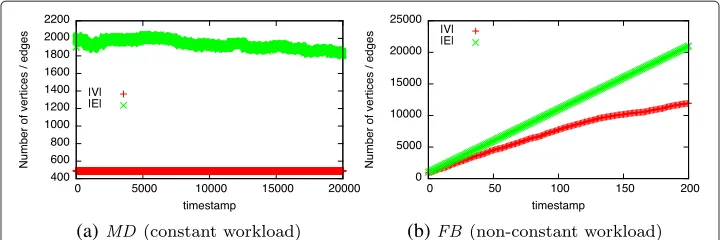
(a) (b)
Fig. 6Dataset statistics (development of|V|and|E|over time)
TheFBdataset is a friendship graph of Facebook taken from KONECT, the Koblenz Network Collection (Kunegis 2013). It represents users and their friendship relations as a list of edges sorted by the timestamp they appeared. We take the initial graph consisting of the first 1,000 edges and 898 vertices. With each batch, the next 100 edges and cor-responding vertices are added creating a non-constant workload. After 200 batches, the graph consists of 11,941 vertices and 21,000 edges (cf. Fig. 6b).
For both datasets, we create the initial graph and apply the first 20 batches. After the application of each batch one of the following metrics was computed:DD,C,RCC,ASS, SP,CC, orBC. Based on the operation countsclof the 20 batch applications and metric computations, we determine the recommended data structures forV,E, andadj.
Then, we perform the same computation with the recommended data structures, as well as configurations whereV,E, andadjare all usingArray,ArrayList,HashArrayList, HashMap,HashSet,HashTable, orLinkedList, referred to asbasic configurations. In total, we compute the properties ofMDfor all 20,000 states and the properties ofFBfor 201 states. For comparison, we compute the runtime of all seven configurations relative the configurations recommended by out approach. All results presented here are the median speedup of 50 repetitions.
Constant workload
For MD, our approach recommended the use of HashMap for E for all metrics (cf. Table 3). It recommended to use eitherArrayorArrayListforadjandArrayor HashAr-rayList forV. Since the dataset creates a constant workload, we expect that our rec-ommendation is applicable and therefore well-suited for the analysis of the complete dataset.
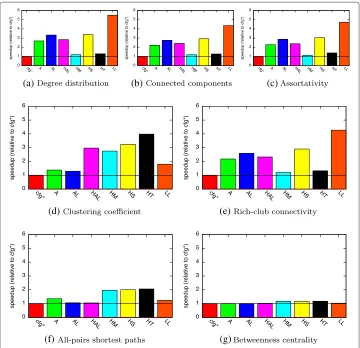
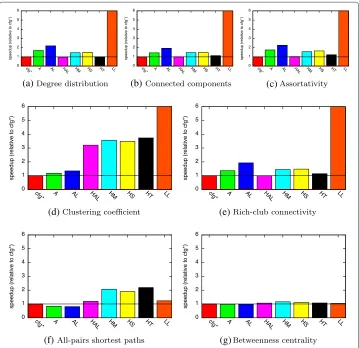
The relative speedup of our recommended configurations over all seven basic configu-rations is given in Fig. 7. Our recommended data structures achieve a speedup up to 5.4× and always outperform the basic configurations. The relative performance is very simi-lar when computing degree distribution, connected components, and assortativity. This is most probably because these three metrics have a similar access pattern to the graph (cf. Fig. 5a, b, and c). For the other metrics (CC,RCC,SP, andBC), the relative speedup greatly differs with no basic configuration outperforming the others.
Non-constant workload
Table 3Recommendations forV,E, andadjdepending on workload and computed metric
Metric Constant workload (MD) Non-constant workload (FB)
V E adj V E adj
All-pairs shortest paths A HM AL HAL HAL LL
Assortativity A HM A HAL HAL A
Betweenness centrality HAL HM AL LL HAL LL
Clustering coefficient A HM A HAL HAL AL
Degree distribution A HM A HAL HAL AL
Rich-club connectivity A HM AL HAL HAL AL
Connected components A HM AL HAL HAL AL
structure was recommended forVwhile the use of eitherArray,ArrayList, orLinkedList was proposed foradj. We consider this workload to be non-constant because the sizes ofV andEincrease with each batch. We expect that this significant change in list sizes renders the initial profiling meaningless for the far longer running analyses of all 200 batches. Based on the profiling during the first twenty batches, we assume a total number of 1, 000+20·100=3, 000 edges as input of our analysis. But after 200 batches,Egrows to a total of 21,000 elements, 7×more than the list size we assume based on our initial profiling. Therefore, we expect that the recommendations generated by our approach are
(a) (b) (c)
(d) (e)
(f) (g)
not always the best choice throughout an analysis and can be outperformed by the other configurations.
The relative speedup for the analysis ofFBfor all metrics is shown in Fig. 8. Note that the speedup forLinkedListlies between 7.5 and 245 for computingDD,C,ASS, andCC and is truncated in these plots. As for the constant workload, the relative speedups for computing degree distribution, connected components, and assortativity are similar. For all metrics, there is at least one standard configuration that closely matches the runtime of the recommended data structures. When computing all-pairs shortest paths, the stan-dard configurations with Arrayand ArrayList outperform our recommendations with only 80 % of the total runtime.
Summary of the compile-time approach
The fact that our recommended configurations outperform all other tested combinations forMD suggests that our estimation of the actual runtime based on ed,t,o is accurate and the recommendation valid for all subsequent batches. We have shown that our compile-time approach achieves speedups over basic configurations in case of a constant workload. These recommendations are based on a short profiling phase and the results independent of the duration of the analysis afterwards.
(a) (b) (c)
(d) (e)
(f) (g)
In contrast, our evaluation has shown that our compile-time approach is not always able to accelerate the analysis for all metrics when applying a non-constant workload (FB). We assume that this is because of the increase of list sizes over the complete analysis period which also affects the operation counts.
Hence, we conclude that our compile-time approach is well suited for constant but not for non-constant workloads. Therefore, we propose a run-time approach that analyzes the workload during the execution of an application and exchanges data structures accordingly to account for changes in list sizes and operation counts over time.
Run-time selection of efficient data structures
In this Section, we present a run-time approach for the selection of efficient data struc-tures for the analysis of dynamic graphs. Then, we perform a performance analysis using an artificial workload. Finally, we summarize the insights gained from the analysis.
Run-time approach
For our run-time approach, we assume that the workload (i.e., list sizes or operation counts) of an application changes drastically over time. In such a case, there is not a sin-gle data structure configuration which performs best throughout the complete execution and it would be necessary to continually change the data structures during execution for optimal performance. Based on this assumption, we propose an approach to monitor the list sizes and operation counts at run-time, use that information to make regular recom-mendations for the best configuration for the current workload, and finally exchange the data structures used to represent the dynamic graph in memory.
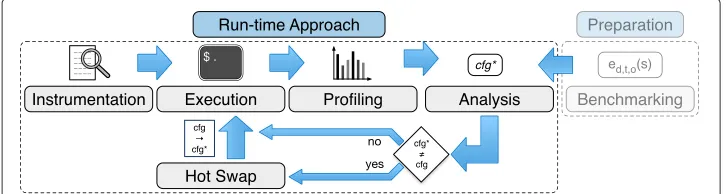
Our approach for the run-time optimization of graph data structures consists of the following components, shown in Fig. 9: instrumentation, execution, profiling, analysis, and hot swap.
The instrumentation adds capabilities to the program to record the access statistics and list sizes during execution and perform a hot swap of data structures if required. Like in our compile-time approach, the profiling component regularly generates operation counts and average list sizes. The analysis component takes these statistics as well as the cost functions generated during the benchmarking phase as input to recommend a data structure configuration. In case this recommendation differs from the currently used con-figuration, the hot swap component replaces the lists in memory with new instances of the recommended data structure. Afterwards, the execution of the program is continued.
Hot Swap In our compile-time approach, the recommended data structures are assigned
to the respective lists and the program is re-compiled. In the run-time approach, these
changes must be applied during the execution of the program. In case a new recommen-dation appears more efficient than the current one, we pause the execution and exchange the current data structures for the recommended ones. To exchange the data structure we create new instances of the recommended data structure and fill them with the ele-ments representing the current state of the graph. Afterwards, we update all references that point to the respective list.
Performance analysis
To analyz the performance of our run-time approach, we generated an artificial workload where the operations executed onVandEas well as their sizes change over time to inves-tigate how our approach performs compared to basic configuration for highly dynamic scenarios. We execute this workload for each of the 7 basic data structure configurations we used before and for our run-time approach. The run-time approach always begins execution usingArrayas the data structure for all lists. For each execution, we measure the runtime for processing the workload as well as the overhead of recommending data structures and exchanging them.
Workload and execution To understand the characteristics of the performance in detail,
we designed a synthetic workload. It consists of 4 separate steps, each of which is applied first toVand thenE, resulting in a total of 8 different operations on the data structures:
1. cont:V, cont:E -100kcontains operations of random elements 2. get:V, get:E -100kget operations of random elements 3. iter:V, iter:E -10kiterations over all elements
4. add:V, add:E -1kadditions of new elements
Each of these individual operations is performed 10 times before moving on to the next, forming a round consisting of 80 operations. We execute 4 such rounds, leading to a total of 320 separate operations.
We start such an execution with a random graph consisting of 10kvertices and edges. We then applyadd:V andadd:E10 times at the end of each round, leading to a final list size of 50kelements once the workload has finished executing (cf. Fig. 10).
All runtimes shown in the following are the average of 50 repetitions.
Basic configurations The runtimes for executing a single round of the workload using
the seven basic configurations are shown in Fig. 11a.
As the sizes ofV andEdo not change during the execution ofcont,get, anditer, their runtimes only depend on the data structure used but remain similar for all repetitions. In contrast, each application ofadd:V andadd:Eincreases the respective list size by 1k leading to an increase in their runtime with each repetition.
As indicated by our benchmarks, array-based data structures (Array, ArrayList, HashArrayList) are most efficient for the execution ofcont:V,get:V, anditer:V. Foradd:V, hash-based data structures (HashArrayList,HashSet,HashTable) perform best.
For operations executed on E, the results are more diverse: While HashArrayList, HashMap, and HashSet are the best choices when executing cont:E, HashMap is the fastest data structure for obtaining elements (get:E). When executing iter:E, ArrayList
(a)
(b)
performs best. When adding elements, all hash-based data structures (HashArrayList, HashMap,HashSet,HashTable) outperform the others.
HashArrayListalways performs well when eitherHashSetor ArrayListdo so. This is expected becauseHashArrayListtakes advantage of their respective benefits to execute these operations and shows the usefulness of this combined data structure.
Run-time approach The best data structure for the execution of an operation depends
on the element type and its size. Therefore, the data structures recommended by the analysis component of our run-time approach should change accordingly as the artificial workload is executed. These recommendations, depending on operation, element type, and size are shown in Table 4.
Our approach correctly recommends the data structure which ran the fastest during the execution using the basic configurations (cf. Fig. 11a): For all investigated list sizes,Array is recommended for the execution ofcont:V andget:V. When executingget:V,ArrayList is proposed andHashSetfor adding vertices (add:V). When obtaining elements fromE (get:E),HashMapis recommended for all sizes. For the execution ofcont:E,HashArrayList is recommended for list sizes below 20kwhileHashSetis selected for larger ones. Simi-larly,Arrayis recommended for executingiter:Eon lists with 30kand more elements but ArrayListfor smaller ones. When executingadd:E, the recommendation changes during the second round:HashSetis recommended for|E| ≤21kandHashMapfor larger ones. The runtimes of our run-time approach (denoted asRT) for executing a single round of this workload are shown in Fig. 11b. Our approach achieves runtimes consistent with the expectation of following our recommendation of the fastest basic configuration (cf. Fig. 11a). The only anomaly introduced in the run-time approach are spikes that can occur on the first execution of each operation batch. The reason for this behavior is that we have to execute a new operation at least once on the old data structure before we can recognize that swapping the data structure would be beneficial. For example, take the execution of get:E: During the first execution of this operation,Eis still stored inHashSet, the best choice for the previously executedcont:E. During this first execution, the accessed oper-ations are recorded by the profiling component and used by the analysis component to recommend a data structure that is best suited for this new workload. Afterwards, the hot swap component replaces these data structures with the recommended ones which leads to the performance improvement for the following executions.
When using our run-time approach, overhead is produced by the recommendation of data structures and the regular execution of the hot swap component. The cumulative overhead of these two operations for all 4 runs is shown in Fig. 12. At a total execution time using our run-time approach of 821.24sec, this overhead accounts for 6, 11 %. The overhead is composed of the time for recommending data structures (18.82sec, 2.29 %) and hot swap (31.38sec, 3.82 %).
Table 4Recommended data structures (for workload and set size, underlined: swap required)
list size cont:V get:V iter:V add:V cont:E get:E iter:E add:E
10k A A AL HS HAL HM AL HS
20k A A AL HS HS HM AL HS, HM
30k A A AL HS HS HM A HM
Fig. 12 Overhead of run-time approach (consisting of hotswap and recommendation)
Comparison For the artificial workload, our approach, including its overhead, achieves
a speedup over all basic configurations (cf. Fig. 13). The fastest runtime of a basic config-uration is achieved byHashArrayListwith a speed of 1.12. This is not surprising as this data structure combines the benefits ofHashSetandArrayListboth of which are also rec-ommended by our approach. The highest speedup of 7.34 is achieved in comparison to the basic configuration usingHashSetfor all lists.
Summary of the run-time approach
We proposed a run-time approach for recommending and exchanging the data struc-tures used to represent a dynamic graph in memory. We evaluated our approach using an artificial, regularly changing workload. Our approach outperformed basic configurations by up to 7.34×. This shows that in scenarios where the workload behavior changes over time, our approach has the potential to achieve significant performance improvements for the analysis of dynamic graphs. Some questions, however, remain open and need to be investigated in future work:
What is the best recommendation given a realistic execution history? We currently assume that any overhead is justified when making our recommendation, which is obvi-ously not a generally valid assumption. The problem of determining whether a system has shifted its workload sufficiently that the cost of the overhead of swapping data
structures is outweighed by the performance gain of a faster data structure is not triv-ial. This problem can be broken up into several sub-problems: How can the difference between a dynamic system changing its behavior and just making a few anomalous requests be determined? We currently assume that a realistic application of dynamic graph analysis will not erratically change its workload, but rather stay consistent to a slowly changing usage profile. We believe that this assumption is valid and sup-ported by real world data, but the degree of consistency and the velocity of overall change varies from application to application. Determining these factors is critical in order to answer the above question and make an accurate recommendation. How much information should be taken into account when making our recommendations? This question pertains to how much of the execution history is relevant for our recommen-dation. On the one hand, correct processing of more information can never make the result less accurate, on the other hand taking into account too much information might make the system inflexible over time and significantly increase the overhead of our recommendation.
It may not be avoidable to use a certain degree of machine learning to make the best recommendation due to the sheer number and complexity of the involved variables.
On a lower level, closer to the implementation of data structures themselves, it should be investigated how the actual exchange of data structures can be improved. Instead of treating the swap between any two data structures over the same interfaces, more efficient ways to swap between specific data structures should be investigated.
Summary, conclusion, and outlook
In this work, we considered the problem of finding the most efficient data structures for representing a graph for the application of dynamic graph analysis.
We proposed a compile-time approach for optimizing these data structures. As a case study, we performed a measurement study of seven data structures, fitted estimation functions from the results, implemented our approach on top of a Java-based frame-work for dynamic graph analysis, and evaluated it using real-world datasets. Our results show that our optimization achieves speedups of up to 5.4×over basic configurations on real-world datasets.
The data structure configuration proposed by our approach outperformed all seven default configurations for the computation of all metrics for a constant workload. For non-constant workloads, we achieved speedups in many but not all cases. Thereby, our approach is well-suited for improving the analysis of dynamic graphs with a constant workload but not capable of adapting to the drastic changes of list sizes that can occur in non-constant workloads.
To close this gap, we developed a new run-time based approach for the adaptation of graph data structures during the execution of an application. We analyzed the perfor-mance of our approach using a synthetic workload designed to capture most operations and generate a non-constant workload. In this scenario, our approach performed as expected and achieved speedups over basic configuration of up to 7.3×.
Endnotes
1http://gnuplot.sourceforge.net
2https://github.com/BenjaminSchiller/DNA.gdsMeasurements
3http://bit.ly/1UT9pnX
4https://github.com/BenjaminSchiller/DNA
5We omitted the computation of motif frequencies used in previous work because
the resulting operation counts and runtimes are very similar to those observed for the clustering coefficient.
6https://github.com/BenjaminSchiller/DNA.gdsAnalysis
Acknowledgements
This work is partly supported by the German Research Foundation (DFG) within the Cluster of Excellence “Center for Advancing Electronics Dresden” (cfaed) and the Collaborative Research Center (SFB 912) “Highly Adaptive Energy-efficient Computing” (HAEC).
Availability of supporting data
The source code for all components are available in open-source repositories on GitHub. DNA Framework including compile- and run-time approach.
https://github.com/BenjaminSchiller/DNA. Sources for performing the measurement study:
https://github.com/BenjaminSchiller/DNA.gdsMeasurements. Sources for performing the performance evaluation: https://github.com/BenjaminSchiller/DNA.gdsAnalysis.
Authors’ contributions
BS developed the proposed approaches, implemented them, carried out the measurement study and the performance analysis, interpreted the results, and drafted the outline. CD implemented the function fitting component and aided in interpreting the results from the performance analysis. JC outlined the components of both approaches and formalized them using a common notation. TS drafted the outline and aided in the setup and evaluation of both approaches. All authors read and approved the final manuscript.
Competing interests
The authors declare that they have no competing interests.
Author details
1Privacy and Data Security, Department of Computer Science, TU Dresden, Nöthnitzer Straße 46, 01187 Dresden, Germany.2Chair for Compiler Construction, Department of Computer Science, TU Dresden, Georg-Schumann-Straße 7A, 01187 Dresden, Germany.
Received: 9 February 2016 Accepted: 25 July 2016
References
Ambedkar C, Reddi KK, Muppalaneni NB, Kalyani D (2015) Application of centrality measures in the identification of critical genes in diabetes mellitus. Bioinformation 11(2):90
Bader DA, Madduri K (2008) Snap, small-world network analysis and partitioning: an open-source parallel graph framework for the exploration of large-scale networks. In: Parallel and Distributed Processing, 2008. IPDPS 2008. IEEE International Symposium on. IEEE. pp 1–12
Bader DA, Berry J, Amos-Binks A, Chavarría-Miranda D, Hastings C, Madduri K, Poulos SC (2009) Stinger: Spatio-temporal interaction networks and graphs (sting) extensible representation. Georgia Institute of Technology, Tech. Rep Batagelj V, Mrvar A (1998) Pajek-program for large network analysis. Connections 21(2):47–57
Blandford DK, Blelloch GE, Kash IA (2003) Compact representations of separable graphs. In: Proceedings of the fourteenth annual ACM-SIAM symposium on Discrete algorithms. Society for Industrial and Applied Mathematics. pp 679–688 Blandford, DK, et al. (2004) Experimental analysis of a compact graph representation
Braha D, Bar-Yam Y (2009) Time-dependent complex networks: Dynamic centrality, dynamic motifs, and cycles of social interactions. In: Adaptive Networks. Springer. pp 39–50
Candau S, Bastide J, Delsanti M (1982) Structural, elastic, and dynamic properties of swollen polymer networks. In: Polymer Networks. Springer. pp 27–71
Chabini I (1998) Discrete dynamic shortest path problems in transportation applications: Complexity and algorithms with optimal run time. Transportation Research Record: J Transp Res Board 1645:170–175
Ciglan M, Averbuch A, Hluchy L (2012) Benchmarking traversal operations over graph databases. In: Data Engineering Workshops (ICDEW), 2012 IEEE 28th International Conference on. IEEE. pp 186–189
De Wael M, Marr S, De Koster J, Sartor JB, De Meuter W (2015) Just-in-time data structures. In: 2015 ACM International Symposium on New Ideas, New Paradigms, and Reflections on Programming and Software (Onward!). ACM. pp 61–75 Dmitriev M (2004) Profiling Java applications using code hotswapping and dynamic call graph revelation. In: ACM
Ediger D, Jiang K, Riedy J, Bader DA (2010) Massive streaming data analytics: A case study with clustering coefficients. In: Parallel and Distributed Processing, Workshops and Phd Forum (IPDPSW), 2010 IEEE International Symposium on. IEEE. pp 1–8
Ediger, D, McColl R, Riedy J, Bader DA (2012) Stinger: High performance data structure for streaming graphs. In: High Performance Extreme Computing (HPEC), 2012 IEEE Conference on. IEEE. pp 1–5
Gonçalves KC, Vieira AB, Almeida JM, da Silva APC, Marques-Neto H, Campos SVA (2012) Characterizing dynamic properties of the SopCast overlay network. In: 2012 20th Euromicro International Conference on Parallel, Distributed and Network-based Processing. IEEE. pp 319–326
Hunt C, John B (2011) Java performance. Prentice Hall Press
Jung C, Rus S, Railing BP, Clark N, Pande S (2011) Brainy: effective selection of data structures. In: ACM SIGPLAN Notices. ACM Vol. 46. pp 86–97
Kiczales G, Hilsdale E, Hugunin J, Kersten M, Palm J, Griswold WG (2001) An overview of AspectJ. In: European Conference on Object-Oriented Programming. Springer. pp 327–354
Kossinets G, Watts DJ (2006) Empirical analysis of an evolving social network. Science 311(5757):88–90
Kunegis J (2013) Konect: the koblenz network collection. In: Proceedings of the 22nd International Conference on World Wide Web. ACM. pp 1343–1350
Luk CK, Cohn R, Muth R, Patil H, Klauser A, Lowney G, Wallace S, Reddi VJ, Hazelwood K (2005) Pin: building customized program analysis tools with dynamic instrumentation. ACM Sigplan Notices 40(6):190–200
Madduri K, Bader DA (2009) Compact graph representations and parallel connectivity algorithms for massive dynamic network analysis. In: Parallel & Distributed Processing, 2009. IPDPS 2009. IEEE International Symposium on. IEEE. pp 1–11
Malewicz G, Austern MH, Bik AJC, Dehnert JC, Horn I, Leiser N, Czajkowski G (2010) Pregel: a system for large-scale graph processing. In: Proceedings of the 2010 ACM SIGMOD International Conference on Management of data. ACM. pp 135–146
Marti J (2000) Dynamic properties of hydrogen-bonded networks in supercritical water. Phys Rev E 61(1):449
Broder A, Kumar R, Maghoul F, Raghavan P, Rajagopalan S, Stata R, Tomkins A, Wiener J (2009) Graph structure in the web. Comp Net. 33(1):309–320
Mucha PJ, et al. (2010) Community structure in time-dependent networks. Science 1:12011
Macko P, et al. (2014) Llama: Efficient graph analytics using large multiversioned arrays. PhD thesis. In: Ph. D. Dissertation. Harvard University
Schiller B, Strufe T (2013) Dynamic network analyzer building a framework for the graph-theoretic analysis of dynamic networks. In: Proceedings of the 2013 Summer Computer Simulation Conference. Society for Modeling & Simulation International. p 49
Schiller, B, Castrillon J, Strufe T (2015) Efficient data structures for dynamic graph analysis. In: 2015 11th International Conference on Signal-Image Technology & Internet-Based Systems (SITIS). IEEE. pp 497–504
Schiller B, Jager S, Hamacher K, Strufe T (2015) StreaM-A Stream-Based Algorithm for Counting Motifs in Dynamic Graphs. In: International Conference on Algorithms for Computational Biology. Springer. pp 53–67
Shirazi J (2003) Java performance tuning. O’Reilly Media, Inc.
Shacham O, Vechev M, Yahav E (2009) Chameleon: adaptive selection of collections. In: ACM Sigplan Notices. ACM Vol. 44. pp 408–418
Sun J, Xie Yinglian, Zhang H, Faloutsos C (2007) Less is More: Compact Matrix Decomposition for Large Sparse Graphs. In: SDM. SIAM. pp 366–377
Trequattrini R, et al. (2015) Network analysis and football team performance: a first application. In: Team Performance Management
Xu G (2013) CoCo: sound and adaptive replacement of java collections. In: European Conference on Object-Oriented Programming. Springer. pp 1–26
Zhao P, Nackman SM, Law CK (2015) On the application of betweenness centrality in chemical network analysis: Computational diagnostics and model reduction. Combustion and Flame 162(8):2991–2998
Submit your manuscript to a
journal and benefi t from:
7Convenient online submission
7Rigorous peer review
7Immediate publication on acceptance
7Open access: articles freely available online
7High visibility within the fi eld
7Retaining the copyright to your article
![Fig. 3 Selected runtime estimations (fitted functions ed,t,o with median of 50 measurements md,t,o) for listsizes s ∈[ 1, 100]](https://thumb-us.123doks.com/thumbv2/123dok_us/832149.1580762/8.595.117.478.83.591/selected-runtime-estimations-fitted-functions-median-measurements-listsizes.webp)