R E S E A R C H
Open Access
Quantifying the diaspora of knowledge in
the last century
Manlio De Domenico
*, Elisa Omodei and Alex Arenas
*Correspondence: [email protected] Departament d’Enginyeria Informàtica i Matemàtiques, Universitat Rovira i Virgili, Av.da Països Catalans, 26, 43007, Tarragona, Spain
Abstract
Academic research is driven by several factors causing different disciplines to act as “sources” or “sinks” of knowledge. However, how the flow of authors’ research interests – a proxy of human knowledge – evolved across time is still poorly understood. Here, we build a comprehensive map of such flows across one century, revealing
fundamental periods in the raise of interest in areas of human knowledge. We identify and quantify the most attractive topics over time, when a relatively significant number of researchers moved from their original area to another one, causing what we call a “diaspora of the knowledge” towards sinks of scientific interest, and we relate these points to crucial historical and political events. Noticeably, only a few areas – like Medicine, Physics or Chemistry – mainly act as sources of the diaspora, whereas areas like Material Science, Chemical Engineering, Neuroscience, Immunology and
Microbiology or Environmental Science behave like sinks.
Keywords: Human knowledge, Diffusion, Complex networks, Interconnected
networks, Big data
Introduction
Nowadays, the research carried out by academics in all areas of human knowledge is heavily driven by exogenous factors, such as allocation of funding resources or political interests (Boyack and Börner 2003; Ma et al. 2015). Two decades ago, pioneering stud-ies by Etzkowitz and Leydesdorff already put in evidence the importance of relationships between university, industry and government (Etzkowitz and Leydesdorff 1995; Leydes-dorff and Etzkowitz 1998; Etzkowitz and LeydesLeydes-dorff 2000), a “triple helix” that shapes and drives the development of knowledge, impelling researchers to change research inter-ests or their institution (Boyack et al. 2005; Leydesdorff and Rafols 2009; Deville et al. 2014). The structure and evolution of human knowledge has been extensively investi-gated by observing, for instance, how academics tend to choose their co-authors, or they physically move between different research institutions, within the same field or to a different department (Vlach`y 1981; Le Pair 1980; Etzkowitz and Leydesdorff 1995; Leydesdorff and Etzkowitz 1998; Etzkowitz and Leydesdorff 2000; Shiffrin and Börner 2004; Börner et al. 2004; Boyack et al. 2005; Leydesdorff and Rafols 2009; Deville et al. 2014; Ke et al. 2015; Sinatra et al. 2015; Gargiulo et al. 2016). These analyses, often based on citation patterns among authors, institutions, papers or journals, allow to understand how disciplines are related to each other in terms of scientific production
and impact, but are not intended to quantify the flow of knowledge in science or to iden-tifying crucial periods for the development of human knowledge. In fact, the interest of researchers are often driven by currently available funding opportunities or by polit-ical choices, an emblematic example being the investments in nuclear physics during the World War II. Such factors, often external to the context of academy research, act as catalysts pushing researchers to leave their current area of interest towards different areas.
To study this phenomenon of “knowledge diaspora”, we consider the Microsoft Academic Graph, a data set of more than 35,000,000 of papers published in more than 21,000 different journals in the last 100 years. To trace the changes in research interests of every author in the data set across time, i.e. from one temporal snapshot to the successive,
we count how many authors published in topic A at timeτ and in the same or a different
topic B at timeτ +τ (see Appendix). The volume of authors linking topics defines an
evolving network of connections among topics, i.e. a multilayer (time-varying, weighted and directed) network (Holme and Saramäki 2012; Kivelä et al. 2014; De Domenico et al. 2013; Boccaletti et al. 2014). The same procedure has been also applied to the coarser level of areas (see “Overview of the data set” section for details). The structure of these dynam-ical multilayered networks, described in “Multilayer network model” section, encodes the publishing temporal dynamics of academics who change their research interests across knowledge topics and areas, respectively. In the following we will simply refer to these structures using the term network, avoiding to specify that they are time-varying and multilayer.
Overview of the data set
Details about data filtering
The Microsoft Academic Graph is a heterogeneous graph containing scientific publi-cation records, citation relationships between those publipubli-cations, as well as authors, institutions, journals and conference “venues” and fields of study (Sinha et al. 2015). We
used the latest publicly available updated version (31 August 2015) of this data set1 in
our study. However, our careful inspection of the data did not allow us to use the accom-panying classification of papers into fields of study. The first obstacle was the number of different keywords classifying the papers: tens of thousands of categories providing a scheme too fine-grained for our study. A reduction of such keywords into more gen-eral topics would require machine learning and heuristics that would introduce other uncontrollable bias in the resulting classification. The second obstacle was the unclear mechanisms adopted to assign one or more keywords to each paper. In fact, we have found many misclassified papers, an emblematic case being a paper about Agricultural Science that has been classified in several topics, among which General Relativity. Instead, we gathered data from an external (publicly available) source. More specifically, we used
SCImago Journal and Country Rank in 20142to classify journals into 306 distinct research
topics and 27 unique knowledge areas. Successively, we filtered out from the Microsoft Academic Graph data set all the papers that were not published in journals, thus excluding other venues such as conferences, and in particular we filtered out those papers published in journals that were not found in the SCImago classification. More than 35 millions of papers survived this filtering procedure, representing a promising 28.7% of the original data set, and more than 60% of the original number of papers published only in journals (thus excluding conferences and other venues). The number of different journals match-ing the SCImago data set was 21,729, and we report in Table 1 some information about the distribution of their multiplexity, i.e. the number of different topics and areas where they are classified. Finally, it is worth remarking that we further reduced the dataset to avoid the effects of non-disambiguated authors. More specifically, we built the distribu-tion of the number of papers per year of each author and we focused on the 99.9%-quantile distribution, i.e. we excluded the 0.1% of authors. This choice excluded all the names who authored more than 17 journal papers per year, the rational being that names with
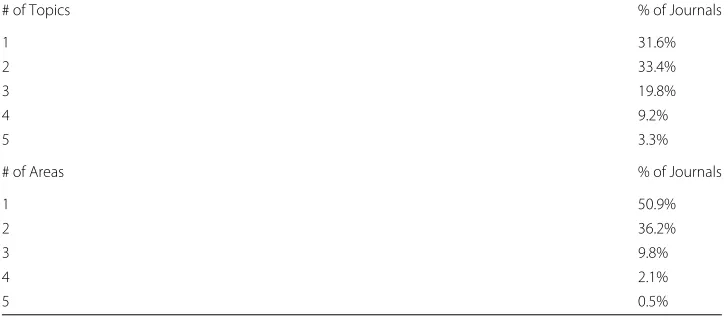
Table 1Multiplexity of journals with respect to topics and areas. We report the percentage of journals
that are classified by SCImago in exactly 1, 2, ...,etc, topics (areas). Only statistics for the top five are
reported, with rapidly decreasing percentage of journals classified in more than five topics (areas)
# of Topics % of Journals
1 31.6%
2 33.4%
3 19.8%
4 9.2%
5 3.3%
# of Areas % of Journals
1 50.9%
2 36.2%
3 9.8%
4 2.1%
a higher number of papers per year probably corresponds to different authors having the same name. We used authors’ full name, including middle initials if present, to disam-biguate. We did not merge different authors with identical names during this procedure. The author name disambiguation method proposed, despite its simplicity, is designed to efficiently work on a dataset composed of more than 35 million papers and over 123 million author names. Existing methods proposed in the literature, which exploit similar-ity metrics based on co-authorship and co-citation (Deville et al. 2014; Kang et al. 2009; Schulz et al. 2014), are arguably more precise but, applied to the present dataset, would require a computation time optimization out of the scope of this paper.
Multilayer network model
The data set used in our study contains a huge amount of information about published papers and their authors. We focused on specific subsets of the data, including author name, the papers he/she published, the journal where they have been published and the publishing year. Thanks to the SCImago classification of areas of knowledge, we were able to assign one or more topics to each journal. Thus, we built a tripartite time-varying
multilayer networkG where for each temporal snapshotτ, a tripartite multiplexMis
considered. Each multiplex is composed by layersL– identifying topics or areas of
knowl-edge, depending on the application of interest – where there are three types of nodes: authors (A), papers (P) and journals (J). One or more authors are linked to the paper(s) they co-authored that, in turns, are linked to the journal where they have been published, resulting in a bipartite network linking nodes of type A to nodes of type P, and a bipartite network linking, at the same time, nodes of type P to nodes of type J. If a journal is clas-sified in more than one topic or area, the links are replicated accordingly across layers. The resulting network is tripartite, because three types of nodes are involved, and mul-tiplex, because nodes are replicated on different layers. For our purposes, we aggregated
the tripartite network in each layerl∈Lwith respect to papers, in order to obtain
multi-plex bipartite networks of authors and journals only, for each temporal snapshot. Finally, each node is inter-connected to its replicas in other layers and temporal snapshots. The
mathematical representation (De Domenico et al. 2013; Kivelä et al. 2014) ofGis a rank-6
tensorGαβγδ˜˜φ¯¯, where indices(,¯ φ)¯ identify the temporal snapshot,(γ˜,δ)˜ identify the layers
and(α,β)identify the nodes.
This complex network, however, is not the final object we worked with. In fact, our analysis is more focused on changes in publication patterns across years. Mathematically, this means that we are more interested in the links between authors and journals exhibit between one temporal snapshot and the successive, i.e. in inter-layer links with respect to
time. We derived a more suitable time-varying multilayer networkHfromGas follows.
LetAibe thei−th node of type A (i.e. authors) andJk be thek−th node of type J (i.e.
journals), regardless of topics (areas) classification and time. InG, a link betweenAiand
Jkin layerlat timeτ exists ifGklilττ >0. Similarly, if in the successive snapshotτ> τ the
same authorAiis linked to journalJk(kcan be the same ask) in layerl(lcan be the same
asl), thenGilkτlτ >0. Clearly, an author might publish papers on different topics or areas
at timeτ but he/she will be, in general, more active on one or a few more. For this reason
for each snapshot, we will consider only the layer where the author has been more active,
i.e. whereGilklττ is maximum with respect tol(note that if there is more than one layer
filter is justified by the fact that, on average, the research activity of an individual is mainly focused on a single topic, rather than many ones simultaneously. While there are many researchers who produce at least one paper in more than one research topic or area in a certain temporal window, in this work we are investigating the changes related to the topic or area where they are more active. Nevertheless, it is worth remarking that statistical fluctuations might bias, partially, the estimation of some flows and a possible solution to
this issue will be explored in a successive study. We will indicate bylsuch layers. The
components of the tensor representingHthat encode inter-snapshot connections, are
defined by
Hililττ =
Gilklττ
×Gkillττ
, (1)
i.e. an interconnection between an author at timeτ and his/her replica at timeτ > τis
present if and only if the author published at timeτ and at timeτ. It is worth
remark-ing that the replicas beremark-ing linked are defined on layers l at time τ and l at time
τ, thus also connecting (possibly different) topics or areas across time. The presence
of Heaviside step function (·) is to guarantee that each author is counted just once
at this step, regardless if he/she produced more papers. It is evident that information about the flow of authors moving from one knowledge topic (or area) to another across time is only encoded in inter-snapshot connections among author’s replicas, whereas the presence of journals as nodes is no more required, as well as intra-snapshot links,
i.e. connections within the same temporal snapshot. Therefore, the tensorH
represent-ingHis defined on a smaller tensorial space with respect toG, because nodes are just
authors instead of authors and journals. Moreover, it is also extremely sparse and, in fact, it can be further aggregated without loss of information, because of the absence of intra-snapshot links, by projecting the tensor into the space of topics (or areas) and time, getting rid of information about authors (see Appendix for details about this step).
The resulting tensorMγδ˜˜φ¯¯, that is the one we used in our analysis, represents a
multi-layer network where nodes are topics (or areas), identified by indices(γ˜,δ)˜ , and layers
are temporal snapshots, identified by indices (¯,φ)¯ . Intra-layer links, i.e. connections
among topics within the same temporal snapshot, are not present, whereas inter-layer links among topics encode the underlying flow of authors during consecutive periods of time.
Results
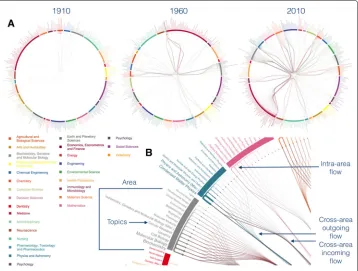
To gain the first insights about the knowledge diaspora across topics, we developed an ad hoc visualization (see Appendix) to put in evidence, for each topic, the intricate web of flows of authors incoming from and outgoing to other topics.
Fig. 1Flow network of knowledge diaspora. Points on the circle indicate topics (fine-grained knowledge representations) that are colored according to their SCImago area (coarse-grained knowledge representations), represented by thick sectors, whose color legend is reported. Two topics are connected if at least one author at timeτswitched from one to another 5 years later.aFlow of authors moving his/her research activity from one topic to others across time.bHow to read this visualization: switches between topics of the same area, namely “intra-area flows”, are represented as ‘U” shaped links close to sectors, to distinguish them from “cross-area flows”. The outgoing flow is colored by the area of origin. The width of edges is proportional to the observed flow. See Appendix for more details about topics classification and this type of visualization
The map of knowledge diaspora shown in Fig. 1 allows to get qualitative insight about this phenomenon, although it does not allow to quantify, for instance, the raise of research interest in specific topics. We will focus first our study on the emergence of topics of interest, by analyzing the variation of their incoming flows. To this aim, we quantify the
attractiveness of a topict through timeδt(τ), by tracking the evolution of the relative
changes in the volume of authorsVtt(τ)incoming from all other topicst = t, at each
temporal snapshotτ:
δt(τ) = 1
Nt−1
t=t
Vtt(τ)−Vtt(τ−5 years)
Vtt(τ−5 years)
, (2)
beingNt = 306 the total number of topics considered. For each topic, it quantifies the
average net relative change in the incoming flow. This parameter is sensitive to changes in the flow from one topic to another, even when this flow is rather small compared to the total incoming flow. Indeed, it might happen that a topic attracts a small flow of authors from many other topics or a huge flow of authors from a rather small set
of other topics. The parameter δt(τ) would detect both patterns and assign a similar
the overall incoming flow per topic, are not able to capture this type of patterns, that would be inevitably hidden by larger flows with possibly less significant relative variations over time.
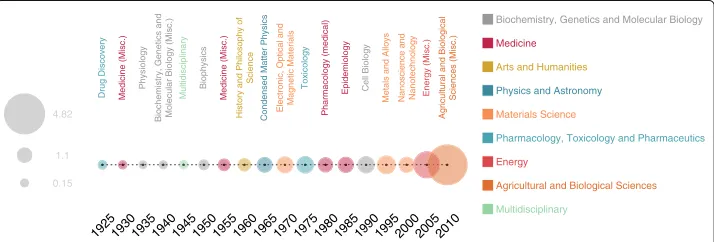
For each snapshotτ separately, we look for the most attractive topic, the one with
the highest value of δt(τ). The results, shown in Fig. 2, reveal intriguing
correspon-dences with historical or political events. For instance, between ’60s and ’70s the study of physical properties of liquids was officially included in solid state physics, to form the basis of Condensed Matter, name adopted in that period to redirected into one com-mon field those physicists who were previously working on simple and complex matter (Martin 2015).
Another interesting case is represented by Nanotechnology, with a significant activ-ity change between 2000 and 2004, following the Nobel Prize in Chemistry won by Harry Kroto, Richard Smalley, and Robert Curl for the discovery of fullerenes. Fundamentals in many technological applications, fullerenes attracted a large num-ber of researchers from –Statistics and Probability–, –Modeling and Simulation– and –Computer Science Applications–, when the new National Nanotechnology Initiative (http://www.nano.gov/) was officially proposed (1999) and the US President
Bill Clinton declared a budget worth $500 million to support it (January 20003),
thus justifying the diaspora from many other disciplines to –Nanoscience and Nanotechnology–. The case of –Agricultural and Biological Sciences (Misc.)–,
exhibit-ing the largest value of δt(τ) between 2010 and 2014, especially attracted our
atten-tion. A deeper analysis, revealed the presence of an increasing significant flow of researchers incoming from –Energy (Misc.)– who moved their publications towards in journals pertaining to agricultural and biological sciences, with research about genetically modified organisms, synthesis of biomolecules, biofuels, food systems and bioenergy.
After the fine-grained analysis at the level of topics, we focus on the analysis at the coarse-grained level of areas. For the analysis at the area level we need to define
the intra-area flow as the volume of authors Va[intra](τ) that keep publishing in the
same area a over successive temporal snapshots. The overall cross-area incoming
flow Va[to](τ) is defined as the volume of authors who publish in area a at time
1950195519601965197019751980198519901995200020052010 19401945
192519301935
Biophysics
Medicine (Misc.)
History and Philosophy of
Science
Condensed Matter Physics
Electronic, Optical and Magnetic Materials
Toxicology
Pharmacology (medical)
Epidemiology Cell Biology
Metals and Alloys Nanoscience and Nanotechnology Energy (Misc.)
Agricultural and Biological
Sciences (Misc.)
Biochemistry, Genetics and Molecular Biology (Misc.)
Multidisciplinary
Drug Discovery Medicine (Misc.)
Physiology
Biochemistry, Genetics and Molecular Biology
Medicine
Arts and Humanities
Physics and Astronomy
Materials Science
Pharmacology, Toxicology and Pharmaceutics
Energy
Agricultural and Biological Sciences
Multidisciplinary
0.15 1.1 4.82
τ coming from other areas. Finally, the overall cross-area outgoing flow Va[from](τ)
is defined as the volume of authors in area a that publish in other areas at time
τ. These measures allow to investigate many aspects of the diaspora, characterizing
the role played by different areas in the evolution of human knowledge. We intro-duce two local descriptors, namely the immigration and the emigration indices defined by
ιa(τ) = Va[to](τ)
Va[intra](τ)+Va[to](τ)
(3)
a(τ) = Va[from](τ)
Va[intra](τ)+Va[from](τ)
, (4)
respectively, characterizing the diaspora from a local perspective, i.e. in terms of relative
variations with respect only to the existing population of authors working in the areaa.
These indices range from 0 – characterizing areas where the incoming (outgoing) flow of immigrating (emigrating) authors is negligible with respect to the existing authors popula-tion in the area – to 1 – indicating areas where the existing authors populapopula-tion is negligible with respect to the incoming (outgoing) flow of immigrating (emigrating) authors. How-ever, these two local indices alone, do not allow to gain global insight about the diaspora from sources and to sinks of knowledge. For instance, such indices do not allow to under-stand if areas like –Physics and Astronomy–, –Mathematics– or –Computer Science–, producing academics whose modeling and abstraction skills make them suitable for chal-lenging problems in other disciplines, act as global sources of the diaspora or not. In fact, it might happen that even if academics from these areas are commonly perceived to be very multidisciplinary, their flow with respect to the intra-area flow of authors could be rather small. To this aim we introduce two global descriptors, namely the sink and source indices defined by
ρa(τ) = Va[to](τ)
a
Va[to] (τ)
(5)
σa(τ) = Va[from](τ)
a
Va[from] (τ)
, (6)
respectively. As before, such indices range from 0 – indicating areas where the incoming (outgoing) flow of authors is negligible with respect to the overall incoming (outgo-ing) flow – to 1 – characterizing areas where the incoming (outgo(outgo-ing) flow of authors dominates the overall incoming (outgoing) flow.
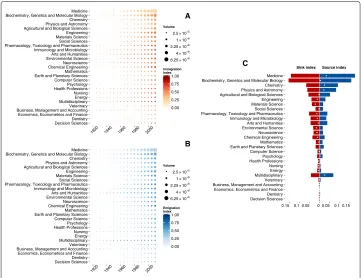
Fig. 3Incoming and outgoing flows from and to knowledge areas across time. Immigration (panela) and emigration (panelb) index (see Eq. 2 and 3) of each area calculated for each temporal snapshot. Here, 0 indicates that the incoming (outgoing) flow of immigrating (emigrating) authors is negligible with respect to the existing authors population in the area, and 1 that the existing population is negligible with respect to the incoming (outgoing) flow of immigrating (emigrating) authors. Size of circles are proportional to the volume of authors in each area, and areas are ordered according to their overall volume over time.cMedian sink (left, red boxes) and source (right, blue boxes) index (see Eq. 4 and 5) calculated for each area. Both range from 0 – indicating areas where the incoming (outgoing) flow of authors is negligible with respect to the overall incoming (outgoing) flow – to 1 – characterizing areas where the incoming (outgoing) flow of authors dominates the overall incoming (outgoing) flow.White dotsindicate the difference between the two indicators, to better put in evidence the one with higher value
have undergone a transition and started to both attract researchers from and provide researchers for other areas, such as Computer Science and Environmental Science. In the two decades between ’50s and ’70s manypublic and governmental research institutions invested on technological and theoretical investigation attracting, among others, math-ematicians, physicists, philosophers and engineers. During the same years, the raise of Artificial Intelligence, required cross-disciplinary research at the edge of philosophy of mind, electrical engineering, neurophysiology, social intelligence and applied math-ematics, to cite a few. In parallel, an inverse flow begun as well when a variety of disciplines started to take advantages of the new tools and methods provided by this area, like for example the emerging field of Digital Humanities. In the case of Envi-ronmental Science, the diaspora coincides with the revolution of the field in the ’60s. In fact, the environmental movements born in that period to protest against
chemi-cal companies led to the creation of the U.S. Environmental Protection Agency4 and
for each area separately, which give instead a global perspective of incoming and out-going flows. The choice of the median, instead of other statistical descriptors, is due to the skewness of the underlying distributions. This allows to see that fields like Medicine and Physics, that seem isolated when analyzed locally, actually serve as sinks and sources of the knowledge diaspora. This means that, even though most research in these areas is carried out by authors who are already in the field, their contribution to the overall flow of knowledge is very relevant. In particular, both areas serve mostly as source of the diaspora, supplying other areas with researchers importing new methods and tools.
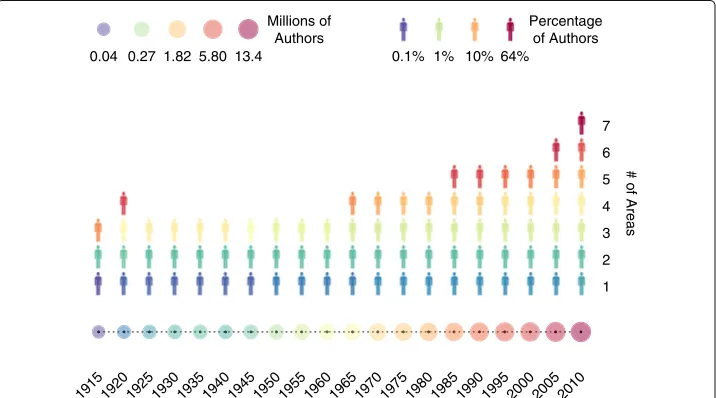
The knowledge diaspora obliged many researchers to work at the edge of dif-ferent topics and difdif-ferent areas, driving an increasing trend towards higher trans-disciplinary and multitrans-disciplinary research, in agreement with very recent evidences (Van Noorden 2015). Our data set allows us to quantify also the contribution of authors to different areas during the past 100 years. For each temporal snapshot of the network, we calculate the distribution of the number of different knowledge areas where an author has published in. The evolution of this distribution is shown in Fig. 4 where, as expected, we can observe how authors publish mainly in one area at the beginning of the past century while, over the years, a growing fraction of researchers has begun to produce publications in an increasing number of different areas.
Discussion and conclusions
We have investigated the evolution of human knowledge across one century by using, as a proxy, the publication patterns of academics in different areas of research. For this
1915 1920 1925 1930 1935 1940 1945 1950 1955 1960 1965 1970 1975 1980 1985 1990 1995 2000 2005 2010
1 2 3 4 5 6 7 0.04 0.27 1.82 5.80 13.4
Millions of Authors
0.1% 1% 10% 64%
Percentage of Authors
# of Areas
purpose, we have used the Microsoft Academic Graph, the largest publicly available data set providing detailed information about academic publications in all areas of knowl-edge. Our multilayer network map allowed us to model the changes in research interests of academics across time, revealing what we called the “diaspora of the knowledge”. In fact, we were able to identify disciplines acting as sources or sinks of academics’ interest, quantifying their attractiveness across time and revealing fundamental periods in the raise of interest in areas of human knowledge. Noticeably, such periods might be related to crucial historical and political events. Our results show that, in the last century, a growing number of researchers published papers in an increasing number of disciplines. This clear trend illustrates, in a quantitative way, the perceived growth in the number of authors performing research crossing the boundaries of knowledge areas.
Endnotes
1http://research.microsoft.com/en-us/projects/mag/
2http://www.scimagojr.com/journalrank.php
3https://www.whitehouse.gov/files/documents/ostp/NSTC%20Reports/NNI2000.pdf
4https://www.epa.gov/history
Appendix
Building the diaspora network
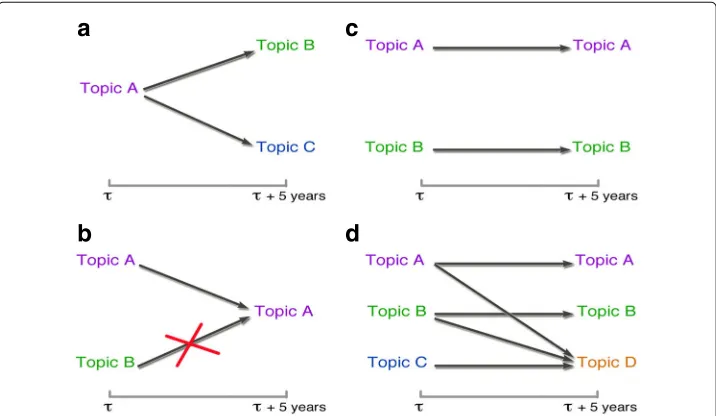
Figure 5 illustrates how we define knowledge diaspora in terms of authors’ movements across their research interests.
a
b
c
d
Fig. 5Knowledge diaspora between areas.aIf an author publishes in different topics at timeτand at time τ+τ, we count one transition between all combinations of topics;bif an author publishes intopics Aand Bat timeτ, and at timeτ+τagain intopic Abut not inBanymore, then we consider just one
Categorical edge-bundling visualization of networks
the Euclidean distance between the connected nodes according to their position in the circular layout.
Acknowledgements
M.D.D. acknowledges financial support from the Spanish program Juan de la Cierva (IJCI-2014-20225). E.O. was supported by James S. McDonnell Foundation.. A.A. acknowledges financial support from ICREA Academia and James S. McDonnell Foundation and Spanish MINECO FIS2015-71582.
Authors’ contributions
MDD and EO analyzed the data and performed the analysis. MDD, EO and AA designed the study and wrote the paper. All authors reviewed and approved the complete manuscript.
Competing interests
The authors declare no competing interests.
Received: 15 September 2016 Accepted: 16 November 2016
References
Abel GJ, Sander N (2014) Quantifying global international migration flows. Science 343(6178):1520–1522
Boccaletti S, Bianconi G, Criado R, Del Genio C, Gómez-Gardeñes J, Romance M, Sendiña-Nadal I, Wang Z, Zanin M (2014) The structure and dynamics of multilayer networks. Phys Rep 544(1):1–122
Börner K, Maru JT, Goldstone RL (2004) The simultaneous evolution of author and paper networks. Proc Nat Acad Sci 101(suppl 1):5266–5273
Boyack KW, Börner K (2003) Indicator-assisted evaluation and funding of research: Visualizing the influence of grants on the number and citation counts of research papers. J Am Soc Inform Sci Technol 54(5):447–461
Boyack KW, Klavans R, Börner K (2005) Mapping the backbone of science. Scientometrics 64(3):351–374 De Domenico M, Solè-Ribalta A, Cozzo E, Kivelä M, Moreno Y, Porter MA, Gòmez S, Arenas A (2013) Mathematical
formulation of multi-layer networks. Phys Rev X 3:041022
Deville P, Wang D, Sinatra R, Song C, Blondel VD, Barabási AL (2014) Career on the move: Geography, stratification, and scientific impact. Sci Rep 4:4770
Etzkowitz H, Leydesdorff L (1995) The triple helix–university-industry-government relations: A laboratory for knowledge based economic development. EASST Rev 14(1):14–19
Etzkowitz, H, Leydesdorff L (2000) The dynamics of innovation: from national systems and ?mode 2? to a triple helix of university–industry–government relations. Res Policy 29(2):109–123
Gargiulo F, Caen A, Lambiotte R, Carletti T (2016) The classical origin of modern mathematics. EPJ Data Sci 5:26 Holme P, Saramäki J (2012) Temporal networks. Phys Rep 519(3):97–125
Holten D (2006) Hierarchical edge bundles: Visualization of adjacency relations in hierarchical data. Vis Comput Graph IEEE Trans 12(5):741–748
Kang IS, Na SH, Lee S, Jung H, Kim P, Sung WK, Lee JH (2009) On co-authorship for author disambiguation. Inform Process Manag 45(1):84–97
Ke Q, Ferrara E, Radicchi F, Flammini A (2015) Defining and identifying sleeping beauties in science. PNAS 112:7426–7431 Kivelä M, Arenas A, Barthelemy M, Gleeson JP, Moreno Y, Porter MA (2014) Multilayer networks. J Complex Netw
2(3):203–271
Krzywinski M, Schein J, Birol I, Connors J, Gascoyne R, Horsman D, Jones SJ, Marra MA (2009) Circos: an information aesthetic for comparative genomics. Genome Res 19(9):1639–1645
Le Pair C (1980) Switching between academic disciplines in universities in the netherlands. Scientometrics 2(3):177–191 Leydesdorff L, Etzkowitz H (1998) The triple helix as a model for innovation studies. Sci Public Policy 25(3):195–203 Leydesdorff L, Rafols I (2009) A global map of science based on the isi subject categories. J Am Soc Inform Sci Technol
60(2):348–362
Ma A, Mondragón RJ, Latora V (2015) Anatomy of funded research in science. PNAS 112:14760–14765 Martin JD (2015) What’s in a name change?. Phys Perspect 17(1):3–32
Newman ME (2012) Communities, modules and large-scale structure in networks. Nat Phys 8(1):25–31
Schulz C, Mazloumian A, Petersen AM, Penner O, Helbing D (2014) Exploiting citation networks for large-scale author name disambiguation. EPJ Data Sci 3(1):1
Shiffrin RM, Börner K (2004) Mapping knowledge domains. Proc Nat Acad Sci 101(suppl 1):5183–5185 Sinatra R, Deville P, Szell M, Wang D, Barabási AL (2015) A century of physics. Nat Phys 11(10):791–796
Sinha A, Shen Z, Song Y, Ma H, Eide D, Hsu B-JP, Wang K (2015) An overview of microsoft academic service (mas) and applications. In: Proceedings of the 24th International Conference on World Wide Web Companion. ACM, New York. pp 243–246. International World Wide Web Conferences Steering Committee