R E S E A R C H
Open Access
Industrial policy, structural transformation
and economic growth: evidence from
China
Jinran Chen
*and Lijuan Xie
* Correspondence:jrchen1994@ruc. edu.cn
Business School, Renmin University of China, Beijing 100872, China
Abstract
Industrial policy is an important means for governments to promote industrial development and accelerate economic growth. This paper mainly uses the Chinese Law and Regulation Database as the source of the relevant laws and regulations of China’s industrial policies from 2003 to 2015. On this basis, it empirically examines the impact of industrial policies on economic growth. The study finds that China’s industrial policy has significant positive effects on economic growth and that industrial structure rationalization is an important channel of industrial policy to improve economic growth. The findings are also valid under a series of robustness tests and endogenous corrections. The results of heterogeneity tests confirm that there are heterogeneous effects pertaining to industrial policy on economic growth among different sub-regional areas, administrative levels, industrial development stages, and industrial policy types. Overall, this paper supports the hypothesis that industrial policy has positive effects on economic growth and, accordingly, provides a basis for industrial policy implementation.
Keywords:Economic growth, Industrial policy, Industrial structure, Structure rationalization, China
Introduction
The New Structural Economics emphasizes the role of government intervention on market economy, and holds the view that governments should provide judicious guid-ance according to various circumstguid-ances, especially to solve external problems that en-terprises may face in the process of industrial upgrading and to coordinate the infrastructure investment that cannot be internalized by an enterprise's decision-making (Lin2012). In fact, industrial policy is an important tool for a government to guide economic development. By implementing industrial policy, the government in-tervenes in the process of resource allocation and the distribution of benefits, restricts or induces the behavior of enterprises, and influences the direction of industrial devel-opment (Wang and Qi1996). This paper therefore aims to examine the effects of in-dustrial policy in China.
In recent years, a large number of studies have presented useful discussions and research on industrial policy, primarily focusing on strategy, objective, and effect of in-dustrial policy (Aghion et al. 2015; Beason and Weinstein1996; Criscuolo et al.2012;
Haeri and Arabmazar 2018; Han et al. 2017; Krueger and Tuncer 1982; Li and Zheng 2016; Nathan and Overman2013; Pack and Saggi2006; Sanjaya2004; Song and Wang 2013; Yu et al.2016). However, most existing studies discuss industrial policy qualita-tively, while only a few attempt to analyze the effects from the quantitative perspective. In addition, most existing quantitative studies use financial and fiscal tools or specific policy to measure industrial policy.
Specifically, in terms of quantitative research regarding the effects of industrial policy, Krueger and Tuncer (1982) use trade protection policy to test the infant industry protection theory. The results show that trade protection policy does not significantly improve the productivity of infant industries, which indicates that the infant industry protection theory is not verified. Beason and Weinstein (1996) use tax incentives, sub-sidies, and industrial protection as proxy variables for industrial policy. The empirical results also show that industrial policy does not improve total factor productivity (TFP). Criscuolo et al. (2012) use the changes in industrial policy rules to measure in-dustrial policy. Their study finds that inin-dustrial policy has a positive effect on employ-ment, investment and net entry of plants, but does not significantly improve TFP. Song and Wang (2013) use three Five-Year Plans to represent key industrial policy. Their study demonstrates that industrial policy does promote overall industrial productivity. Aghion et al. (2015) use tax incentives, government subsidies, and R&D subsidies to measure industrial policy. Based on both the innovation scale effect theory and compe-tition theory, their study analyzes the impact of industrial policy on TFP of industrial sectors in China. The empirical results show that if industrial policy can promote com-petition, it will be beneficial to TFP. Li and Zheng (2016) and Yu et al. (2016) focus on whether industrial policy can promote innovation. Their studies find that industrial policy does contribute to more patents, but most firms pursue innovation by quantity rather than by quality for support-seeking purposes. Han et al. (2017) innovatively measure industrial policy by using the number of industrial policies and regulations in-cluded in the Chinese Law and Regulation Database, and their study finds that indus-trial policy does promote indusindus-trial structure transformation.
In conclusion, the current research includes many theoretical discussions and empir-ical studies on the effects of industrial policy. However, research which measures indus-trial policy at the micro level and regards indusindus-trial structural transformation as the potential mechanism for industrial policy to impact economic growth is still quite rare. In fact, industrial policy is an important tool for governments to accelerate structural transformation, enhance efficiency and promote economic growth (Chang et al. 2013). Exploring whether industrial policy can promote economic growth and examining if industrial structural transformation is the potential mechanism can reveal the effects of industrial policy more thoroughly and practically.
than at the provincial level. Considering the great heterogeneities existing in Chinese cities, industrial policy may have heterogenous effects at the city level. Therefore, in order to obtain more reliable results, it is necessary to further conduct research at city level.
The study results show that China’s industrial policy has significant effects on eco-nomic growth, and industrial structural rationalization is the potential industrial policy mechanism for economic growth. Moreover, the effects of industrial policy are hetero-geneous in different sub-regional areas, administrative levels, industrial development stages, and industrial policy types.
The rest of this paper is organized as follows. The second part presents theoretical analyses and hypotheses on the impact of industrial policy; the third part explains model specifications and variable measurement; the fourth part presents results and analyses of the basic regression and heterogeneity tests; the fifth part focuses on the results and analyses of robustness checks and endogenous corrections; and the sixth part concludes and gives limitations of this study.
Theoretical analyses and hypotheses
The market operation mechanism is not perfect. Because phenomena such as external-ities, information incompleteness and asymmetry in the operation system of market economy exist, problems such as inefficient resource allocation and excess or insuffi-cient production capacity are common (Hausmann and Rodrik2003; Rodrik1996; Stig-litz 1993). By designing and implementing reasonable and effective industrial policies, market economy efficiency can be improved and industrial structure can be upgraded and optimized, thus contributing to economic growth (Aghion et al.2015).
Specifically, due to market failure as well as limited resources caused by Marshallian externalities and the imperfect market mechanism, it is difficult to obtain goals such as efficient resource allocation and industrial structure transformation only through the market economy system itself. By implementing industrial policy, firstly, it can guide the market resource flow by releasing policy signals. In addition, by using a set of means, such as credit, taxation, subsidies and entry threshold reduction, industrial policy can decrease market failures caused by factors such as externalities and imper-fect market mechanism, improve resource allocation efficiency and promote industrial development (Wei et al.2018).
Furthermore, unlike developed countries, the direction of industrial development is more predictable in developing countries such as China. Because the economic individ-uals in the market usually do not have sufficient information regarding the relevant industries, excessive output and economic fluctuation problems caused by the “tidal phenomenon” of investment may follow (Bai 2016; Lin et al. 2010). Industrial policies can make upthe lack of market information to a certain extent, which can help to re-duce efficiency loss caused by economic fluctuations, while at the same time promoting the upgrade of corresponding industries. Thus, this paper proposes that:
Hypothesis 1:In general, industrial policy has positive effects on economic growth.
to the resource allocation optimization and overcome market failures depends on how much information the government holds about the market. As the main designer and implementer of industrial policies, it is vital that the government has sufficient information about industrial development. If not, the government may set incorrect industrial development goals, which will not only fail to reach the resource alloca-tion efficiency, but may also facilitate a large number of economic distoralloca-tions and rent-seeking behaviors (Chen et al. 2011; Yang 2011; Yuan et al. 2015; Yu et al. 2016).
In fact, the government usually has a varied amount of information about economic operations and industrial development in different developmental stages, which may lead to heterogenous effects of industrial policy under disparate development levels (Song and Wang2013). Furthermore, various types of industrial policy require different amounts of information, so there may also exist heterogenous effects of industrial pol-icy for these different types.
Therefore, this paper further examines whether heterogeneous effects exist in different sub-regional areas, administrative levels, industrial development stages, and industrial policy types. It is proposed that:
Hypothesis 2: Industrial policy may have heterogenous effects on economic growth in different sub-regional areas, administrative levels, industrial development stages, and industrial policy types.
Model specification and variable measurement
Model specification
In order to explore the impact of China’s industrial policy on economic growth, this paper uses the following basic model for empirical analysis:
lnðYitþ1Þ ¼α0þβ1 lnðIPitþ1Þ þβ2 lnðCapitalitþ1Þ þβ3 lnðPopuitþ1Þ þβ4 lnðInf oitþ1Þ þβ5 lnðTransitþ1Þ þβ6Laboritþβ7 lnðOpenitþ1Þ þβ8GovernitþDiþDtþεit
ð1Þ
For the sake of data smoothness, 1 is added, and the natural logarithm then is applied to economic growth (Y), industrial policy (IP), capital scale (Capital), population scale (Popu), informatization level (Info), transport level (Trans), and opening-up level (Open), respectively.1iandtrepresent the city and year (2003 to 2015), respectively.Di
and Dtstand for the city fixed effect and year fixed effect respectively. To control the
heterogeneities of different cities, this paper adopts the fixed-effect model for estimates. In order to make the regression results more robust and credible, the stepwise regres-sion method is adopted.
Independent variable measurement: industrial policy
At present, quantitative research on industrial policy is relatively scarce, and principally employs macro-level indicators such as fiscal policy, monetary policy, macro plan, tax preference and government subsidy as proxy variables of industrial policy (Aghion et al.
2015; Beason and Weinstein1996; Criscuolo et al.2012; Krueger and Tuncer1982; Li and Zheng2016; Song and Wang2013; Yu et al.2016).
This paper draws from Han et al. (2017) to measure industrial policy by mainly using the Chinese Law and Regulation Database. However, Han et al. (2017) measure industrial policy at the provincial level, taking into consideration the existing heterogeneities at the city level, measuring industrial policy at the city level may lead to a more accurate evaluation; therefore, this paper measures indus-trial policy at the city level. The Chinese Law and Regulation Database includes constitutional laws, administrative regulations, judicial interpretations, ministry reg-ulations, military regreg-ulations, policy disciplines, local regreg-ulations, industry norms, government documents and other forms of policy and legal documents from 1949 and thereafter, which provides a prerequisite for the quantitative assessment of in-dustrial policy at the micro level.
This paper intends to measure industrial policy based on the following steps: First, by using the Chinese Law and Regulation Database, this paper collects laws and regulations from 2003 to 2015 designed for the guidance of industrial develop-ment. Specifically, the search criteria are set as follows: (1) policy title contains the keyword “industry”; (2) the promulgation time is during the period from January 1, 2003 to December 31, 2015. The search results show that there are 18,561 laws and regulations which match the above search criteria. Second, this paper identifies and deletes duplicate observations in the raw data set. Third, this paper identifies targeted regions of industrial policy. Specifically, this paper first identifies geo-graphic names shown in the primary policy-promulgated institutes. If the identified geographic names are at the provincial level (or autonomous region level or muni-cipality level), county level, town level, district level or township level, this paper further modifies targeted regions of these observations to the corresponding prefecture-level cities. In addition, this paper deletes the observations which do not contain geographic names in the promulgation institutions and the policy titles. Fi-nally, there are administrative division changes within the study period. Specifically, the four cities Chaohu, Bijie, Tongren and Shashi all experienced administrative division changes. Therefore, this paper deletes the observations pertaining to these four cities.2 Based on the above data processing procedure, the number of annually newly-issued industrial policies pertaining to prefecture-level cities (or autonomous prefectures or leagues) is determined. The states of industrial policy include the validity, being revised, being amended, the invalidity and the partial invalidity, so considering the effectiveness of industrial policy, this paper deletes industrial pol-icies which are in a state of invalidity. This study further calculates the cumulative number of industrial policies in each year, which is used to represent industrial policy.
This paper then constructs a two-dimensional industrial policy data set of the prefecture-level cities (or autonomous prefectures or leagues), which includes 9653 in-dustrial policies covering 271 prefecture-level cities (or autonomous prefectures or lea-gues) of 29 provinces (or autonomous regions or municipalities) of China.3
Dependent variable measurement: economic growth
There is a great deal of research on economic growth (Allen et al. 2005; Au and Henderson 2006; Gordon 2012; Grossman and Krueger 1995; Hanushek and Woessmann 2012; Kuznets 1973; Yu 2015). This paper draws on the study by Yu (2015), using real GDP to measure economic growth. Thus, the paper calculates real GDP by using the corresponding provincial price index to remove the impact of price.4
Control variable measurement
Based on existing research conclusions and data availability, this paper further controls for the following variables.
Urban scale Regarding urban scale, this paper mainly controls the capital scale ( Cap-ital) and population scale (Popu). Specifically, this paper uses the perpetual inventory method to estimate urban capital stock and divides it by the number of employees to represent capital scale (Capital). Because there is no city-level domestic capital stock data, this paper uses the method of Zhang et al. (2004) to estimate this variable. The initial capital stock in 2003 is estimated by using 10% of the total investment in fixed assets in 2003, followed by using the perpetual inventory method to estimate the capital stock from 2004 to 2015, respectively. The perpetual inventory method calculation for-mula is as follows:
Ki;t¼ð1−δÞKi;t−1þIt−1=di;t−1; ð2Þ
where Krepresents the capital stock,δrepresents the annual capital depreciation rate,
set at 9.6%, I represents fixed assets investment amount, d represents the provincial
fixed assets investment price index (at 2003 constant prices), andi,trepresents the cor-responding city and year, respectively. The population scale (Popu) is measured by the population density of the municipal district.
Development stageAs for the development stage, this paper mainly controls the infor-matization level (Info), transport level (Trans), human capital level (Labor) and the opening-up level (Open). Specifically, this study uses the number of local telephone users in the municipal district to measure informatization level (Info) . The transport level (Trans) is measured by the number of public buses divided by the resident popu-lation of the municipal district. The human capital level (Labor) is measured by the number of colleges and universities divided by the resident population of the municipal district. The opening-up level (Open) is measured by the per labor foreign investment amount, denominated in U.S. dollars (using the USD-CNY average exchange rate to transform the unit to Chinese yuan5).
Location condition In this paper, government intervention (Govern) is controlled for the location condition. Specifically, government intervention (Govern) is measured by
3
Because the number of industrial policies of Tibet (9) and Qinghai (33) are too few, this paper deletes the observations of these two provinces.
the proportion of local fiscal expenditure excluding scientific and educational expenses in GDP.
Mechanism variable measurement: structural transformation
This paper also focuses on whether industrial structural transformation is the possible mechanism for industrial policy to affect economic growth. Considering data availabil-ity and related research, this paper measures industrial structural transformation from two aspects: industrial structure rationalization and industrial structure upgrade (Yu 2015). Industrial structure rationalization (Structure1) is measured by the reciprocal of Theil’s Index (Theil 1967). The calculation method is shown in Eq. (3), whereYis the gross output,Lindicates the number of employees, Nis the total number of industrial sectors, and i is the specific industrial sector. LargerStructure1means that the indus-trial structure rationalization level is higher. The indusindus-trial structure upgrade ( Struc-ture2) is measured by the ratio of tertiary industry output to secondary industry output.
Structure1¼ 1
TL¼
1
XN
i¼1
Yi
Y ln Yi
Li=
Y L
: ð3Þ
Definition of variables and descriptive statistics
The data used in this paper is primarily from the Chinese Law and Regulation Data-base, the China Data Online DataData-base, the China Economic Statistics Yearbook, the China Urban Economic Statistics Yearbook and statistical data from the People’s Bank of China. Additionally, considering that urban economic activities principally occur in municipal districts, this paper uses data from municipal districts of prefecture-level cities (or autonomous prefectures or leagues).
The variable measurement method is shown in Table1. In addition, in order to elim-inate the influence of extreme values, the key control variables are treated with 1% winsorized.
The descriptive statistical results of the main variables are reported in Table 2. This paper primarily focuses on changes in economic growth and industrial policy. The re-sults show that in the years from 2003 to 2015, real GDP experienced obvious growth. At the same time, the average cumulative number of industrial policies also increased significantly. The average cumulative number of industrial policies increased from 5.3 in 2003 to 174.1 in 2015.
Table 3 shows the characteristics of industrial policy. From a legal perspective, local regulations and government documents are the main types of China’s industrial pol-icies, accounting for more than 95% of the industrial policies during the study period. In terms of geographical distribution, the intensity of industrial policy of the east region is significantly higher than that of other regions. Specifically, the number of cities in the east, the midland and the west is similar, but the number of industrial policies in the east is nearly twice that of the midland and the west. In addition, the intensity of industrial policy of sub-provincial level and higher-level cities is significantly higher
than that of other cities. From the perspective of industrial policy type, selective indus-trial policy constitutes the main body of China’s industrial policy in the study period.
Empirical results and analyses
Basic regression
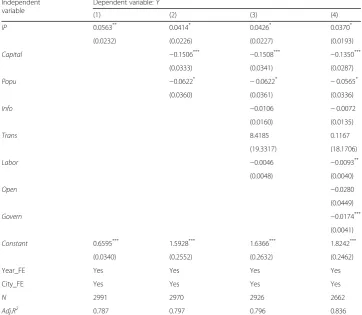
Table 4 reports the detailed regression results. The results indicate that the estimated coefficients of industrial policy are positive and significant in models (1), (2), (3) and (4). This demonstrates that with the control of capital scale, population scale, informa-tion level and other factors, industrial policy still has significant positive impacts on economic growth. In other words, Hypothesis 1 is confirmed. Specifically, in model (4), when the number of industrial policies increases by 1%, economic growth will increase by an average of about 0.0370%. In addition, the estimated coefficients of industrial policy in models (2) and (3) are stable at around 0.043, and the sign and significance level are all consistent, which indicates that the estimated results are robust.
Table 1Variable measurement method
Label Variable Measurement
Dependent variable
Economic growth Y Real GDP (unit: trillion RMB)
Independent variable
Industrial policy IP The cumulative number of industrial policies (units: pieces)
Control variables
Capital scale Capital Per labor capital stock (unit: 10,000 RMB/person)
Population scale Popu Population density (unit: person/square kilometer)
Informatization level
Info The number of telephone users (units: 10,000 households)
Transportation level
Trans Per capita public cars (unit: standard station/person)
Human capital level
Labor The ratio of students in universities to resident population (unit: %)
Opening-up level Open Per labor foreign investment amount (unit: 10,000 RMB/person)
Government intervention
Govern The ratio of local financial expenditure excluding scientific and educational expenses to GDP (unit: %)
Structure rationalization
Structure1 The reciprocal of Theil’s Index
Structure upgrade Structure2 The ratio of output of tertiary industry to second industry
Table 2Descriptive statistics for 2003 and 2015
Variable Max Min Mean Std. Obs.
Year:2003
Economic growth (Y) 0.6566 0.0032 0.0465 572.271 214
Industrial policy (IP) 21 0 5.281 4.458 231
Year:2015
Economic growth (Y) 2.3133 0.0188 0.2552 3293.764 233
Table 3Characteristics of industrial policy The legal level of industrial policy
Administrative regulations
Judicial interpretation Minister’s regulations Local regulations
Number 1 1 75 6697
Percentage 0.0104 0.0104 0.7770 69.3774
Military regulation Policy discipline Industry regulations Government documents
Number 1 112 112 2654
Percentage 0.0104 1.1603 1.1603 27.4938
Geographical distribution of industrial policy
East (number of cities) Midland (number of cities)
West (number of cities)
Northeast (number of cities)
Number 4104 (84) 2408 (77) 2406 (78) 735 (32)
Percentage 42.5153 24.9456 24.9249 7.6142
Sub-provincial cities (number of cities) The other (number of cities)
Number 2797 (33) 6856 (238)
Percentage 28.9754 71.0246
Types of industrial policy
Selective industrial policy Functional industrial policy
Number 7575 2078
Percentage 78.4730 21.5270
Table 4Basic regression Independent
variable
Dependent variable:Y
(1) (2) (3) (4)
IP 0.0563** 0.0414* 0.0426* 0.0370*
(0.0232) (0.0226) (0.0227) (0.0193)
Capital −0.1506*** −0.1508*** −0.1350***
(0.0333) (0.0341) (0.0287)
Popu −0.0622* −0.0622* −0.0565*
(0.0360) (0.0361) (0.0336)
Info −0.0106 −0.0072
(0.0160) (0.0135)
Trans 8.4185 0.1167
(19.3317) (18.1706)
Labor −0.0046 −0.0093**
(0.0048) (0.0040)
Open −0.0280
(0.0449)
Govern −0.0174***
(0.0041)
Constant 0.6595*** 1.5928*** 1.6366*** 1.8242***
(0.0340) (0.2552) (0.2632) (0.2462)
Year_FE Yes Yes Yes Yes
City_FE Yes Yes Yes Yes
N 2991 2970 2926 2662
Adj.R2 0.787 0.797 0.796 0.836
Mechanism test
Several studies show that China’s economic growth is related to industrial structural transformation (Huang2014; Jin2015; Yu2015). By indicating signals and using means such as credit and financial tools, industrial policy can influence market resource allocation and may further impact the industrial structure. In view of this, this paper in-tends to further explore whether industrial structural transformation is the potential mechanism of industrial policy effecting economic growth.
Specifically, this paper further examines the possible channels through which indus-trial policy affects economic growth by constructing a mediation effect model. The mediation effect model consists of the following equations:
Yit¼α0þβ1IPitþβ2ControlsitþDiþDtþεit ð4Þ
Structureit¼α1þβ3IPitþβ4ControlsitþDiþDtþεit ð5Þ
Yit¼α2þβ5IPitþρStructureitþβ6ControlsitþDiþDtþεit ð6Þ
The industrial structure (Structure) is the mediation variable, including industrial structure rationalization (Structure1) and industrial structure upgrade (Structure2). The methods to examine whether the mediation effect exists can be summarized in the following four steps. First, the significance of the estimation coefficientβ1is tested, and the second step test is continued if β1 is significant. Second, the significance of the estimation coefficientsβ3and ρare tested. If both are significant, then the effects ofIP onYis achieved at least partially through the mediation variable. Third, the significance of the estimation coefficientβ5is tested. If it is not significant, there is a full mediation process; in other words, the effect of IP onY is achieved entirely through mediation variables. If it is significant, there is a partial mediation process; in other words, only part of the effect of IP on Y is achieved through the mediation variable. Fourth, the Sobel test is conducted. If the test result is significant, the mediation effect exists.
Table 5 reports specific empirical test results. The Eq. (4) in the mediation effect model is the same as the estimated equation set up for the baseline regression. Accord-ing to the estimated results for the baseline regression, the estimate coefficientβ1is still significant at the 10% significance level after controlling for a series of variables that may affect economic growth.
Therefore, the result of this regression shows that the impact of industrial policy on eco-nomic growth is achieved at least partially through the industrial structural rationalization. Furthermore, according to the regression results of column (6) in Table 5, the estimated coefficient of industrial policy on economic growth is not significant, indicating that the impact of industrial policy on economic growth is achieved entirely through the industrial structural rationalization. In addition, the Sobel test shows that theZstatistic of the indus-trial structural rationalization channel is−3.185, passing the 1% level of the significance test. In summary, the regression results of Table 5 verify that the industrial structural rationalization is an important channel for industrial policy to act on economic growth.
Heterogeneity tests
Heterogeneity test: different sub-regional areas
Considering the heterogeneities of industrial structure and development levels in sub-regional areas in China, this paper further tests the effects of industrial policy on eco-nomic growth in different sub-regional areas. According to the China National Bureau of Statistics, we divide China into four sub-regional areas for economic analyses: the east, the west, the northeast and the midland.6 This paper further tests the relationship between industrial policy and economic growth in these sub-regional areas.
According to the regression results in Table 6, industrial policy only has a positive effect on economic growth in the midland. This may be because the midland is less
Table 5Mechanism test Industrial policy—Industrial structure
Structure1 Structure2
(1) (2) (3) (4)
IP 0.0476 0.2157** −0.0895 0.0476
(0.0998) (0.0921) (0.0966) (0.0427)
Control variables No Yes No Yes
Year_FE Yes Yes Yes Yes
City_FE Yes Yes Yes Yes
N 2937 2610 3185 2662
Adj.R2 0.025 0.136 0.028 0.073
Industrial structure—Economic growth
(5) (6) (7) (8)
Structure1 0.0515*** 0.0557***
(0.0114) (0.0083)
Structure2 −0.0626** −0.0700***
(0.0274) (0.0252)
IP 0.0518** 0.0239 0.0592** 0.0403**
(0.0217) (0.0183) (0.0238) (0.0200)
Control variables No Yes No Yes
Year_FE Yes Yes Yes Yes
City_FE Yes Yes Yes Yes
N 2937 2842 3289 2919
Adj.R2 0.799 0.854 0.781 0.835
developed compared to the eastern region, which makes it easier to design effective and accurate industrial policy in the midland. Furthermore, the midland may bear heavier investment constraints compared to the eastern region, so the effects of indus-trial policy may become more significant in the midland. Also, compared to the west and the northeast, the market operation system is more mature and stable in the midland, which will lead to the effects of industrial policy being more fully realized in the midland.
Heterogeneity test: different administrative levels
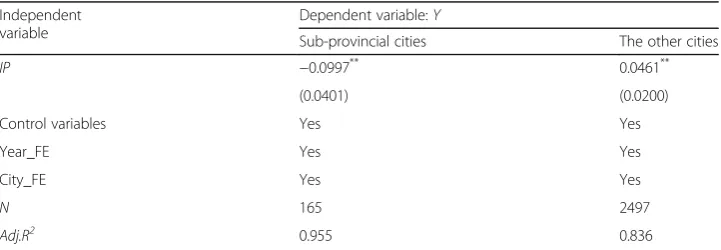
Administrative levels of cities may influence efficiency in resource allocation, and fur-ther influence economic growth. This paper furfur-ther examines the effects of industrial policy on economic growth at different administrative levels.7 Specifically, this paper divides cities into two groups, which are the sub-provincial cities and the other cities.
Table7reports the regression results. It shows that industrial policies have significant positive effects on economic growth in the other cities, but hinders the economic growth in the sub-provincial cities. The empirical results confirm the theoretical analysis and Hypothesis 2. Specifically, because the sub-provincial cities have higher economic development levels than other cities, it is more difficult for industrial policy-makers to collect information in the sub-provincial cities, which will then affect the effectiveness of industry policy.
Heterogeneity test: different industrial development stages
This paper further divides cities into the secondary industry dominant type and the ter-tiary industry dominant type.8On the basis of this, the paper examines whether there are heterogeneous effects of industrial policy on economic growth in these two types of cities. The regression results in Table8show that industrial policy is more effective on eco-nomic growth in the secondary industry dominant type cities than in the tertiary indus-try dominant type cities. This may be due to the fact that during the sample period, most industrial policies were selective types which mainly aimed at the development of the manufacturing sector. Therefore, compared with the tertiary industry dominant type cities, the effects of industrial policy are more significant in the secondary industry dominant type cities.
Heterogeneity test: different industrial policy types
Industrial policy can be roughly divided into selective industrial policy and functional industrial policy. Although China has gradually increased its emphasis on the formula-tion of funcformula-tional industrial policy, selective industrial policy is still the main body of
6The eastern section includes Beijing, Tianjin, Hebei, Shandong, Jiangsu, Zhejiang, Shanghai, Guangdong, Hainan, and Fujian; the midland includes Shanxi, Henan, Anhui, Hubei, Jiangxi, and Hunan; the western includes Sichuan, Shaanxi, Yunnan, Guizhou, Guangxi, Inner Mongolia, Xinjiang, Gansu, Ningxia, and Chongqing; the northeastern includes Liaoning, Jilin, and Heilongjiang.
7Sub-provincial cities include: Beijing, Shanghai, Chongqing, Tianjin, Hefei, Fuzhou, Xiamen, Lanzhou, Guangzhou, Shenzhen, Nanning, Guiyang, Haikou, Shijiazhuang, Zhengzhou, Wuhan, Nanchang, Nanjing, Changchun, Dalian, Shenyang, Hohhot, Yinchuan, Jinan, Qingdao, Xi’An, Chengdu, Urumqi, Kunming, Hangzhou, Ningbo, Harbin, and Changsha.
industrial policy in China. Selective industrial policy calls for direct government inter-vention in the market and may restrict competition, which is based on the idea of “picking winners.” Specifically, the government supports the development of specific industries or enterprises through approval, guidance, subsidies, tax incentives, and other administrative means. However, the main characteristic of functional industrial policy is “market-oriented,” which means the government should be a supplement to the market mechanism and maintain a competitive market environment.
Many existing studies have pointed out that the effects of selective industrial policy and functional industrial policy may be different, and sustained economic development requires more functional industrial policy (Beason and Weinstein 1996; Han et al. 2017; Song and Wang2013; Wang 2017). Specifically, the view of the New Structural Economics is that industrial policy should not intervene in all industries with Marshallian externalities (Ju et al.2011). In fact, only industrial policy of the correct industry-picking based on the comparative advantage of factor endowments may be effective. The premise of the correct industry-picking calls for a market-oriented approach, because only the market-oriented approach can allow market information to be fully utilized and allow price signals and market perfect competition to become the fundamental mechanism of resource optimization and allocation. Therefore, this paper will further distinguish the industrial policy heterogeneous effect from the perspective of industrial policy types.
Specifically, this paper sets the observations as selected ones if the following words appear in the “policy title,” including: promotion, grant, support, approval, subsidy, commendation, strategy, development, acceleration, consent, authorization, permission,
Table 6Heterogeneity test: Different sub-regional areas Independent
variable
Dependent variable:Y
East Midland West Northeast
IP −0.0001 0.0670*
−0.0214 −0.0295
(0.0351) (0.0360) (0.0320) (0.0713)
Control variables Yes Yes Yes Yes
Year_FE Yes Yes Yes Yes
City_FE Yes Yes Yes Yes
N 728 947 678 309
Adj.R2 0.897 0.878 0.864 0.659
Notes.(1) * meansP< 10%; (2) The estimated coefficients in parentheses are the robust standard errors clustering to the
city level
Table 7Heterogeneity test: Different administrative levels Independent
variable
Dependent variable:Y
Sub-provincial cities The other cities
IP −0.0997** 0.0461**
(0.0401) (0.0200)
Control variables Yes Yes
Year_FE Yes Yes
City_FE Yes Yes
N 165 2497
Adj.R2 0.955 0.836
Notes.(1) ** meansP< 5%; (2) The estimated coefficients in parentheses are the robust standard errors clustering to the
enhancement, escalation, elimination, cancellation, rectification, lifting, focus, leading, industrial economic belt, finance, loan, discount, high-tech, industrial park, development zone, industrial cluster, industrial base, industrial technology alliance, demonstration base, industrial cooperation park, and industrial agglomeration area. The remaining observations are grouped as functional ones.
According to the regression results of Table 9, although both the selective and functional industrial policies positively affect economic growth, compared with selective industrial policy, functional industrial policy plays much larger role in the promotion of economic growth.
The empirical results of heterogeneity tests discussed above show that industrial policy has heterogenous effects on economic growth in different sub-regional areas, administrative levels, industrial development stages, and industrial policy types, which confirms Hypothesis 2. This demonstrates that it is vital to consider the developmental levels of cities when industrial policy is designed and evaluated, and the government should make greater efforts on designing and implementing func-tional industrial policy.
Robustness checks and endogenous corrections
The above regression results basically demonstrate that although the effects of indus-trial policy are heterogenous in different sub-regional areas, administrative levels and
Table 8Heterogeneity test: Different industrial development stages Independent
variable
Dependent variable:Y
Secondary industry dominant Tertiary industry dominant
IP 0.0463*
−0.0078
(0.0243) (0.0304)
Control variables Yes Yes
Year_FE Yes Yes
City_FE Yes Yes
N 1852 796
Adj.R2 0.854 0.827
Notes.(1) * meansP< 10%; (2) The estimated coefficients in parentheses are the robust standard errors clustering to the
city level
Table 9Heterogeneity test: Different industrial policy types Independent
variable
Dependent variable:Y
Selective industrial policy Functional industrial policy
IP 0.0348*** 0.0446***
(0.0038) (0.0066)
Control variables Yes Yes
Year_FE Yes Yes
City_FE Yes Yes
N 1030 329
Adj.R2 0.417 0.553
Notes.(1) *** meansP< 1%; (2) The estimated coefficients in parentheses are the robust standard errors clustering to the
industrial development stages, in general, industrial policy has a significant role in promoting economic growth.
In order to further assure the reliability of the regression results, this paper adopts the following methods for robustness tests and endogenous corrections:
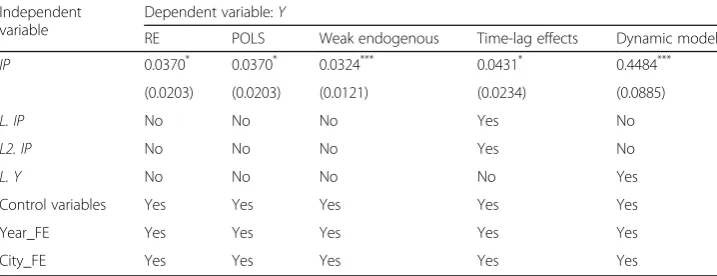
1. Change the estimation method: Specifically, this paper further uses the random effect and the pooled least-squares method to estimate. Table 10shows the detailed estimated results. It demonstrates that after changing the estimation methodology, industrial policy still has a significant positive effect on economic growth.
2. Use the weak endogenous sample: The motivation and ability of local governments to design and implement industrial policies may be related to economic development. Specifically, when economic development reaches a certain level, the economy may enter an adjustment period. At this stage, local governments may have more incentives to implement corresponding industrial policies. However, gaps in the ability of local governments to design and implement industrial policies may exist. The areas with high economic development level are more likely to have effective and reasonable industrial policies. Therefore, lesser endogenous problems caused by the two-way causality between the level of economic development and industrial policy may exist. Thus, the paper uses a weak endogenous sample; that is, this paper selects the sample with economic growth below the median level for analysis. As can be seen in Table 10, the regression results of the weak endogenous sample also support the conclusion that industrial policy contributes to economic growth.
3. Control time-lag effects: Time lags for industrial policy to affect economic growth may exist; in other words, it may be difficult for a new industrial policy to show positive effects on economic growth as soon as it is promulgated. Therefore, this paper further controls the one-period and two-period lags of industrial policy in the regression. The regression results show that after controlling the lags of
Table 10Results after changing estimation methods, controlling time-lag effects and using dynamic model estimation
Independent variable
Dependent variable:Y
RE POLS Weak endogenous Time-lag effects Dynamic model
IP 0.0370* 0.0370* 0.0324*** 0.0431* 0.4484***
(0.0203) (0.0203) (0.0121) (0.0234) (0.0885)
L. IP No No No Yes No
L2. IP No No No Yes No
L. Y No No No No Yes
Control variables Yes Yes Yes Yes Yes
Year_FE Yes Yes Yes Yes Yes
City_FE Yes Yes Yes Yes Yes
Notes.(1) * meansP< 10%, *** meansP< 1%; (2) The estimated coefficients in parentheses are the robust standard
industrial policy, the sign and significance level of industrial policy do not change, indicating robust results.
4. Use dynamic panel estimation: It is likely that promulgating industrial policy is a strategic choice made by the government after considering the economic development stages, which means that the number of industrial policies is not exogenous. There may exist a reverse causal relationship between the number of industrial policies and economic growth. In order to reduce the potential estimation bias caused by the endogenous problem, this paper controls the one-period lag of economic growth as the proxy variable of missing variables in the model. Also, because adding this one-period lag to the dependent variable will
induce endogenous problems, this paper adopts the two-step difference Generalized Moment Method (GMM) to conduct the dynamic panel regression (Blundell and Bond1998). The one-period lag of economic growth and the number of industrial policies are specified as endogenous variables. The estimation results show that industrial policy does accelerate economic growth.
5. Control unobservable effects: This paper has controlled for a series of variables which may affect economic growth as well as the year and city fixed effects in the basic regression. In order to further alleviate the endogenous problems caused by missing variables, this paper runs the following regressions: (1) controlling the time trend—considering that both economic growth and the number of industrial policies may be affected by the time trend simultaneously, this paper further controls for the time trend, (2) controlling the time trend and the interaction term of the time trend and the province, in order to control the influence of the overall time trend and the time trend of specific provinces, (3) controlling the region fixed effect and the region × year fixed effect, in order to control the characteristics of regional levels that do not change over time, as well as the characteristics of regional levels that do change over time, and (4) controlling the time trend, the interaction term of the time trend and the region, the region fixed effect and the region × year fixed effect. Table11shows that the estimated results are highly consistent with the basic regression results.
6. IV estimation: This paper further uses the one-period lag of industrial policy as the instrumental variable. Table11shows industrial policy still has a significantly positive effect on economic growth by using IV-2SLS estimation.
Conclusions and limitations
economic growth in different sub-regional areas, administrative levels, industrial development stages, and policy types.
Although this paper is very cautious about variable measurement and estimation methods, the conclusions herein should still be generalized with caution. First, this paper uses the cumulative number of industrial policies to measure the key inde-pendent variable industrial policy. The underlying assumption for this variable measurement to be reasonable is that the number of industrial policies should be positively correlated with the real effects of industrial policy. Second, this paper only covers a sample of China from 2003 to 2015, and the effects of industrial policy may be influenced by many factors. It may therefore be inappropriate to simply extend the conclusions of this paper to the other countries or regions. Future research can expand the scope of this paper. Third, this paper tries to control a series of observable and unobservable variables which may affect eco-nomic growth, and uses the methods including fixed-effect model, random-effect model, pooled OLS, IV estimation and dynamic model to estimate. All results show that industrial policy has positive effects on economic growth. However, although this paper tries to address endogenous problems and conduct a series of robustness checks, whether causality between industrial policy and economic growth exists still needs further cautious evaluation. In future research, the method such as quasi-experiment may provide more solid and convincing evidence for the casual rela-tionship between industrial policy and economic growth.
Acknowledgements
Not applicable.
Availability of supporting data
The data used in this paper are available in the Chinese Law and Regulation Database, the China Data Online Database, the China Economic Statistics Yearbook, the China Urban Economic Statistics Yearbook and the statistical data of the People’s Bank of China.
Authors’contributions
Generated research idea: XL, JC; Collected data, carried out empirical tests and analysis: JC; Drafted and revised the paper: XL, JC. All authors read and approved the final manuscript.
Table 11Results after controlling unobservable effects, and IV estimation Independent
variable
Dependent variable:Y
Control unobservable effects IV estimation
(1) (2) (3) (4) 2SLS
IP 0.0370* 0.0430** 0.0401* 0.0401* 0.0634***
(0.0193) (0.0203) (0.0210) (0.0210) (0.0153)
Control variables Yes Yes Yes Yes Yes
Time trend Yes Yes No Yes No
Year_FE Yes Yes Yes Yes Yes
City_FE Yes Yes Yes Yes Yes
Region_FE No No Yes Yes No
Region× Year_FE No No Yes Yes No
Time trend×Province No Yes No No No
Time trend×Region No No No Yes No
Notes.(1) * meansP< 10%, * * meansP< 5%, * * * meansP< 1%; (2) The estimated coefficients in parentheses are the
Authors’information
Jinran, CHEN is the Ph.D. candidate in the School of Business, Renmin University of China; Lijuan, XIE is the associated professor in the School of Business, Renmin University of China.
Funding
Not applicable.
Competing interests
The authors declare that they have no competing interests.
Received: 10 March 2019 Accepted: 29 October 2019
References
Aghion, P., Cai, J., Dewatripont, M., Du, L., Harrison, A., & Legros, P. (2015). Industrial policy and competition.American Economic Journal: Macroeconomics, 7(4), 1–32.
Allen, F., Qian, J., & Qian, M. (2005). Law, finance, and economic growth in China.Journal of Financial Economics, 77(1), 57–116.
Au, C. C., & Henderson, J. V. (2006). Are Chinese cities too small?The Review of Economic Studies, 73(3), 549–576.
Bai, R. (2016). Competition-driven, government intervention and capacity expansion: Discussion on the micro-mechanism of
“wave movement phenomenon.”Economic Research Journal, 11, 56–69.
Beason, R., & Weinstein, D. E. (1996). Growth, economies of scale, and targeting in Japan (1955–1990).The Review of Economics and Statistics, 78(2), 286–295.
Blundell, R., & Bond, S. (1998). Initial conditions and moment restrictions in dynamic panel data models.Economics Papers, 87(1), 115–143.
Chang, H.-J., Andreoni, A., & Kuan, M. L. (2013). International industrial policy experiences and the lessons for the UK. InThe future of manufacturing. London: UK Government Office of Science, BIS.
Chen, C. J. P., Li, Z., Su, X., & Sun, Z. (2011). Rent-seeking incentives, corporate political connections, and the control structure of private firms: Chinese evidence.Journal of Corporate Finance, 17(2), 229–243.
Criscuolo, C., Martin, R., Overman, H., & van Reenen, J. (2012).The causal effects of an industrial policy (no. w17842). National Bureau of Economic Research.
Gordon, R. J. (2012).Is US economic growth over? Faltering innovation confronts the six headwinds (no. w18315). National Bureau of Economic Research.
Grossman, G. M., & Krueger, A. B. (1995). Economic growth and the environment.The Quarterly Journal of Economics, 110(2), 353–377.
Haeri, A., & Arabmazar, A. (2018).Designing an industrial policy for developing countries: A new approach (no. 89048). Munich Personal RePEc Archive.
Han, Y., Huang, L., & Wang, X. (2017). Do industrial policies promote industrial structure upgrading? Theory and evidence from China’s development.Economic Research Journal, 8, 33–48.
Hanushek, E. A., & Woessmann, L. (2012). Do better schools lead to more growth? Cognitive skills, economic outcomes, and causation.Journal of Economic Growth, 17(4), 267–321.
Hausmann, R., & Rodrik, D. (2003). Economic development as self-discovery.Journal of Development Economics, 72(2), 603–633.
Huang, Q. (2014).“The new Normal”, the late stage of industrialization and the new power of industrial growth.China Industrial Economics, 10, 5–19.
Jin, B. (2015). Study on the new Normal of Chinese economic development.China Industrial Economics, 1, 5–18.
Ju, J., Lin, J., & Wang, Y. (2011).Marshallian externality, industrial upgrading, and industrial policies. World Bank Policy Working Paper. No.5796.
Krueger, A. O., & Tuncer, B. (1982). An empirical test of the infant industry argument.The American Economic Review, 72(5), 1142–1152.
Kuznets, S. (1973). Modern economic growth: Findings and reflections.The American Economic Review, 63(3), 247–258. Li, W., & Zheng, M. (2016). Is it substantive innovation or strategic innovation? Impact of macroeconomic policies on
micro-enterprises’innovation.Economic Research Journal, 4, 60–73.
Lin, Y. (2012).New structural economics: Reflections on the theoretical framework of economic development and policy. Beijing: Peking University Press.
Lin, Y., Wu, H., & Xing, Y. (2010).“Wave phenomenon”and formation of excess capacity.Economic Research Journal, 10, 4–19. Nathan, M., & Overman, H. (2013). Agglomeration, clusters, and industrial policy.Oxford Review of Economic Policy,
29(2), 383–404.
Pack, H., & Saggi, K. (2006). The case for industrial policy: A critical survey.Policy Research Working Paper, 3022(2), 368–379. Rodrik, D. (1996). Understanding economic policy reform.Journal of Economic Literature, 34(1), 9–41.
Sanjaya, L. (2004).Reinventing industrial strategy: The role of government policy in building industrial competitiveness (no. 28). United Nations conference on trade and development.
Song, L., & Wang, X. (2013). Key industrial policies, resource resetting and industrial productivity.Management World, 12, 63–77.
Stiglitz, J. E. (1993). The role of the state in financial markets.The World Bank Economic Review, 7(suppl_1), 19–52. Theil, H. (1967).Economics and information theory. Amsterdam, Netherlands: North-Holland Publishing Company. Wang, T., & Qi, J. (1996).Industrial policy and economic growth. Beijing: Social Sciences Academic Press.
Wang, Y. (2017). On efficient market and facilitating state: Industrial policies from new structural economics perspective.Study and Exploration, 4, 100–104.
Yang, Q. (2011). The growth of enterprises: To build political connections or capability?Economic Research Journal, 10, 54–66. Yu, B. (2015). Economic growth effects of industrial restructuring and productivity improvement: Analysis of dynamic spatial
panel model with Chinese city data.China Industrial Economics, 12, 83–98.
Yu, M., Fan, R., & Zhong, H. (2016). Chinese industrial policy and corporate technological innovation.China Industrial Economics, 12, 5–22.
Yuan, J., Hou, Q., & Cheng, C. (2015). The curse effect of enterprise political resources: An investigation based on political connection and enterprise technology innovation.Management World, 1, 139–155.
Zhang, J., Wu, G., & Zhang, J. (2004). The estimation of China’s provincial capital stock: 1952–2000.Economic Research Journal, 10, 35–44.
Publisher’s Note