R E S E A R C H
Open Access
Association of the tumor necrosis
factor-alpha promoter polymorphism with change
in triacylglycerol response to sequential
meals
Kim G. Jackson
1,2, Yue Li
1,2, Miriam F. Ryan
3, Eileen R. Gibney
3, Lorraine Brennan
3, Helen M. Roche
3,
Christine M. Williams
2, Julie A. Lovegrove
1,2and Karani S. Vimaleswaran
1,2*Abstract
Background:Reported associations between Tumor Necrosis Factor-alpha (TNFA) and the postprandial
triacylglycerol (TAG) response have been inconsistent, which could be due to variations in theTNFAgene, meal fat composition or participant’s body weight. Hence, we investigated the association ofTNFApolymorphism
(−308G→A) with body mass index (BMI) and postprandial lipaemia and also determined the impact of BMI on the association of the polymorphism with postprandial lipaemia.
Methods:The study participants (n= 230) underwent a sequential meal postprandial study. Blood samples were taken at regular intervals after a test breakfast (t= 0, 49 g fat) and lunch (t=330 min, 29 g fat) to measure fasting and postprandial lipids, glucose and insulin. The Metabolic Challenge Study (MECHE) comprising 67 Irish participants who underwent a 54 g fat oral lipid tolerance test was used as a replication cohort. The impact of genotype on postprandial responses was determined using general linear model with adjustment for potential confounders.
Results:The -308G→A polymorphism showed a significant association with BMI (P= 0.03) and fasting glucose (P= 0.006), where the polymorphism explained 13 % of the variation in the fasting glucose. A 30 % higher incremental area under the curve (IAUC) was observed for the postprandial TAG response in the GG homozygotes than A-allele carriers (P= 0.004) and the genotype explained 19 % of the variation in the IAUC. There was a non-significant trend in the impact of BMI on the association of the genotype with TAG IAUC (P= 0.09). These results were not statistically significant in the MECHE cohort, which could be due to the differences in the sample size, meal composition, baseline lipid profile, allelic diversity and postprandial characterisation of participants across the two cohorts.
Conclusions:Our findings suggest thatTNFA-308G→A polymorphism may be an important candidate for BMI,
fasting glucose and postprandial TAG response. Further studies are required to investigate the mechanistic effects of the polymorphism on glucose and TAG metabolism, and determine whether BMI is an important variable which should be considered in the design of future studies.
Trial registration:NCT01172951.
Keywords:Postprandial lipaemia, Triacylglycerol, TNFA promoter polymorphism, BMI, MECHE
Abbreviations:AUC, Area under the curve; BMI, Body mass index; IAUC, Incremental area under the curve; NEFA, Non-esterified fatty acid; TAG, Triacylglycerol; TNFA, Tumor necrosis factor–alpha
* Correspondence:v.karani@reading.ac.uk
1
Hugh Sinclair Unit of Human Nutrition, Department of Food and Nutritional Sciences, University of Reading, Reading, UK
2Institute for Cardiovascular and Metabolic Research (ICMR), University of
Reading, Reading, UK
Full list of author information is available at the end of the article
Background
The magnitude and duration of the postprandial triacyl-glycerol (TAG) response have been shown to be highly variable between individuals due to genetic and dietary factors [1]. Although multiple candidate genes in lipo-protein metabolism pathways have been identified [2–4], studies have indicated that genetic variants in tumor ne-crosis factor-alpha (TNF-α), a cytokine released from macrophages during inflammation, may also play an im-portant role in modulating the lipid response to high-fat meal ingestion [5, 6]. This is based on evidence, where change in serum TAG was linked to change in TNF-α after high-fat meal consumption [7]. Under post absorp-tive conditions, the infusion of a relaabsorp-tively low dose of TNF-α into healthy participants stimulated lipolysis and altered liver fat metabolism [8]. These studies suggest that TNFA could be an important candidate gene for postprandial TAG metabolism.
The most widely studied single nucleotide polymorph-ism (SNP) [−308 G→A (rs1800629)] in the promoter of TNFA gene has been shown to alter its transcriptional regulation and production [9]. Two studies have shown an association between the TNFA -308G→A poly-morphism and postprandial TAG [10, 11], while two studies failed to show an effect [6, 12]. Furthermore, TNF-αis expressed in adipocytes and correlates with the degree of adiposity [13]. The effect of this SNP on lipid and glucose metabolism has been proposed to be dependent on body mass index (BMI) [14] and differ-ences in BMI could be a reason for the discrepancy in the study findings. Hence, in the present data analysis, we examined the association of the TNFA -308G→A SNP with BMI, fasting and postprandial lipid, non-esterified fatty acid (NEFA), glucose and insulin after consumption of sequential meals in 230 participants (England) genotyped for the TNFA polymorphism. In addition, we also examined the impact of BMI on the as-sociation of the TNFA polymorphism with fasting and postprandial lipid, glucose and insulin response to se-quential meal ingestion. To confirm our findings, we used an Irish postprandial study, Metabolic Challenge Study (MECHE) [15], as a replication cohort.
Methods
Participants
The data analysis was performed using postprandial re-sponses from 230 healthy participants (mean age of 52 (range 22–71) y and BMI 26.3 (range 19.6–31.9) kg/m2) who had undergone the same sequential test meal proto-col at the University of Reading, England, between 1997 and 2007, as previously described [16, 17]. The studies were reviewed by the University of Reading Research Ethics Committee and the West Berkshire Health Authority Ethics Committees, and each volunteer gave
written informed consent before participating. All proto-cols and procedures were performed according to the Declaration of Helsinki.
Postprandial meal protocol
The participants underwent a novel sequential meal protocol, as previously described [18]. Briefly, partici-pants were asked to refrain from alcohol and strenuous exercise on the day before the study visit and were pro-vided with a low fat (<10 g fat) evening meal. After a 12 h overnight fasting, participants were cannulated and a blood sample was taken to measure fasting levels of lipids, glucose, NEFA and insulin. Following a test break-fast (0 min) and lunch (330 min), blood samples were taken at 60 min intervals until 480 min after the break-fast meal. The nutritional composition of the breakbreak-fast was 3.9 MJ energy, 111 g carbohydrate, 19 g protein and 49 g fat and the lunch was 2.3 MJ energy, 63 g carbohy-drate, 15 g protein and 29 g fat. The type of fat contained within the test meals was predominately saturated, with 29 g of saturated fatty acids (SFA) in the breakfast and 14 g of SFA in the lunch. No other food or drink except water and decaffeinated sugar free drinks was allowed during the study day.
Measurement of Clinical and biochemical parameters
The plasma lipid profile, glucose and insulin were mea-sured as previously described [17]. All samples for each individual were analysed within a single batch and the inter-assay coefficient of variation for the assays were less than 5 %. The homeostasis model assessment of insulin resistance (HOMA-IR) was calculated using the fasting glucose and insulin data [fasting insulin (pmol/l) x fasting glucose (mmol/l)]/135] [19].
Genotyping
DNA was isolated from the buffy coat layer of 10 ml of EDTA blood using the Qiagen DNA Blood Mini Kit (Qiagen Ltd, Crawley, UK). The TNFA -308G→A (rs1800629) polymorphism was genotyped using a TaqMan SNP genotyping assay (Life Technologies). The genotype distribution was in Hardy-Weinberg equilib-rium (P= 0.46).
Replication cohort
Study participants
Postprandial meal protocol
The participants (44 men/23 women) underwent an oral lipid tolerance test (OLTT) following a 12 h overnight fast [20]. The OLTT consisted of 100 mL Calogen (Nutricia, Ireland) combined with 50 mL Liquid Duocal (SHS Nutrition, Netherlands) which contained 54 g fat (7 g SFA, 31 g monounsaturated fatty acids, 16 g polyun-saturated fatty acids) and 16 g carbohydrate (550 kcal).
Measurement of clinical and biochemical parameters Clinical chemistry analysis was performed using a RxDaytona™chemical analyser autoanalyser (Randox La-boratories, Crumlin, UK) and Randox reagents. The plasma lipid profile, glucose and insulin were measured as previously described [15].
Genotyping
DNA was isolated from the buffy coat layer of EDTA blood using a Gentra Autopure LS robotic workstation (Qiagen Ltd, Crawley, UK). The TNFA -308G→A (rs1800629) polymorphism was genotyped by LGC Gen-omics (www.lgcgenGen-omics.com) using their proprietary KASPar polymerase chain reaction technique. Genotype distribution was in Hardy-Weinberg equilibrium (P< 0.05).
Statistical analysis
All statistical analyses were performed using SPSS software, version 21. All biochemical outcomes were expressed as means and SEM, checked for normality and transformed where necessary. BMI cut-off <25 kg/m2(normal weight) and ≥25 kg/m2 (overweight/obese) was based on criteria from the World Health Organization [21]. The total area under the variable versus time curves (AUC) was calcu-lated using the trapezium rule for postprandial TAG, glu-cose and insulin for 0–480 min. Incremental AUC (IAUC, 0–480 min) was calculated as AUC minus the fasting con-centration. NEFA AUC and IAUC responses were calcu-lated from the time of suppression until the end of the postprandial period (120–480 min). The impact of geno-type on postprandial (AUC and IAUC) responses was de-termined using general linear model with adjustment for age, gender and BMI. Theχ2test was used to compare the proportions of genotypes or alleles. Due to the small num-ber of homozygotes (AA) in the postprandial cohorts, indi-viduals homozygous (AA) and heterozygous (GA) for the polymorphism were grouped together for statistical ana-lyses.P≤0.05 was considered statistically significant.
Results
Association of the TNFA -308G→A polymorphism with BMI and baseline biochemical parameters
There were significant associations of theTNFA -308G→ A polymorphism with BMI (P= 0.03) and fasting glucose concentration (P= 0.006). There was also a significant
difference between the normal weight and overweight/ obese groups with respect to theTNFA -308G→A poly-morphism (P= 0.001), where the proportion of over-weight/obese individuals with GG genotypes (79 %) was higher than that of the normal weight individuals with GG genotypes (60 %). Given the significant difference between the two BMI groups, sub-group analysis was per-formed in the normal weight (n= 94) and overweight/ obese (N= 136) participants. The genetic effect on fasting glucose was significant only in overweight/ obese group (P= 0.005), with 7.4 % higher concentra-tion in GG genotype than A-allele carriers. The vari-ation in fasting glucose that can be explained by this SNP was 13 % in the overweight/obese group. The baseline demographic and biochemical characteristics of the participants stratified by genotypes in normal weight (BMI < 25 kg/m2) and overweight/obese (BMI≥
25 kg/m2) participants are presented in Table 1.
Association of the TNFA -308G→A polymorphism with postprandial biochemical parameters
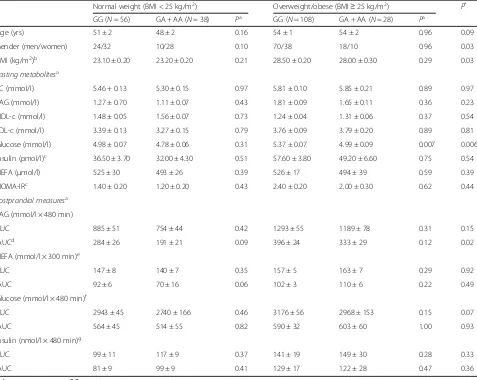
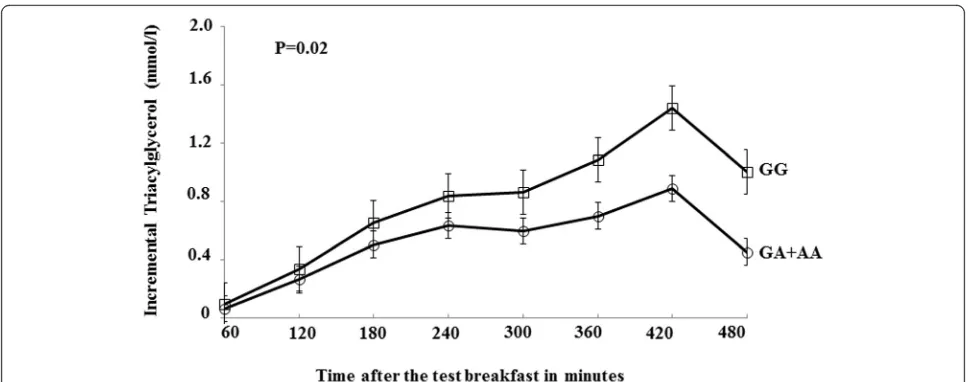
Following the high-fat meals (breakfast and lunch), a sig-nificant effect of this SNP was observed on the TAG IAUC (P= 0.02) but not AUC (P= 0.15), where the GG genotype group had 30 % higher TAG IAUC than A-allele carriers (Fig. 1). The polymorphism explained 19 % of the variation in the TAG IAUC. There was no differ-ence in postprandial NEFA, glucose or insulin responses observed between genotypes (Table 1). When stratified as BMI <25 kg/m2 (normal weight) and ≥25 kg/m2 (over-weight/obese), there was a trend in the association of the SNP with TAG IAUC in the normal weight group but the findings were not statistically significant (P= 0.09). Given the previous gender-specific associations observed in this postprandial study [18, 22], stratification by gender was also performed and found that the genetic associations on TAG IAUC were significant in men (GG, 439 ± 26 mmol/l x 480 min,n= 92;GA + AA, 320 ± 30 mmol/l x 480 min, n= 27;P= 0.03) but not in women (GG, 249 ± 19 mmol/l x 480 min,n= 70;GA + AA, 194 ± 21 mmol/l x 480 min, n= 37;P= 0.39).
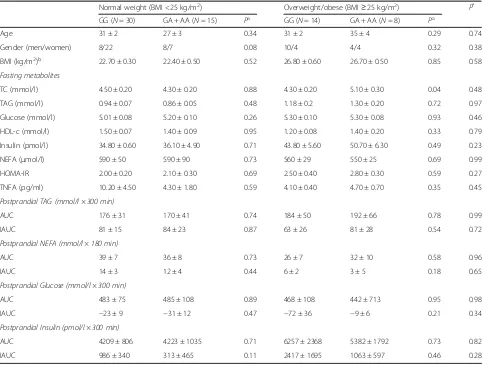
Replication of the findings in the Irish cohort
Discussion
There are two important findings in this study. Firstly, there is an independent association ofTNFA-308G→A polymorphism with BMI and fasting glucose concentra-tion. Secondly, there was a genotype effect observed on the TAG IAUC, with a higher response in the GG than A allele carriers after the sequential meals.
Several polymorphisms have been identified in the promoter region of theTNFAgene [23, 24]; however, to date, −308G→A polymorphism (rs1800629) has been
the best characterized genetic variant in relation to metabolic and cardiovascular disease outcomes [24–26]. The TNFA -308G→A polymorphism has been linked with BMI and obesity [13, 27], where A allele carriers have been shown to have higher BMI [27]. In contrast but in line with a few studies [11, 28], we observed a higher proportion of GG homozygotes in the over-weight/obese than normal weight group, where they also exhibited higher fasting glucose concentrations than the A allele carriers. Our finding is biologically plausible
Table 1Fasting and postprandial metabolites and characteristics according to theTNFA-380G→A polymorphism stratified by body mass index in the UK postprandial cohort
Normal weight (BMI < 25 kg/m2) Overweight/obese (BMI≥25 kg/m2) P*
GG (N= 56) GA + AA (N= 38) Pa GG (N= 108) GA + AA (N= 28) Pa
Age (yrs) 51 ± 2 48 ± 2 0.16 54 ± 1 54 ± 2 0.96 0.09
Gender (men/women) 24/32 10/28 0.10 70/38 18/10 0.96 0.03
BMI (kg/m2)b 23.10 ± 0.20 23.20 ± 0.20 0.21 28.50 ± 0.20 28.00 ± 0.30 0.29 0.03
Fasting metabolitesa
TC (mmol/l) 5.46 + 0.13 5.30 ± 0.15 0.97 5.81 ± 0.10 5.85 ± 0.21 0.89 0.97
TAG (mmol/l) 1.27 ± 0.70 1.11 ± 0.07 0.43 1.81 ± 0.09 1.65 ± 0.11 0.36 0.23
HDL-c (mmol/l) 1.48 ± 0.05 1.56 ± 0.07 0.73 1.24 ± 0.04 1.31 ± 0.06 0.37 0.54
LDL-c (mmol/l) 3.39 ± 0.13 3.27 ± 0.15 0.79 3.76 ± 0.09 3.79 ± 0.20 0.89 0.81
Glucose (mmol/l) 4.98 ± 0.07 4.78 ± 0.06 0.31 5.37 ± 0.07 4.99 ± 0.09 0.007 0.006
Insulin (pmol/l)c 36.50 ± 3.70 32.00 ± 4.30 0.51 57.60 ± 3.80 49.20 ± 6.60 0.75 0.54
NEFA (μmol/l) 525 ± 30 493 ± 26 0.39 526 ± 17 494 ± 39 0.59 0.39
HOMA-IRc 1.40 ± 0.20 1.20 ± 0.20 0.43 2.40 ± 0.20 2.00 ± 0.30 0.62 0.44
Postprandial measuresa TAG (mmol/l × 480 min)
AUC 885 ± 51 754 ± 44 0.42 1293 ± 55 1189 ± 78 0.31 0.15
IAUCd 284 ± 26 191 ± 21 0.09 396 ± 24 333 ± 29 0.12 0.02
NEFA (mmol/l × 300 min)e
AUC 147 ± 8 140 ± 7 0.35 157 ± 5 163 ± 7 0.29 0.92
IAUC 92 ± 6 70 ± 16 0.06 102 ± 3 110 ± 6 0.22 0.49
Glucose (mmol/l × 480 min)f
AUC 2943 ± 45 2740 ± 166 0.46 3176 ± 56 2968 ± 153 0.15 0.07
IAUC 564 ± 45 514 ± 55 0.82 590 ± 32 603 ± 60 1.00 0.93
Insulin (nmol/l × 480 min)g
AUC 99 ± 11 117 ± 9 0.37 141 ± 19 149 ± 30 0.28 0.33
IAUC 81 ± 9 99 ± 9 0.41 129 ± 17 122 ± 28 0.47 0.36
Values represent mean ± S.E. mean
As the AA homozygotes were rare (1.7 %), all analyses were conducted by comparing GG homozygotes A allele carriers (GA + AA)
Abbreviations:AUC, area under the curve,BMIbody mass index,HDL-chigh density lipoprotein cholesterol,HOMA-IRhomeostasis model assessment of insulin resistance,IAUCincremental area under the curve,LDL-clow density lipoprotein cholesterol,NEFAnon-esterified fatty acids,TAGtriacylglycerol,TC
total cholesterol a
Adjusted for age, gender, and body mass index b
Adjusted for age, and gender c
BMI < 25, GG (N= 34), A (N= 19); BMI≥25, GG (N= 79), A (N= 19) d
BMI < 25, GG (N= 56), A (N= 37); BMI≥25, GG (N= 106), A (N= 26) e
BMI < 25, GG (N= 36), A (N= 19); BMI≥25, GG (N= 84), A (N= 21) f
BMI < 25, GG (N= 36), A (N= 20); BMI≥25, GG (N= 86), A (N= 22) g
BMI < 25, GG (N= 15), A (N= 7); BMI≥25, GG (N= 35), A (N= 10) *
given that obese patients have been shown to have an abnormal postprandial lipaemia response due to post-prandial changes in endogenous lipoproteins as a result of insulin resistance [29]. Hence, it is possible that GG homozygotes with higher BMI and fasting glucose con-centrations are likely to exhibit higher postprandial TAG levels. BMI may therefore be an important variable that determines the impact of this polymorphism on the postprandial TAG response, and should be considered in the design of future studies.
The impact of genotype on the incremental change in TAG response to sequential meal ingestion showed a non-significant trend in the normal weight participants, which is interesting given the tendency for higher overall fasting TAG and postprandial TAG responses in the overweight/obese group. Calculation of TAG IAUC rep-resents both the production and clearance of TAG-rich lipoproteins (TRLs) from the circulation, two highly in-sulin dependent processes also known to be modulated by TNF-α. High levels of TNF-αhave been shown to in-hibit lipoprotein lipase activity in vitro[30] and enhance the production of liver-derived TRL [31] and adiposity has been reported to potentiate the effects of theTNFA polymorphism on lipid metabolism and insulin resist-ance. Defective insulin secretion and action can lead to an exaggerated TAG response to a high fat meal, but we only found a tendency for a higher HOMA-IR in the overweight/obese group, with a lack of an effect of the polymorphism on postprandial NEFA and glucose re-sponses. It is therefore possible that higher background circulating levels of TNF-αobserved in obese individuals [32] may have contributed to the higher fasting and postprandial TAG response, and masked the subtle
effects of this polymorphism on TRL metabolism. How-ever, TNF- αwas not measured in the UK postprandial cohort which makes it difficult to determine the mecha-nisms underlying the difference in response between the two genotype groups. Although the MECHE data showed a tendency for higher TNF- αin the GG group, this finding was not significant.
A few studies have examined the association between TNFA -308G→A polymorphism and postprandial lip-aemia but findings have been inconsistent. In obese fam-ilies, Wybranska et al., found men carrying the A allele to have higher fasting glucose and postprandial TAG and NEFA responses following an oral fat load whilst women had higher HOMA-IR [10]. However, a lack of an association between the polymorphism and postpran-dial lipid responses have been reported after sequential high fat meals in obese type 2 diabetic individuals [6] and a single meal containing 65.5 g of dairy fat in off-spring of patients diagnosed with cardiovascular disease (CVD) [12]. Our findings are in accordance with a study in CVD patients classified with the metabolic syndrome (MetS), where GG homozygotes had a significantly higher postprandial TAG response than A-allele carriers after a single high fat meal (0.7 g fat/kg body weight containing on average 62 g of fat) [11]. Unlike the study of Gomez-Delgado et al. [11], we also observed a signifi-cant effect of genotype on fasting glucose, with higher levels in the GG than GA and AA groups combined. Similar observations have been reported in the LIPGENE cohort, with an increased risk of developing fasting hyperglycaemia and MetS in GG homozygotes [33]. Dis-agreement in the relationship between -308A and -308G alleles and fasting glucose and lipid responses may
reflect the study populations (type 2 diabetic, obese, MetS and familial history of CVD) since expression of the biochemical phenotype of this polymorphism has been proposed to be dependent on the presence of other CVD risk factors [6]. This may explain the similarity of our findings with the Spanish study since 53 % of men in our cohort could be classified with the MetS [16]. In addition, the differences in the allelic effects could be due to the variations in the genotype frequencies across the European cohorts as shown by dbSNP (http://www.ncbi. nlm.nih.gov/projects/SNP/snp_ref.cgi?rs=1800629). Hence, it is possible that the same allelic effect seen in the Spanish study [11] but not seen in the Polish study [10] could be due to differences in the linkage dis-equilibrium map across European populations.
A limitation of our study is the inability to replicate our findings in a suitable large postprandial cohort. Al-though we used the Irish postprandial study (MECHE) [15] as a replication cohort, we were unable to replicate the findings due to several reasons. Whilst the two pop-ulations were examined for impact ofTNFA -308G→A polymorphism on postprandial lipaemia, there may have been other genetic variations [34] which could have an impact, but were not controlled for in this analysis. Fur-thermore, the replication cohort underwent an OLTT which did not follow the same post-prandial meal com-position as that of the UK postprandial cohort and hence could have had different consequences on the pa-rameters considered. Also, we cannot rule out the fact that our findings in the UK postprandial cohort could be
Table 2Fasting and postprandial metabolites and characteristics according to theTNFA-380G→A polymorphism stratified by body mass index in the Metabolic Challenge Study (Replication cohort)
Normal weight (BMI <25 kg/m2) Overweight/obese (BMI≥25 kg/m2) P*
GG (N= 30) GA + AA (N= 15) Pa GG (N= 14) GA + AA (N= 8) Pa
Age 31 ± 2 27 ± 3 0.34 31 ± 2 35 ± 4 0.29 0.74
Gender (men/women) 8/22 8/7 0.08 10/4 4/4 0.32 0.38
BMI (kg/m2)b 22.70 ± 0.30 22.40 ± 0.50 0.52 26.80 ± 0.60 26.70 ± 0.50 0.85 0.58
Fasting metabolites
TC (mmol/l) 4.50 ± 0.20 4.30 ± 0.20 0.88 4.30 ± 0.20 5.10 ± 0.30 0.04 0.48
TAG (mmol/l) 0.94 ± 0.07 0.86 ± 0.05 0.48 1.18 ± 0.2 1.30 ± 0.20 0.72 0.97
Glucose (mmol/l) 5.01 ± 0.08 5.20 ± 0.10 0.26 5.30 ± 0.10 5.30 ± 0.08 0.93 0.46
HDL-c (mmol/l) 1.50 ± 0.07 1.40 ± 0.09 0.95 1.20 ± 0.08 1.40 ± 0.20 0.33 0.79
Insulin (pmol/l) 34.80 ± 0.60 36.10 ± 4.90 0.71 43.80 ± 5.60 50.70 ± 6.30 0.49 0.23
NEFA (μmol/l) 590 ± 50 590 ± 90 0.73 560 ± 29 550 ± 25 0.69 0.99
HOMA-IR 2.00 ± 0.20 2.10 ± 0.30 0.69 2.50 ± 0.40 2.80 ± 0.30 0.59 0.27
TNFA (pg/ml) 10.20 ± 4.50 4.30 ± 1.80 0.59 4.10 ± 0.40 4.70 ± 0.70 0.35 0.45
Postprandial TAG (mmol/l × 300 min)
AUC 176 ± 31 170 ± 41 0.74 184 ± 50 192 ± 66 0.78 0.99
IAUC 81 ± 15 84 ± 23 0.87 63 ± 26 81 ± 28 0.54 0.72
Postprandial NEFA (mmol/l × 180 min)
AUC 39 ± 7 36 ± 8 0.73 26 ± 7 32 ± 10 0.58 0.96
IAUC 14 ± 3 12 ± 4 0.44 6 ± 2 3 ± 5 0.18 0.65
Postprandial Glucose (mmol/l × 300 min)
AUC 483 ± 75 485 ± 108 0.89 468 ± 108 442 ± 713 0.95 0.98
IAUC −23 ± 9 −31 ± 12 0.47 −72 ± 36 −9 ± 6 0.21 0.34
Postprandial Insulin (pmol/l × 300 min)
AUC 4209 ± 806 4223 ± 1035 0.71 6257 ± 2368 5382 ± 1792 0.73 0.82
IAUC 986 ± 340 313 ± 465 0.11 2417 ± 1695 1063 ± 597 0.46 0.28
Values represent mean ± S.E. mean
As there was only one participant with AA homozygous genotype, all analyses were conducted by comparing GG homozygotes and A allele carriers (GA + AA) Abbreviations:AUCarea under the curve,IAUC, incremental area under the curve,BMIbody mass index,TAGtriacylglycerol,TCtotal cholesterol,HDL-chigh density lipoprotein cholesterol
a
Adjusted for age, gender, and BMI, wherever appropriate b
Adjusted for age, and gender *
a chance finding due to small sample size (n= 67). How-ever, this is unlikely given the previous link between the TNFA-308G→A polymorphism and BMI [35, 36], fast-ing glucose [37] and postprandial lipaemia [10, 11]. An-other limitation is the difference in the proportion of men and women in each of the genotype groups within the BMI sub-groups but to account for this the general linear model was adjusted for gender and age in all of the analyses. Also, the gender- specific association of the SNP with postprandial TAG in our cohort confirms our previous findings in men [17].
Conclusions
Our findings indicate that the TNFA -308G→A poly-morphism is independently associated with BMI, fasting glucose concentration and incremental postprandial TAG response to sequential meal ingestion. Further studies are warranted to investigate the mechanisms underlying the effect of the TNFA polymorphism on glucose and TAG metabolism, and determine whether BMI is an important variable which should be considered in the design of future studies.
Acknowledgements
The authors wish to thank Mrs Jan Luff for her help with volunteer recruitment and Dr Esti Olano Martin and Ms Fiona Tang for their help with the genotyping analysis.
Funding
Dr Karani S Vimaleswaran acknowledges support from the British Nutrition Foundation. The baseline data used for the genotyping analysis was derived from postprandial studies supported by grants from the BBSRC (Reference no. D18350), DEFRA, Unilever Research, Roche Vitamins Ltd, the Agri-Food LINK programme, Raffinerie Tirlemontoise (ORAFTI) and Nestlé between 1996 and 2000. The MECHE study received funding from the Irish Department of Agriculture, Food & the Marine (NDP 2007–2013) as part of the JINGO Nutrigenomics program (www.ucd.ie/jingo).
Authors’contribution
KSV performed the statistical analysis. KSV, KGJ and YL drafted the manuscript. CMW, JAL, and KGJ designed the postprandial study (University of Reading, UK) and MFR, LB, HR and EGR designed the MECHE study (Ireland). KSV, KJ, CMW, JAL, EGR and MPR critically reviewed the manuscript. All authors contributed to and approved the final version of the manuscript. The authors had no conflicts of interest.
Competing interests
The authors declare that they have no competing interests.
Ethics approval and consent to participate
The postprandial study that was conducted at Reading was reviewed by the University of Reading Research Ethics Committee and the West Berkshire Health Authority Ethics Committees, and each volunteer gave written informed consent before participating. All protocols and procedures were performed according to the Declaration of Helsinki.
Ethical approval for the MECHE study was obtained from the Research Ethics Committees at UCD and St Vincent’s University Hospital Dublin. All participants provided written informed consent. MECHE was registered under NCT01172951 at Clinicaltrials.gov.
Author details
1Hugh Sinclair Unit of Human Nutrition, Department of Food and Nutritional
Sciences, University of Reading, Reading, UK.2Institute for Cardiovascular and
Metabolic Research (ICMR), University of Reading, Reading, UK.3UCD Institute
of Food & Health, University College Dublin, Dublin, Ireland.
Received: 3 May 2016 Accepted: 6 July 2016
References
1. Jackson KG, Poppitt SD, Minihane AM. Postprandial lipemia and cardiovascular disease risk: Interrelationships between dietary, physiological and genetic determinants. Atherosclerosis. 2012;220(1):22–33.
2. Corella D, Ordovas JM. Single nucleotide polymorphisms that influence lipid metabolism: Interaction with Dietary Factors. Annu Rev Nutr. 2005;25:341–90. 3. Perez-Martinez P, Delgado-Lista J, Perez-Jimenez F, Lopez-Miranda J. Update
on genetics of postprandial lipemia. Atheroscler Suppl. 2010;11(1):39–43. 4. Ordovas JM, Corella D. Genetic variation and lipid metabolism: modulation
by dietary factors. Curr Cardiol Rep. 2005;7(6):480–6.
5. Burdge GC, Calder PC. Plasma cytokine response during the postprandial period: a potential causal process in vascular disease? Br J Nutr. 2005;93(1):3–9. 6. Fontaine-Bisson B, Wolever TM, Chiasson JL, Rabasa-Lhoret R, Maheux P,
Josse RG, et al. Tumor necrosis factor alpha -238G > A genotype alters postprandial plasma levels of free fatty acids in obese individuals with type 2 diabetes mellitus. Metabolism. 2007;56(5):649–55.
7. Nappo F, Esposito K, Cioffi M, Giugliano G, Molinari AM, Paolisso G, et al. Postprandial endothelial activation in healthy subjects and in type 2 diabetic patients: role of fat and carbohydrate meals. J Am Coll Cardiol. 2002;39(7):1145–50.
8. Plomgaard P, Fischer CP, Ibfelt T, Pedersen BK, van Hall G. Tumor necrosis factor-alpha modulates human in vivo lipolysis. J Clin Endocrinol Metab. 2008;93(2):543–9.
9. Kroeger KM, Carville KS, Abraham LJ. The−308 tumor necrosis factor-alpha promoter polymorphism effects transcription. Mol Immunol. 1997;34(5):391–9. 10. Wybranska I, Malczewska-Malec M, Niedbal S, Naskalski JW, Dembinska-Kiec A. The TNF-alpha gene NcoI polymorphism at position−308 of the promoter influences insulin resistance, and increases serum triglycerides after postprandial lipaemia in familiar obesity. Clin Chem Lab Med. 2003;41(4):501–10.
11. Gomez-Delgado F, Alcala-Diaz JF, Garcia-Rios A, Delgado-Lista J, Ortiz-Morales A, Rangel-Zuniga O, et al. Polymorphism at the TNF-alpha gene interacts with Mediterranean diet to influence triglyceride metabolism and inflammation status in metabolic syndrome patients: From the CORDIOPREV clinical trial. Mol Nutr Food Res. 2014;58(7):1519–27.
12. Nicaud V, Raoux S, Poirier O, Cambien F, O’Reilly DS, Tiret L. The TNF alpha/ G-308A polymorphism influences insulin sensitivity in offspring of patients with coronary heart disease: the European Atherosclerosis Research Study II. Atherosclerosis. 2002;161(2):317–25.
13. Tzanavari T, Giannogonas P, Karalis KP. TNF-alpha and obesity. Curr Dir Autoimmun. 2010;11:145–56.
14. Pihlajamaki J, Ylinen M, Karhapaa P, Vauhkonen I, Laakso M. The effect of the -308A allele of the TNF-alpha gene on insulin action is dependent on obesity. Obes Res. 2003;11(7):912–7.
15. Morris C, O’Grada C, Ryan M, Roche HM, Gibney MJ, Gibney ER, et al. Identification of differential responses to an oral glucose tolerance test in healthy adults. PLoS One. 2013;8(8):e72890.
16. Jackson KG, Clarke DT, Murray P, Lovegrove JA, O’Malley B, Minihane AM, et al. Introduction to the DISRUPT postprandial database: subjects, studies and methodologies. Genes Nutr. 2010;5(1):39–48.
17. Vimaleswaran KS, Minihane AM, Li Y, Gill R, Lovegrove JA, Williams CM, et al. The APOB insertion/deletion polymorphism (rs17240441) influences postprandial lipaemia in healthy adults. Nutr Metab (Lond). 2015;12:7. 18. Jackson KG, Walden CM, Murray P, Smith AM, Lovegrove JA, Minihane AM,
et al. A sequential two meal challenge reveals abnormalities in postprandial TAG but not glucose in men with increasing numbers of metabolic syndrome components. Atherosclerosis. 2012;220(1):237–43.
19. Matthews DR, Hosker JP, Rudenski AS, Naylor BA, Treacher DF, Turner RC. Homeostasis model assessment: insulin resistance and beta-cell function from fasting plasma glucose and insulin concentrations in man. Diabetologia. 1985; 28(7):412–9.
21. Obesity: preventing and managing the global epidemic. Report of a WHO consultation.World Health Organ Tech Rep Ser. Geneva, Switzerland: World Health Organization; 2000; 894:i-xii, 1–253.
22. Jackson KG, Delgado-Lista J, Gill R, Lovegrove JA, Williams CM, Lopez-Miranda J, et al. The leptin receptor Gln223Arg polymorphism (rs1137101) mediates the postprandial lipaemic response, but only in males. Atherosclerosis. 2012;225(1): 135–41.
23. Valenti L, Fracanzani AL, Dongiovanni P, Santorelli G, Branchi A, Taioli E, et al. Tumor necrosis factor alpha promoter polymorphisms and insulin resistance in nonalcoholic fatty liver disease. Gastroenterology. 2002;122(2):274–80. 24. Wang HG, Yang J, Han H, Xu F, Bian Y, Zhang H, et al. TNF-alphaG-308A
polymorphism is associated with insulin resistance: a meta-analysis. Genet Mol Res. 2015;14(1):563–73.
25. Fontaine-Bisson B, Wolever TM, Chiasson JL, Rabasa-Lhoret R, Maheux P, Josse RG, et al. Genetic polymorphisms of tumor necrosis factor-alpha modify the association between dietary polyunsaturated fatty acids and fasting HDL-cholesterol and apo A-I concentrations. Am J Clin Nutr. 2007; 86(3):768–74.
26. Brand E, Schorr U, Kunz I, Kertmen E, Ringel J, Distler A, et al. Tumor necrosis factor-alpha–308 G/A polymorphism in obese Caucasians. Int J Obes Relat Metab Disord. 2001;25(4):581–5.
27. Sookoian SC, Gonzalez C, Pirola CJ. Meta-analysis on the G-308A tumor necrosis factor alpha gene variant and phenotypes associated with the metabolic syndrome. Obes Res. 2005;13(12):2122–31.
28. Wang Y, Ng MC, So WY, Ma R, Ko GT, Tong PC, et al. Association between tumour necrosis factor-alpha G-308A polymorphism and risk of nephropathy in obese Chinese type 2 diabetic patients. Nephrol Dial Transplant. 2005;20(12):2733–8.
29. Guerci B, Verges B, Durlach V, Hadjadj S, Drouin P, Paul JL. Relationship between altered postprandial lipemia and insulin resistance in
normolipidemic and normoglucose tolerant obese patients. Int J Obes Relat Metab Disord. 2000;24(4):468–78.
30. Kawakami M, Murase T, Ogawa H, Ishibashi S, Mori N, Takaku F, et al. Human recombinant TNF suppresses lipoprotein lipase activity and stimulates lipolysis in 3 T3-L1 cells. J Biochem. 1987;101(2):331–8. 31. Qin B, Dawson H, Anderson RA. Elevation of tumor necrosis factor-alpha
induces the overproduction of postprandial intestinal apolipoprotein B48-containing very low-density lipoprotein particles: evidence for related gene expression of inflammatory, insulin and lipoprotein signaling in enterocytes. Exp Biol Med (Maywood). 2010;235(2):199–205.
32. Zha JM, Di WJ, Zhu T, Xie Y, Yu J, Liu J, et al. Comparison of gene transcription between subcutaneous and visceral adipose tissue in Chinese adults. Endocr J. 2009;56(8):935–44.
33. Phillips CM, Goumidi L, Bertrais S, Ferguson JF, Field MR, Kelly ED, et al. Additive effect of polymorphisms in the IL-6, LTA, and TNF-{alpha} genes and plasma fatty acid level modulate risk for the metabolic syndrome and its components. J Clin Endocrinol Metab. 2010;95(3):1386–94.
34. Leslie S, Winney B, Hellenthal G, Davison D, Boumertit A, Day T, et al. The fine-scale genetic structure of the British population. Nature. 2015;519(7543): 309–14.
35. Joffe YT, van der Merwe L, Carstens M, Collins M, Jennings C, Levitt NS, et al. Tumor necrosis factor-alpha gene−308 G/A polymorphism modulates the relationship between dietary fat intake, serum lipids, and obesity risk in black South African women. J Nutr. 2010;140(5):901–7.
36. Corbalan MS, Marti A, Forga L, Patino A, Martinez-Gonzalez MA, Martinez JA. Influence of two polymorphisms of the tumoral necrosis factor-alpha gene on the obesity phenotype. Diabetes Nutr Metab. 2004;17(1):17–22. 37. Ishii T, Hirose H, Saito I, Nishikai K, Maruyama H, Saruta T. Tumor necrosis
factor alpha gene G-308A polymorphism, insulin resistance, and fasting plasma glucose in young, older, and diabetic Japanese men. Metabolism. 2000;49(12):1616–8.
• We accept pre-submission inquiries
• Our selector tool helps you to find the most relevant journal • We provide round the clock customer support
• Convenient online submission • Thorough peer review
• Inclusion in PubMed and all major indexing services • Maximum visibility for your research
Submit your manuscript at www.biomedcentral.com/submit