2689
Relationship Between Perception And Consumers’
Preferences Of Patin Fish
Asmaida, Mulyani, Nida Kemala, Syahrizal
Abstract: Patin is a source of animal protein that is easy to obtain, taste good, cheap price, meat low sodium so easily digestible by the intestines, containing calcium, iron and mineral very good for health, so the Patin fish are in demand Consumer. This research aims (1) to know the perception of consumers to Patin fish in Jambi City, (2) know the preference of consumers to Patin fish in Jambi City, and (3) analyzing the relationship between perception and consumer preference to Patin fish in Jambi City. The research method is a survey method using questionnaires. Number of samples of 50 housewives. Descriptive analysis is used to obtain an overview of consumers’ perception and preference for Patin fish in Jambi city. The CHI-Square test is used to analyze the relationship between perception and consumer preference to Patin fish in Jambi city. The results showed 84% of consumers’ perception of Patin in Jambi city is positive because consumers rate healthy Patin for consumption, containing excellent nutritional value for health, tastes good, easy in Processing, easy to obtain, high levels of freshness, and relatively inexpensive price. Consumer preference of Patin fish in Jambi city as much as 84% chose Patin fish for consumption. Perception with consumer preference to Patin fish in Jambi City showed strong positive relationship, which increasingly positive consumer perception of Patin fish the higher the preference of consumers to choose Patin fish.
Index Terms: Relationships, Perception, Preference, Patin Fish
—————————— ——————————
1. INTRODUCTION
In meeting the need for protein, the fisheries sector plays an important role because fish is one of the sources of animal protein that is relatively easy to obtain, the price is cheap, the meat is low in sodium so it is suitable for people on a diet of salt and easily digested by the intestine and contains calcium, iron and minerals which are very good for health (Herwono, 2001). Choo and Wiliams in Waysima, 2011, stated that fish is a high source of protein, fat, calcium, phosphorus, iron and zinc, besides that it contains iodine and omega-3 acids with high concentrations. Burdge (2004) added fish containing Omega-3, EPA (eicosapentaenoic acid) and DHA (docasahexaenoic acid) which are beneficial for nerve, brain and retinal function and reduce the risk of heart disease. The various types of freshwater fish available in the market, Patin is relatively quite attractive to consumers, among others because it tastes good, is easy to obtain, and the price is relatively cheaper when compared to other types of freshwater fish, such as Baung, Patin, carp and fish the other. Besides Patin commercially is very important and is a river Patin that is very much in demand by consumers, especially in Sumatra and Kalimantan, and Patin also have advantages as aquaculture and have prospects (Sireger, 1983 in Dewi, 2012) (Sarina et al, 2019). Jambi, especially in the city of Jambi, is one of the centers of national Patin production. This can be seen from the national Patin production reaching 392,918 tons, from this figure Jambi provides a share of 6 percent (21,617.5 tons) of national Patin production (Ministry of Maritime Affairs and Fisheries, 2018). Based on fish commodities in Jambi Province, Patin production also showed the highest increase in average production, reaching 19,997 tons per year (Department of Maritime Affairs and Fisheries of Jambi Province, 2018).
Consumers are aware of the importance of fish as a source of animal protein, besides that Patin are also a special menu of Jambi dishes in restaurants and restaurants, so that the demand for Patin to be consumed continues to increase along with increasing population growth. The average level of consumption of Patin in Jambi Province for five years (2013-2017), in 2013 the level of fish consumption was 32.76 kg / capita / year, whereas in 2017 the level of fish consumption increased to 37.00 kg / capita / year (Ministry of Maritime Affairs and Fisheries, 2018). There are several things that become obstacles for consumers to consume fish because of the perception that fish are expensive and difficult to process (Leek et al., in Astini, 2012). And the perception of the fish is not thorny and fishy (Prell et al, in Astini, 2012). Likewise, abstinence for breastfeeding mothers not to consume fish because it will affect the taste and smell of breast milk Sulistyo et al. 2004 in Astini. 2012). The notion of fish has become a habit and diet in the community. In fact, fish is one of the main aquatic resources as a very good and prospective source of protein, fat, vitamins and minerals. Based on this, the researchers wanted to know the extent of the relationship of perception with consumer preferences for Patin in the city of Jambi.
1.1 Theory Review
According to Hermiastuti, 2013, Patin are consumption fish that live in fresh water that have general characteristics not scaly, do not have a lot of thorns, the speed of growth is relatively fast, can be mass produced and has the opportunity of industrial scale development. Furthermore, fish is an important part of a healthy diet. Oils in fish fat contain omega-3 fatty acids that are not found naturally in other foods, contributing to heart health, optimal brain function and cognition, eye and skin health, and protection against cancer (Din, Neuby and Flapan 2004; Grobe 2007).Perception is as an individual process for selecting, organizing, and interpreting information inputs that can create images of objects that have subjective truths (personal), have certain meanings, can be felt through attention, whether selectively, distortion or retention (Hasan Ali , 2009). In general there are 5 principles of perception as follows: (1) Relativity. Perception is relative, an object cannot be predicted precisely but at least it cannot be said that one exceeds the other or and in other words that a ____________________
2690 person's perception of a part of the message is largely
determined by the part that precedes the message. Perception is also influenced by the surroundings; and (2) Selectivity The five senses receive stimulation from their surroundings by seeing objects, hearing sounds, smelling odors and so on. Because the capacity to process information is limited, not all stimulation can be captured depending on one's physical and psychological factors. The organization must be organized. A well-structured experience will give by changing based on and present in a meaningful form. Direction. Directives can be made by observation, by observation can be selected and arranged and interpreted a message. The rearrangement is very important for the message maker to reduce the interpretation given by the stimulus. Cognitive difference, someone's perception can be different from one another in the same situation because of cognitive differences. Each individual mental process works in his own way depending on personality factors, such as tolerance, the level of openness and closure of thoughts and authoritarian attitudes (Van Den Ban, 1999). Consumer preferences are choices or things that consumers prefer, and these preferences are formed from consumer perceptions of products (Kotler and Armstrong, 2004). A person can always make or rank all situations / conditions from the most liked to the most disliked (Lian et al, 2018) (Tobari et al, 2018) (Irmayani et al, 2018). Philip Kotler, 2000, the relationship of consumer preferences is assumed to have three basic properties, namely:
a. Completeness. If A and B are two different product states, then the individual can always determine exactly one of the possibilities. In other words, for each of the two types of products A and B, consumers will prefer A over B, prefer B over A, like both, or dislike both. This preference ignores the cost factor in getting it.
b. Transitivity. If someone says he prefers A over B, and prefers A over C, then he must prefer A over B and C. Thus one cannot articulate his conflicting preferences.
c. Continuity. If someone says he prefers A over B, this means that all conditions under A are preferred over conditions under B.
Preference has a goal which is the final decision in the purchase process to be enjoyed by consumers so as to achieve consumer satisfaction (Pindyck and Rubinfeld, 2012). Added by Private and Handoko, 1987, consumers have the meaning as individuals who make purchases to fulfill their personal needs or household consumption.According to Ajzen, 1985 in Astini, 2012, a person's behavior depends on behavioral intentions, and behavioral intentions are influenced by three components, namely attitudes, subjective norms and perceived behavioral control (Andriani et al, 2018) (Renata et al, 2018). Thus based on this theory between attitudes and one's behavior is not always the same, because attitude is only one determinant of one's behavior. Desire or purchase intention by consumers arises after evaluating the product. Knowledge of the product is an important factor that becomes the basis of consideration when evaluating a product before consumers determine the desire to buy. Knowledge of the product is an intrinsic clue that is very important for consumers to consider
1.2 Prior Research
Based on the results of Dewi's research, 2012, about the analysis of Patin consumer behavior in Pekanbaru with a resident research population in Pekanbaru City. The research
resulted that the external and internal factors of consumers together had a positive effect on the perception of Patin consumers in the city of Pekanbaru, respectively 49.31% and 47.85%. Consumer perception has a positive effect on attitudes and preferences for consuming Patin, which is equal to 12.19%. This positive influence explains that the better the ability of consumers to research fish commodities will have an influence on attitudes or decisions that will be taken for Patin. The variable of attitude and frequency of positive caregiver towards consumer behavior in consuming Patin, that is equal to 20.45%. This means that the better the attitude of consumers will determine the decision making in purchasing Patin so that the behavior tends to consume starch fish. Research by Dewi, 2006, about the preferences of Patin consumers was carried out in Pekanbaru with a population of research populations in the city of Pekanbaru. The research results that the external and internal factors of consumers have a positive and significant effect on the preferences of Patin consumers. Internal factors have a greater impact than external factors. Internal influence in this case is the factor of consumer perception and attitude in consuming Patin because it is driven by physiological needs, pleasant feeling and taste of Patin. Research Ngadiyo, et al, 2017, titled a study of Patin consumer preferences in Kendari City, Southeast Sulawesi Province. The research resulted in fairly good and consistent consumer attitudes and behavior, which means consumers are willing to make purchases of Patin Pecel products; attribute size of 9-10 tails per kilogram becomes the main choice for consumers of Patin Pecel products. Furthermore, Yulista's research, 2002, entitled the analysis of consumer preferences for Patin in the city of Surakarta using Chi-Square analysis and Multi-attribute Fisbein analysis obtained the following results: Patin that are preferred by consumers are Patin with fresh fish attributes, more protein content, moderate level of meat hardness, thick fish meat, larger fish size and thinner fish skin thickness. While the attributes of Patin that most consumers consider in Patin purchase decisions are the attributes of fish protein content and the color attributes of fish, while the attribute that consumers pay less attention to in purchasing decisions is the thickness attribute of fish skins.
1.3 Operational Thinking Framework and Hypothesis
Based on a theoretical study and review of previous studies, the authors limit research on the relationship between perception and consumer preferences for Patin in the city of Jambi. Given the perception of Patin has a relationship with consumer preferences in consuming Patin. To see how the relationship between perception and preference, then testing is done using Chi-Square. The results of the test can have a relationship and may not have a relationship. To see the relationship between consumers' perceptions and preferences for Patin in the city of Jambi can be seen in Figure 1 below:
Consumer Perception
Patin Consumer
Preferences
Chi-Square Test
Related Not related Contingency
2691 Figure 1: Schematic of Operational Thinking Framework
From the explanation and problems that have been explained above, the hypothesis of this research is: "It is suspected that there is a relationship between perception and consumer preferences for Patin (Pangasius sp) in Jambi City.
2. RESEARCH METHOD
2.1 Place and time
This research was conducted in Jambi City. The selection of research locations was chosen intentionally (purposive, because Jambi City is one of the centers of national Patin production and Patin has become a special menu of Jambi dishes at restaurants and restaurants. The research was conducted from February to March 2019.
2.2 Sampling Technique
The population of this study is housewives who are stated as consumers or buyers who are shopping for Patin at the Four Markets in Jambi City, namely Angso Duo Market, Talang Banjar Market, Simpang Pulai Market, and Family Market. Sampling data is done by the non-probability sampling method, incidentally (incidencial sampling) the sample is unplanned and the depiction of the results of the data collection is not based on a standardized method. Non-probability sampling must be used only if we want to limit our research to descriptive statements about the sample and not make inferential statements about the population, by taking a quota sampling of 50 people (Susanto Priyono Hastono, 2014).
2.3 Data collection
The method used in this research is survey method. The type of data collected based on time is the type of cross section data, based on the measurement scale is the type of nominal data, and based on the source is from primary data obtained from housewives through direct interviews using questionnaires and secondary data obtained from reading material as well as from agencies related to this research.
2.4 Data analysis method
The collected data is tabulated and processed in the form of numbers and percentages, then the data are analyzed in a descriptive qualitative-quantitative manner to determine consumers' perceptions and preferences for Patin. Hypothesis testing is done to prove whether the hypotheses in this study were accepted or rejected through Chi-Square analysis using the PSPSS Program. This analysis is used to see the relationship between perception and consumer preferences for Patin in Jambi City, with the formula formulation (Sudjana, 2002) as follows:
=
Where : n = sample
a, b, c, d = matrix component in the contingency table
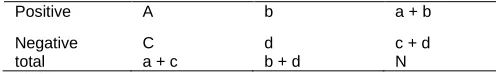
Table 1. Model Test Chi-Square (C) 2x2
Perception Preference total
Patin Non Patin
Positive A b a + b
Negative C d c + d
total a + c b + d N
Statistical Hypothesis Test: = 0 Operational Hypothesis:
Ho = There is no relationship between perception and consumer preferences for Patin.
Ha = There is a relationship between perception and consumer preferences for Patin
The rules of decision making are:
If hit <table, = 5% db = (m-1) (n-1) accept Ho or reject Ha If the table hit, = 5% db = (m-1) (n-1) reject Ho or accept Ha
The value in the 2 x 2 table with the degree (db) = 1 at the 95% confidence level is 3,841 with the following conditions: Where: m = row, n = column
Furthermore, if there is a relationship between the two variables studied, then proceed by looking at the closeness of the relationship using the contingency coefficient test (closeness of the relationship) using the formula (J. Suprapto, 1998) as follows:
C =
Where:
= The value of Chi-Square n = Number of samples (people)
C = Contingency Coefficient or degree of closeness of the relationship
The closeness categories are as follows:
C = 0-0.353 (Indicates a weak positive relationship) C = 0.354-0.707 (Showing a strong positive relationship) C = 0.8-1 (Showing perfect relationship)
3. RESEARCH RESULTS AND DISCUSSION
3.1 Consumer Perception of Patin
Perception is consumer assessment of the consequences that will be received on the attributes attached to a product. Consumer perception in this study is the perception of Patin about Patin protein content, the taste of Patin, how to process Patin, the price of Patin, so that this perception can produce a positive or negative understanding of the Patin. The number of consumer perceptions of Patin in Jambi City can be seen in the following Table 2:
Table 2. Consumer Perceptions of Patin Distribution
Perception Category
Frequency (Person)
Percentage (%) Positive
Negative
42 8
84 16
Total 50 100
2692 that is relatively easy to obtain, the price is cheaper, the meat
is low in sodium so it is suitable for people on a diet of salt and easily digested by the intestine and contains calcium, iron and minerals which are very good for health. However, consumers' assessment of the statement of Patin nutritional content is better than non-Patin fish, there are those who give positive ratings and some who give negative ratings because consumers do not agree that Patin's nutritional content is better than non-Patin. Wulandewi's statement. S, 2015, the nutritional content of fish that live in the deep sea such as salmon or tuna are better than the nutritional content of fish that live on the surface of the sea and freshwater fish, because salmon or tuna is rich in omega-3 content, which is very important for brain development the fetus and is important for the development of the nerve function and vision of the baby.
3.2 Consumer Preference for Patin
Consumer preferences can be interpreted as the final decision in the product purchase process to be enjoyed by consumers so as to achieve consumer satisfaction with the product. One product will be selected to be purchased using various criteria that are in the minds of consumers. Engel et al. (1994) say that the last stage in the consumer behavior model is the act of buying. Consumer preference in this study is consumers buy Patin or non-Patin. The preference rate for Patin in Jambi City can be seen in the following Table 3:
Table 3. Consumer Preferences of Patin Distribution
Perception Category
Frequency (Person)
Percentage (%) Patin
Non Patin
42 8
84 16
Total 50 100
Consumer preferences for Patin and non-Patin can be seen from the ability of consumers in giving reasons to strengthen their choices in accordance with the characteristics found in Patin and non-Patin. From these preferences, it shows that the majority of consumers have a preference to choose Patin, which is 84%. The high level of consumer preference for Patin because consumers like some things from Patin, namely the processing of Patin is easy because Patin do not have scales, round body shape, the size of the weight sold in the market per head is greater than non-Patin, tail shape is according to the body, weeding is easier, diversification of the product is more diverse, the texture of the meat is soft from non-Patin, and the price is cheap and also easy to obtain, thus making consumers interested in buying and consuming it. In addition to consumer preferences, the choice of Patin, there are also consumers who prefer to choose non-Patin on the grounds that consumers are not interested in some things from Patin, namely the long Patin head shape, the Patin's body color is rather bluish, the aroma of Patin is more fishy from non Patin. The data shows that most consumers have a high level of preference for Patin compared to non-Patin.
3.3 The Relationship Between Perception and Consumer Preferences of Patin
Someone's perception or assessment of an object that is positive or negative, is expected to produce a preference that is in line with that perception. A positive consumer perception of Patin is expected to result in preferences for choosing Patin as well or vice versa. The relationship between perception and consumer
preferences for Patin in Jambi City can be seen in the following Table 4:
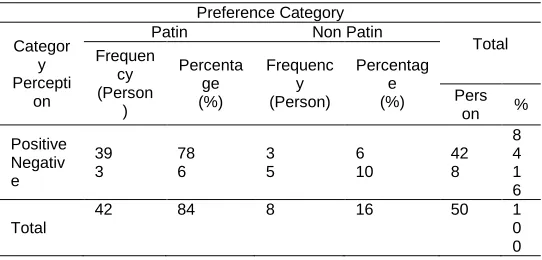
Table 4. Relationship between Perception and Consumer Preferences of Patin
Preference Category Categor
y Percepti
on
Patin Non Patin
Total Frequen
cy (Person
)
Percenta ge (%)
Frequenc y (Person)
Percentag e
(%) Pers on % Positive
Negativ e
39 3
78 6
3 5
6 10
42 8
8 4 1 6 Total
42 84 8 16 50 1
0 0 The data in Table 4 shows that consumers who have a positive perception of Patin are also followed by a high level of preference for Patin compared to non-Patin, and vice versa consumers who have a negative perception of Patin, low consumer preferences for Patin or consumers will choose non Patin. In this case, it is seen that consumers who have positive perception with preference to choose Patin are 84%, while those who have negative perception with preference to choose non-Patin are only 16%.Chi square test results, obtained a value of 11.48 greater than the table value of 3.84, where the hypothesis Ho is rejected or Ha accepted. Next contingency coefficient (C) test is performed to see the relationship the C value of 0.375 indicates a strong positive relationship. This result states that there is a strong positive relationship between perception and consumer preferences for Patin in Jambi City.
4. CONCLUSION
From the results of the research that has been conducted, the following conclusions can be drawn: (1) Consumer perception of Patin in Jambi City as much as 84% is positive, consumers assess that Patin are healthy for consumption, contain nutritional value that is very good for health, tastes good, easy to process, easy to obtain, high level of freshness, and price relatively inexpensive; (2) Consumer preferences for Patin in Jambi City as much as 84% choose Patin for consumption; and (3) Judging from the Chi Square test and co-efficient contingency, it can be concluded that there is a relationship between perception and consumer preferences for Patin in Jambi City with the closeness of a strong positive relationship. Consumers who have a positive perception of Patin are also followed by a high level of preference for Patin compared to non-Patin, and conversely consumers who have a negative perception of Patin, low consumer preferences for Patin or consumers will choose non-Patin.
REFERENCES
[1] Alulista. (2002). Analysis of consumer preferences for catfish. Surakarta.
2693 Barawijaya Press University.
[4] Astini, R., Mahardika, H.A. (2012). Pengaruh Pengetahuan dan Persepsi Resiko Terhadap Intensi Konsumsi Ikan Pada Ibu Rumah Tangga [The Influence of Knowledge and Risk Perception on the Intention of Fish Consumption in Housewives]. Jurnal Ilmu Ekonomi dan Sosial. Jilid 1, No. 1, hal 94-100.
[5] Den, B. A.W. and HS. Hawkins (1999). Agricultural extension workers. Karnisus Publisher. Yogyakarta. [6] Dewi, N. (2006). Pengaruh Faktor Eksternal dan Internal
Terhadap Preferensi Konsumen Ikan Patin (Pangasius pangasius) Di Kota Pekan Baru (The Influence of External and Internal Factors Against Consumer Preference of Patin (Pangasius pangasius) in Pekan Baru City). Jurnal Agribisnis, Vol.7, No.3, pp: 164-168.
[7] Dewi, N. (2012). Analisis Perilaku Konsumen Ikan Patin Di Kota Pekan Baru, Indonesia [Analysis of Patin Consumer Behavior in Pekan Baru, Indonesian]. Journal Of Agricultural Economies (IJAE). Vol. 3, No.2, pp: 155-162.
[8] Grobe, D. (2007). Trading off Fish health and safety : Female decision making process toward the risk of metilmercury in fish . The Journal of Counsumer Affair, Madison.
[9] Hasan, A. (2009). Marketing. Media Pressindo. Yogyakarta.
[10] Hermiastuti, M. (2013). Analisis Kadar Protein dan Identifikasi Asam Amino Pada Ikan Patin [Analysis of Protein Levels and Identification of Amino Acids in Patin]. Thesis Universitas Jamber.
[11] Herwono. (2001). Catfish Hatchery [Patin Hatchery]. Self-help Spreaders. Jakarta.
[12] Irmayani, H., Wardiah, D., & Kristiawan, M. (2018). The Strategy of SD Pusri In Improving Educational Quality. International Journal of Scientific & Technology Research, 7(7).
[13] Jurnal Sosio Agribisnis (JSA), Vol. 2 No. 1, hal 21-31. Sulawesi Tenggara.
[14] Kotler and Armstrong. (2004). "Basics of marketing". Ninth Edition. Jakarta. PT Indekz
[15] Lian, B., Kristiawan, M., & Fitriya, R. (2018). Giving Creativity Room To Students Through The Friendly School’s Program. International Journal of Scientific & Technology Research, 7(7).
[16] Ministry of Maritime Affairs and Fisheries. (2018). Annual Report (2017). Director General of Aquaculture, Ministry of Maritime Affairs and Fisheries.
[17] Mulyadi. (2012). Cost Accounting. Issue 5 Yogyakarta. YKPN STIM UPP.
[18] Ngadiyo, Sitti. A. A. T, Yusnaini. 2017. Study of Catfish Consumer Preference Study.
[19] Philip, Kotler. In Marius, P. (2002) Marketing Management. Analysis of Planning and Management, Ninth Edition. PT Prehalindo. Jakarta.
[20] Renata, R., Wardiah, D., & Kristiawan, M. (2018). The Influence of Headmaster’s Supervision and Achievement Motivation on Effective Teachers. International Journal of Scientific & Technology Research, 7(4).
[21] Sarina., Kristiawan, M., & Wardiah, D. (2019). Module Development the Utilization of Patchwork Fabric As Teaching Materials Crafts on the Subjects of Craft and Entrepreneurship For High School Students. International Journal of Scientific & Technology Research, 8(5).
[22] Sudjana, N. (2002). Statistical Method. Tarsito Bandung. [23] Suprapto J. (1998). Statistical Theory and Application.
Erlangga Publisher. Jakarta.
[24] Susanto, P. H. (2014). Health statistics. PT Raja Grafindo Persada. Jakarta
[25] Saysima (2011). Mother's Influence on the Eating Behavior of Sea Fish of Primary School Students in Jepara Regency and Grobogan Regency, Central Java. Bogor Agricultural Institute Thesis.
[26] Tobari., Kristiawan, M., & Asvio, N. (2018). The Strategy of Headmaster on Upgrading Educational Quality In Asean Economic Community (AEC) Era. International Journal of Scientific & Technology Research, 7(4). [27] Wandasari, Y., Kristiawan, M., & Arafat, Y. (2019). Policy