Substance Abuse and Rehabilitation
Addiction treatment trials: how gender,
race/ethnicity, and age relate to ongoing
participation and retention in clinical trials
Jeffrey E Korte1
Carmen L Rosa2
Paul G Wakim2
Harold I Perl2
1Division of Biostatistics and Epidemiology, Medical University of South Carolina, Charleston, SC, 2Center for the Clinical Trials Network, National Institute on Drug Abuse, Bethesda, MD, USA
Correspondence: Jeffrey E Korte Division of Biostatistics and Epidemiology, Medical University of South Carolina 135 Cannon Street, Ste 302E, Charleston, SC, 29425, USA
Tel +1 843 876 1122 Fax +1 843 876 1126 Email korte@musc.edu
Introduction: Historically, racial and ethnic minority populations have been underrepresented in clinical research, and the recruitment and retention of women and ethnic minorities in clinical trials has been a significant challenge for investigators. The National Drug Abuse Treatment Clinical Trials Network (CTN) conducts clinical trials in real-life settings and regularly moni-tors a number of variables critical to clinical trial implementation, including the retention and demographics of participants.
Purpose: The examination of gender, race/ethnicity, and age group differences with respect to retention characteristics in CTN trials.
Methods: Reports for 24 completed trials that recruited over 11,000 participants were reviewed, and associations of gender, race/ethnicity, and age group characteristics were examined along with the rate of treatment exposure, the proportion of follow-up assessments obtained, and the availability of primary outcome measure(s).
Results: Analysis of the CTN data did not indicate statistical differences in retention across gender or race/ethnicity groups; however, retention rates increased for older participants. Conclusion: These results are based on a large sample of patients with substance use disorders recruited from a treatment-seeking population. The findings demonstrate that younger partici-pants are less likely than older adults to be retained in clinical trials.
Keywords: addiction treatment, age, ethnic minorities, gender difference, substance use dis-orders, race, recruitment, retention, clinical trials
Introduction
Historically, women as well as racial and ethnic minority populations have been under-represented in clinical research, despite national recommendations1 and the National
Institutes of Health (NIH) policies.2–5 Much has been written about difficulties recruiting
women and minorities into clinical trials. However, the recruitment and retention of such participants is fundamental for the validity and potential generalizability of study results, which in turn depend upon the provision of appropriate treatment doses and the collection of required outcome measures over the course of the study.6,7 Adequate
participation of women, racial/ethnic minorities, and the full range of age groups in all aspects of clinical research is also critical for appropriate subgroup analyses. This is especially important because data suggest a greater vulnerability of women and minorities to the adverse medical and social consequences of substance use disorders, such as higher rates of human immunodeficiency virus infection associated with drug use and higher rates of involvement in the criminal justice system.4,8–11 Such
vulnerability underscores the need to successfully retain all participants in substance
Dove
press
O R I G I N A L R E S E A R C H
open access to scientific and medical research
Open Access Full Text Article
Substance Abuse and Rehabilitation downloaded from https://www.dovepress.com/ by 118.70.13.36 on 27-Aug-2020
For personal use only.
Number of times this article has been viewed
This article was published in the following Dove Press journal: Substance Abuse and Rehabilitation
use research and maintain sample sizes sufficient to draw reasonable conclusions and increase the applicability of results for real-life treatment programs.4,12
Although minority groups are generally thought to have lower retention rates in research studies in comparison with non-Hispanic white groups, results have been mixed in previous studies examining retention rates in substance use disorder research. Two recent publications addressing substance use disorder research11,13 reported lower retention
rates for African Americans compared with whites. Magruder et al13 found that younger adult African Americans had the
lowest retention rates. However, Bisaga et al14,15 did not find
demographic differences in retention in the two cocaine studies they reported. Similar observations have been made regarding differential retention rates by gender.4,5
The National Drug Abuse Treatment Clinical Trials Network (CTN) was established by the National Institute on Drug Abuse (NIDA) and recently celebrated 10 years of conducting multisite clinical trials comparing the effective-ness of interventions for substance use disorders.16,17 The
CTN has been instrumental in facilitating, developing, and implementing evidence-based treatments in community treatment programs around the USA.18,19 The CTN recruits
participants from among individuals seeking treatment for substance use disorders at community-based treatment programs. It has enrolled a diverse population of individuals that includes racial/ethnic minorities, adolescents, pregnant women, and persons with co-occurring disorders.17
A large sample (11,449 randomized participants) from 24 completed clinical trials in the CTN were examined to detect any differences in three retention indicators (avail-ability of primary outcome measure[s], treatment exposure, and attendance at follow-up visits) based on demographic characteristics (age, gender, and racial or ethnic back-ground). This paper reports overall retention rates in these studies across those demographic characteristics, and com-pares them with analogous rates in the published literature. The current paper extends the literature by looking across trials with a diverse set of data and by using three different (though related) measures that reflect retention in clinical trials, whereas prior studies have typically relied on only one study and one indicator of retention.
Methods
Data source
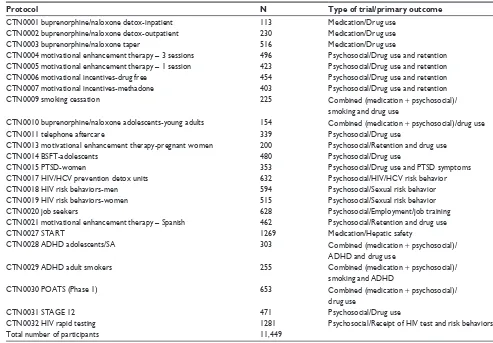
Data from the first 24 CTN completed multisite clinical trials (listed in Table 1) were analyzed. The data examined were completely de-identified to prevent linkages to individual
research participants. This included removal of all personal health information and indirect identifiers that are not listed as personal health information but could lead to “deduc-tive disclosure,” such as comment fields and site numbers. The numbering sequence is incomplete, not because some clinical trials were excluded, but because some of the studies were surveys or other types of CTN research projects. The 24 trials comprised six medication trials (with or without combined psychosocial treatment) using buprenorphine/ naloxone, two medication trials combining methylphenidate with psychosocial treatment, one medication trial combin-ing nicotine patch and psychosocial treatment, and 15 psy-chosocial trials. Results from these studies are published elsewhere.17 A total of 11,449 individuals were recruited
into the studies, across 120 Community Treatment Programs (CTPs). All studies were approved by local institutional review boards, and all participants signed written informed consent prior to participating in the research. Further details on each trial can be found at www.ctndatashare.org and www.ctndisseminationlibrary.org.
Study variables
Participants’ retention in a trial was quantified using three measures as described in Wakim et al.20
1. Availability of the primary outcome measure(s): The primary outcome measure was the dependent variable used in the initial primary analysis for each trial. It was extracted directly from a case report form used to record data or calculated from several case report form fields. In some studies, the primary outcome was a set of repeated measures, for example, drug use each week over 8 weeks. “Availability of the primary outcome measure(s)” was expressed as a percentage: the number of measures actu-ally assessed (nonmissing) divided by the number of mea-sures that were expected to be assessed, and multiplied by 100, from all participants, regardless of whether they dropped out of the treatment or were lost to follow-up. 2. Treatment exposure: This measure focused on the
treat-ment that each participant (in the control or experitreat-mental arm) actually received, compared with the treatment each participant was intended to receive. If the treatment was medication (or placebo), it reflected the actual compli-ance of taking the medicine. For psychosocial treatments, it reflected attendance at treatment sessions (either the active psychosocial therapy sessions or whatever com-parison sessions were in place for the trial). “Treatment exposure” was expressed as a percentage: the number of medication or placebo doses taken or psychosocial Dovepress
Korte et al
Substance Abuse and Rehabilitation downloaded from https://www.dovepress.com/ by 118.70.13.36 on 27-Aug-2020
therapy sessions attended, divided by the corresponding number that a participant was expected to take or attend, and multiplied by 100. For trials that combined medica-tion and psychosocial treatment, the definimedica-tion of treat-ment exposure depended on the focus of the trial. For example, in two trials, treatment exposure was based on medication compliance; in another, however, treatment exposure was based on weekly visit attendance.
3. Attendance at follow-up visit(s): Each trial entailed one or more follow-up visits. “Attendance at follow-up visit(s)” was expressed as a percentage: the number of follow-up visits actually attended, divided by the number of follow-up visits that a participant was expected to attend, and multiplied by 100.
These retention measures were analyzed with respect to three demographic groups: gender (female, male, missing), race/ethnicity (Hispanic, non-Hispanic White, non-Hispanic African American, non-Hispanic American Indian/Alaska native, non-Hispanic Asian, non-Hispanic Pacific Islander,
non-Hispanic other, multirace, missing/choose not to answer), and age group (,18 years, 18 to ,25, 25 to ,35, 35 to ,45, 45 to ,55, 55 to ,65, 65 to ,75, 75+, missing). Demographic categories with very low representation were excluded.
Data analysis
For each trial, a statistical model at the participant level was fit for each of the three participation measures as the dependent variable. Generalized estimating equation models were used, which are recommended for the analysis of data comprising repeated discrete observations of an outcome and a set of covariates.21 The authors started by including the three
main factors (gender, race/ethnicity, and age group), all two-way interactions, and their three-two-way interaction. In cases where the dependent variable at the participant level was 0 or 1 (ie, session attended or not, pill taken or not), logistic regression models were fitted. In cases where the dependent variable at the participant level was a count (eg, number of
Table 1 CTN studiesa
Protocol N Type of trial/primary outcome
CTN0001 buprenorphine/naloxone detox-inpatient 113 Medication/Drug use CTN0002 buprenorphine/naloxone detox-outpatient 230 Medication/Drug use
CTN0003 buprenorphine/naloxone taper 516 Medication/Drug use
CTN0004 motivational enhancement therapy – 3 sessions 496 Psychosocial/Drug use and retention CTN0005 motivational enhancement therapy – 1 session 423 Psychosocial/Drug use and retention CTN0006 motivational incentives-drug free 454 Psychosocial/Drug use and retention CTN0007 motivational incentives-methadone 403 Psychosocial/Drug use and retention
CTN0009 smoking cessation 225 Combined (medication + psychosocial)/
smoking and drug use
CTN0010 buprenorphine/naloxone adolescents-young adults 154 Combined (medication + psychosocial)/drug use
CTN0011 telephone aftercare 339 Psychosocial/Drug use
CTN0013 motivational enhancement therapy-pregnant women 200 Psychosocial/Retention and drug use
CTN0014 BSFT-adolescents 480 Psychosocial/Drug use
CTN0015 PTSD-women 353 Psychosocial/Drug use and PTSD symptoms
CTN0017 HIV/HCV prevention detox units 632 Psychosocial/HIV/HCV risk behavior
CTN0018 HIV risk behaviors-men 594 Psychosocial/Sexual risk behavior
CTN0019 HIV risk behaviors-women 515 Psychosocial/Sexual risk behavior
CTN0020 job seekers 628 Psychosocial/Employment/job training
CTN0021 motivational enhancement therapy – Spanish 462 Psychosocial/Retention and drug use
CTN0027 START 1269 Medication/Hepatic safety
CTN0028 ADHD adolescents/SA 303 Combined (medication + psychosocial)/
ADHD and drug use
CTN0029 ADHD adult smokers 255 Combined (medication + psychosocial)/
smoking and ADHD
CTN0030 POATS (Phase 1) 653 Combined (medication + psychosocial)/
drug use
CTN0031 STAGE 12 471 Psychosocial/Drug use
CTN0032 HIV rapid testing 1281 Psychosocial/Receipt of HIV test and risk behaviors
Total number of participants 11,449
Note: aClinical trials completed from January 2000 to January 2011.
Abbreviations: CTN, National Drug Abuse Treatment, Clinical Trials Network; PTSD, post-traumatic stress disorder; HIV, human immunodeficiency virus; BSFT, brief strategic family therapy; START, Starting Treatment with Agonist Replacement Therapy Study; ADHD, attention deficit hyperactive disorder; SA, substance abuse; POATS, Prescription Opioid Addiction Treatment Study; STAGE 12, Stimulant Abuser Groups to Engage in 12 Step.
Dovepress Participation in clinical trials
Substance Abuse and Rehabilitation downloaded from https://www.dovepress.com/ by 118.70.13.36 on 27-Aug-2020
pills taken), Poisson regression models were fitted. In most trials, there were repeated measures within participant. In such cases, repeated measures models were fitted, assuming an autoregressive correlation structure.
If the three-way interaction was not statistically sig-nificant at the 0.01 level, it was dropped from the model, which was fitted again with the main effects and all two-way interactions. Any two-two-way interaction that was not statistically significant at the 0.01 level was subsequently dropped from the model, which was fitted again. The final model included the three main effects, whether statistically significant or not, and the two-way and three-way interactions that were statistically significant.
When only one demographic subgroup was represented in a trial, the whole demographic grouping was excluded from the model for that trial. For example, in one trial (CTN0010-BUP Adolescents), the age group factor was excluded from the three statistical models because all partici-pants were less than 25 years old. Similarly, race/ ethnicity was excluded from the statistical models for another trial (CTN0021-Spanish MET) because all participants were Hispanic, and gender was excluded from the models in some gender trials, for example, CTN0013-MET for pregnant women.
Each generalized estimating equation model produced least-squares means for each level of gender, race/ethnicity, and age group. For each of the three participation mea-sures, the least-squares means were then combined across trials, after controlling for a trial effect (each trial with a 0–1 code), to produce the final estimates of participation for each of the gender, race/ethnicity, and age group.
Instead of calculating simple averages for each demo-graphic group directly from the raw data, this modeling approach was used to account for any imbalances in repre-sentation. For example, the proportion of young participants among women may have been considerably higher by chance than that among men. If so, simple averages for each gender group may confound the gender and age group effects. So to separate the two effects, one needs to model participation with both factors in the model. The fact that many trials incorporated repeated measures also required some special modeling.
Results
Selected characteristics of clinical trials
Table 1 summarizes the clinical trials analyzed and shows that the sample sizes in the 24 trials ranged from 113 to 1281. The participant demographic characteristics are shown
in Table 2. Demographics show that 41% of individuals were female. Eight participants with missing gender information were excluded from this analysis.
As shown in Table 2, 53% of participants were non-Hispanic white, 21% were non-non-Hispanic African American, and 17% were Hispanic. The exhaustive, mutually exclusive categorization was based on participants’ answers to one question on race and one on ethnicity. Because the number of participants was low for the categories “Non-Hispanic American Indian/Alaska native,” “Non-Hispanic Asian,” “Non-Hispanic Pacific Islander,” “Non-Hispanic other,” and “Missing/Choose not to answer,” these were excluded from the analysis.
In terms of age group composition, the majority of indi-viduals were between 25 and 54 years old (75%), with an average age of 36 years. Categories “65 to ,75,” “75+” and “Missing” were excluded from the analysis because of their low count. Also excluded was the category “,18” because 98% of participants (n = 711) from this age group came from only two studies (CTN0014-BSFT and CTN0028-ADHD Adolescents) that focused on adolescents. Including this category would have confounded the effects of the age group with those two studies. For example, if the group of participants ,18 years old reflected low retention rates, it
Table 2 Demographic characteristics
N Percent
Male 6795 59.4
Female 4646 40.6
Gender missing 8 ,0.1
Non-Hispanic white 6099 53.3
Non-Hispanic African American 2428 21.2
Hispanic 1966 17.2
Multirace 689 6.0
Non-Hispanic American Indian/ Alaska native
124 1.1
Non-Hispanic other 71 0.6
Non-Hispanic Asian 43 0.4
Missing/Choose not to answer 19 0.2
Non-Hispanic Pacific Islander 10 ,0.1
Age groups (years)
,18 729 6.4
18 to ,25 1623 14.2
25 to ,35 2990 26.1
35 to ,45 3200 28.0
45 to ,55 2415 21.1
55 to ,65 447 3.9
65 to ,75 31 0.3
75+ 4 ,0.1
Missing 10 ,0.1
Total 11,449 100
Dovepress
Korte et al
Substance Abuse and Rehabilitation downloaded from https://www.dovepress.com/ by 118.70.13.36 on 27-Aug-2020
could not be known whether this was the effect of the age category or perhaps the high participant burden in those two studies.
Results of retention-related measures
As a result of excluding the above demographic categories, 11,122 of the 11,449 participants were included in the final analyses.
None of the individual trial statistical models comprised two-way or three-way interactions that were statistically significant at the 0.01 level and, therefore, all final models included only the three main effects, with a few excep-tions for trials where one of the main effects (demographic group) was also excluded for reasons previously stated. Three tables (one for each retention measure) showing the results of the individual trial analyses, are provided as Appendices 1, 2, and 3.
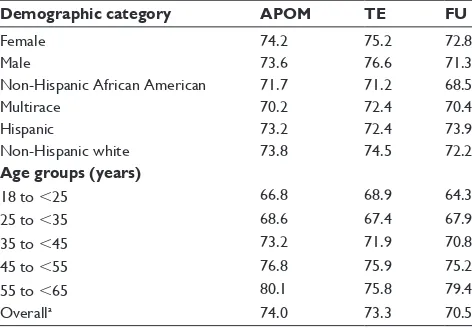
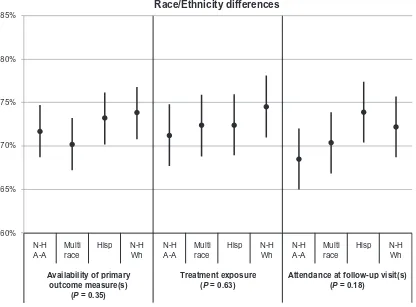
Differences in participation between gender, race/ ethnicity, and age groups after combining results across trials are shown in Table 3 and Figures 1–3, respectively. Table 3 provides the values of the point estimates plotted in the three figures, as well as the values of the three measures for all demographic groups and all trials combined (bottom row). Figures 1–3 also show 95% confidence intervals around the point estimates.
P-values resulting from the comparison between the demographic groups are also provided. Figure 1 shows that gender differences were not statistically significant on any of the three participation measures (P values $0.25). The point
estimates ranged between 71% and 77%. Figure 2 shows that race/ethnicity differences were also not statistically significant on any of the three participation measures (P values $0.18). The point estimates ranged between 69% and 75%. In contrast, Figure 3 shows that age group differ-ences were statistically significant (P values #0.003); in fact, it shows that participation increases with age. Point estimates were around 67% for the youngest participants and around 78% for the oldest participants.
The three participation measures are correlated. For example, participants who attended the follow-up visits are more likely to have come for their psychosocial therapy and to have completed the primary outcome assessments.
Discussion
This paper discusses the relationships between demographic characteristics and ongoing research participation rates of treatment seeking individuals in 24 clinical trials completed in the CTN. Three separate measures of ongoing study participation and retention (availability of primary outcome, treatment exposure, and attendance to follow-up visits) were examined. For each trial, results pertaining to these three retention measures were presented in Wakim et al.20
In the overall sample, fairly high participation rates were found, with participation ranging from approximately 70% to 80%. Statistically significant differences were not found among gender or racial/ethnic groups, but differences were found among age groups. These findings have important and broad implications for research design and planning because three separate indicators of study participation and retention were examined, across a large sample in 24 multisite clini-cal trials, rather than only a single indicator in one or two small trials.
Since its inception, the CTN has implemented several strategies to enhance participant recruitment and retention. These include:
• Site selection: Study teams examine the demographic characteristics of the population served by the CTPs to ensure that women and racial/ethnic minorities are represented adequately.
• Training: Staff are trained at the beginning of each study and participate in weekly conference calls to discuss progress and identify areas for improvement. In addition, NIDA sponsors national trainings and regular web-based training on recruitment and retention issues to improve skills that promote specific successful strategies. These training sessions also provide a forum to exchange lessons learned.
Table 3 Measures of participation based on 24 clinical trials (in %)
Demographic category APOM TE FU
Female 74.2 75.2 72.8
Male 73.6 76.6 71.3
Non-Hispanic African American 71.7 71.2 68.5
Multirace 70.2 72.4 70.4
Hispanic 73.2 72.4 73.9
Non-Hispanic white 73.8 74.5 72.2
Age groups (years)
18 to ,25 66.8 68.9 64.3
25 to ,35 68.6 67.4 67.9
35 to ,45 73.2 71.9 70.8
45 to ,55 76.8 75.9 75.2
55 to ,65 80.1 75.8 79.4
Overalla 74.0 73.3 70.5
Notes: a“Overall” is calculated directly from the raw data (no statistical modeling).
It includes all demographic categories, not just the ones listed above, and all 24 trials, not just the ones that were included in the demographic-specific calculations. For example, as noted in the paper, CTN0013 did not contribute to the gender-specific analysis because all participants were female. But “Overall” does include CTN0013.
Abbreviations: APOM, availability of primary outcome measure; TE, treatment exposure; FU, follow-up visits.
Dovepress Participation in clinical trials
Substance Abuse and Rehabilitation downloaded from https://www.dovepress.com/ by 118.70.13.36 on 27-Aug-2020
60%
Female Male
Availability of primary outcome measure(s)
(P = 0.49)
Female Male
Treatment exposure (P = 0.26) Gender differences
Female Male
Attendance at follow-up visit(s) (P = 0.25)
65% 70% 75% 80% 85%
Figure 1 Associations of gender with the availability of primary outcome measure(s), treatment exposure, and attendance at follow-up visits.a
Notes: aLeast-squaresmeans and corresponding 95% confidence intervals by gender, for each of the three participation measures. The indicated P-values reflect the
comparison between genders.
60% N-H A-A
N-H Wh Multi
race
Hisp N-H
A-A
N-H Wh Multi
race
Hisp N-H
A-A
N-H Wh Multi
race Hisp
Availability of primary outcome measure(s)
(P = 0.35)
Treatment exposure (P = 0.63)
Race/Ethnicity differences
Attendance at follow-up visit(s) (P = 0.18)
65% 70% 75% 80% 85%
Figure 2 Associations of race/ethnicity with the availability of primary outcome measure(s), treatment exposure, and attendance at follow-up visits.a
Notes: aLeast-squaresmeans and corresponding 95% confidence intervals by race/ethnicity, for each of the three participation measures. The indicated P-values reflect the
comparison between race/ethnicity.
Abbreviations: N-HA-A, non-Hispanic African American; Hisp, Hispanic; N-H Wh, non-Hispanic white.
Dovepress
Korte et al
Substance Abuse and Rehabilitation downloaded from https://www.dovepress.com/ by 118.70.13.36 on 27-Aug-2020
• Monitoring: Study leaders have access to these data on a daily basis. They closely monitor recruitment and reten-tion rates as the trial is implemented as well as conduct weekly calls with staff at each participating site to discuss problems and recommend solutions. These strategies seem to be working well, since the CTN clinical trials examined here have been able to recruit and retain a diverse group of individuals.
Recruitment
The recruitment of women, adolescents, and racial/ethnic minorities depends largely on the particular population that attends the clinic as well as the clinic’s specialty (eg, programs targeted to women or adolescents). The CTN recruitment rates (41% female, 53% non-Hispanic white, 21% non-Hispanic African American, and 17% Hispanic) mirror national figures on substance use disorder treatment reported by the Substance Abuse and Mental Health Services Administration,22,23 suggesting that, at least for these
demo-graphic groups, the CTN trials have recruited a sample that is representative of the treatment-seeking US population and that CTN findings could be generalizable.
However, the CTN appears to be less successful in recruit-ing a representative number of American Indian/Alaska Natives (1.1%) or Asian Americans (0.4%) into the trials, with
numbers that are lower than the Substance Abuse and Mental Health Services Administration’s estimate.22,23 Of those
persons admitted into treatment, 2.3% are American Indian/ Alaska Natives and 1% are Asian Americans. Research is needed to uncover the reasons for these low enrollment rates in the CTN; however, the authors speculate that one reason could be that few CTPs in the CTN actually serve these groups, due to demographic, geographic, or other factors. The CTN is exploring the possibility of including additional specific treatment programs that serve these populations.
Retention-related measures
As described by Wakim et al,20 the retention measures in
CTN trials ranged from 45% to 100%, with an average of 73% across all studies (Table 3). This range of participa-tion could reflect a combinaparticipa-tion of variables, such as type of treatment, protocol characteristics or design, treatment program characteristics, and participant characteristics. This range also reflects those reported previously for substance use disorders research (38% reported by Heinzerling et al24
to 92% reported by Fals-Stewart and Lam25).
Gender
Analysis of the overall CTN data did not indicate significant differences in trial retention across gender, confirming the
60% 18 to
<25 25 to
<35 35 to
<45 45 to
<55 55 to
<65 18 to
<25 25 to
<35 35 to
<45 45 to
<55 55 to
<65 18 to
<25 25 to
<35 35 to
<45 45 to
<55 55 to
<65
Availability of primary outcome measure(s)
(P < 0.001)
Treatment exposure (P = 0.003) Age group differences
Attendance at follow-up visit(s) (P < 0.001)
65% 70% 75% 80% 85%
Figure 3 Associations of age group with the availability of primary outcome measures, treatment exposure, and attendance at follow-up visits.a
Notes: aLeast-squaresmeans and corresponding 95% confidence intervals by age group, for each of the three participation measures. The indicated P-values reflect the
comparison between age groups.
Dovepress Participation in clinical trials
Substance Abuse and Rehabilitation downloaded from https://www.dovepress.com/ by 118.70.13.36 on 27-Aug-2020
observation of Greenfield et al,4 who conducted a review of
the literature and concluded that gender is not a significant factor in treatment retention.
Race/Ethnicity
A statistically significant difference was observed for some of the retention indicators in some of the trials, showing that non-Hispanic whites and Hispanics remain in certain studies longer than non-Hispanic African Americans (see Appendices 1–3). This finding is congruent with the published literature. However, when all 24 trials were combined, signifi-cant differences were not found among racial/ethnic groups, suggesting that the directionality of the differences was not consistent enough to yield statistically significant findings overall. Potential reasons for this observation include: (1) the analysis encompassed a wide range of intervention types (psychosocial, medication, combined treatment) and target drugs used (opiates, stimulants, poly-drug use disorders); and (2) the analysis reflected studies conducted across a broad range of programs and treatment settings with highly variable characteristics (eg, treatment modality philosophy, size and staff characteristics, client case mix, geographic area).
Age groups
The ages of the participants enrolled were also examined; statistically significant differences between older and younger populations across the overall sample were found, showing that retention was higher for older participants. These dif-ferences were not observed in every trial, however. This is consistent with reports by Magruder et al,13 who analyzed
a subset of these trials and found that younger participants were least likely to be retained. This is also consistent with Warden et al,26 who analyzed data from a large depression
study and found that, regardless of income, younger enrollees had a greater likelihood of attrition. Warden et al speculate that there could be a relationship between older age and a perceived need for treatment, better judgments in life, or a more prolonged history of illness.
The wide range of factors in these analyses, including study characteristics (eg, type and length of study), treatment program characteristics (eg, methadone programs, women only), and primary drug of abuse (eg, opiates, stimulants, alcohol), makes it difficult to speculate as to why older participants have a higher retention rate. Nevertheless, older participants may have stronger motivations to enter and complete treatment, since they may have moved through the stages of change and have experienced too many negative consequences related to their addiction, consistent with
Fiorentine and Hillhouse’s27 model of recovery. Additionally,
some longitudinal studies in alcohol have shown a decline in consumption over time.28 In clinical settings, providers
may associate older age with better treatment outcomes. One study physician noted that this might be because it becomes harder to live the life of an addict as one gets older.29 Also,
older addicts do not seem to experience the same pleasurable effects of the drugs as they did at a younger age, perhaps due to drug tolerance or other physiological factors. Furthermore, the devastating effects of drug use and abuse on people’s lives accumulate over time.
Limitations
This is an observational analysis. Other factors not considered may affect clinical trial participation or may be confounded with demographics. For example, different racial/ethnic groups may have different preferences for a primary drug of abuse or different patterns of drug use. By controlling for a trial effect in the model used here, to some extent the primary drug of abuse was controlled for, but only for trials focused on one specific drug of abuse. However, if a trial includes participants reporting a wide range of primary drugs of abuse, and if certain age or racial/ethnic groups tend to use certain drugs, then the effects of age or race/ethnicity and primary drug of abuse are confounded.
Variations across trials in the specific definition of the retention indicators utilized in this paper (ie, availability of primary outcome measure[s], treatment exposure, and atten-dance at follow-up visit[s]) may also contribute to potential confounding. In addition, unmeasured factors such as the quality of treatment in each trial may have affected retention. However, trial differences were captured and controlled for, to some extent, in the statistical model that combined the least-squares means.
Conclusion
The significant attention that CTN investigators have focused on recruitment and retention efforts appears to have paid off in better demographic representativeness of study samples of whites, African Americans, and Hispanics. However, the authors’ analyses strongly suggest that future investigators in addiction treatment clinical trials increase their efforts to recruit and retain certain specific populations: (1) American Indian/Alaska Natives and Asian American populations, since they seem to underparticipate in clinical trial research; (2) younger individuals, since they are the population with the lowest retention rates; and (3) non-Hispanic African Americans, since their retention rates may be lower than other Dovepress
Korte et al
Substance Abuse and Rehabilitation downloaded from https://www.dovepress.com/ by 118.70.13.36 on 27-Aug-2020
racial/ethnic groups. Strategies for increased recruitment and retention may include greater care to address sociocultural differences relating to both drug use and medical research, as well as multipronged strategies to track and retain par-ticipants. Another strategy to strengthen participation of minority subgroups in addiction (and other biomedical) research may be to increase the representation of minority investigators in the biomedical research workforce. Recent studies have highlighted such underrepresentation.30,31
To summarize, the participation and ongoing retention rates of 70%–80% did not differ by race/ethnicity or gender. However, participation and retention rates increased signifi-cantly with age. These results highlight the need to investigate the reason(s) why younger adult rates of participation are lower. Lastly, the results of any study should be interpreted with caution when the recruitment and retention rates of eligible participants are low.
Acknowledgments
The authors thank the data management and statisticians at the Duke Clinical Research Institute for their contribu-tions to the NIDA Clinical Trials Network.
Disclosure
CL Rosa, PG Wakim, and HI Perl are employees of the Center for the Clinical Trials Network of the National Institute on Drug Abuse, NIH, the funding agency for the National Drug Abuse Treatment Clinical Trials Network. The opinions in this article are those of the authors and do not represent the official position of the NIH or the US government. The authors declare no further conflicts of interest in relation to this paper.
References
1. Koh HK, Oppenheimer SC, Massin-Short SB, Emmons KM, Geller AC, Viswanath K. Translating research evidence into practice to reduce health disparities: a social determinants approach. Am J Public Health. 2010;100 Suppl 1:S72–S80.
2. National Institutes of Health (NIH). Amendment: NIH Policy and Guidelines on the Inclusion of Women and Minorities as Subjects in Clinical Research – October, 2001. Bethseda, MD: NIH; October 9, 2001. Available from: http://grants.nih.gov/grants/guide/notice-files/ NOT-OD-02-001.html. Accessed August 4, 2010.
3. Durant RW, Davis RB, St George DM, Williams IC, Blumenthal C, Corbie-Smith GM. Participation in research studies: factors associated with failing to meet minority recruitment goals. Ann Epidemiol. 2007; 17(8):634–642.
4. Greenfield SF, Brooks AJ, Gordon SM, et al. Substance abuse treatment entry, retention and outcome in women: A review of the literature. Drug Alcohol Depend. 2007;86(1):1–21.
5. Sullivan PS, McNaghten D, Begley E, Hutchinson A, Cargill VA. Enrollment of racial/ethnic minorities and women with HIV in clinical research studies of HIV medicines. J Natl Med Assoc. 2007;99(3):242–250.
6. Robinson KA, Dennison CR, Wayman DM, Pronovost PJ, Needham DM. Systematic review identifies number of strategies important for retaining study participants. J Clin Epidemiol. 2007;60:757–764.
7. Fabricatore AN, Wadden TA, Moore RH, et al. Attrition from ran-domized controlled trials of pharmacological weight loss agents: a systematic review and analysis. Obes Rev. 2009;10(3):333–341. 8. Burlew AK, Feaster D, Brecht M, Hubbard R. Measurement and data
analysis in research addressing health disparities in substance abuse. J Subst Abuse Treat. 2009;36(1):25–43.
9. Alvarez RA, Vasquez E, Mayorga CC, Feaster DJ, Mitrani VB. Increasing minority research participation through community orga-nization outreach. West J Nurs Res. 2006;28(5):541–560.
10. Carroll KM, Martino S, Ball SA, et al. A multisite randomized effective-ness trial of motivational enhancement therapy for Spanish-speaking substance users. J Consult Clin Psychol. 2009;77(5):993–999. 11. Milligan CO, Nich C, Carroll KM. Ethnic differences in substance
abuse treatment retention, compliance and outcome from two clinical trials. Psychiatr Serv. 2004;55(2):167–173.
12. Yancey AK, Ortega AN, Kumanyika SK. Effective recruitment and retention of minority research participants. Annu Rev Public Health. 2006;27:1–28.
13. Magruder KM, Ouyang B, Miller S, Tilley B. Retention of under-represented minorities in drug abuse treatment studies. Clin Trials. 2009;6(3):252–260.
14. Bisaga A, Aharonoivh E, Garawi F, et al. A randomized placebo-controlled trial of gabapentin for cocaine dependence. Drug Alcohol Depend. 2006;81(3):267–274.
15. Bisaga A, Aharonoivh E, Cheng WY, et al. A placebo-controlled trial of memantine for cocaine dependence with high-value voucher incen-tives during a pre-randomization lead-in period. Drug Alcohol Depend. 2010;111:97–104.
16. Tai B, Straus MM, Liu D, Sparenborg S, Jackson R, McCarty D. The first decade of the National Drug Abuse Treatment Clinical Trials Network: Bridging the gap between research and practice to improve drug abuse treatment. J Subst Abuse Treat. 2010;38:S4–S13. 17. Wells EA, Saxon AJ, Calsyn DA, Jackson TR, Donovan D. Study results
from the Clinical Trials Network’s first 10 years: Where do they lead? J Subst Abuse Treat. 2010;38(1):S14–S30.
18. Martino S, Brigham GS, Higgins C, et al. Partnerships and pathways of dissemination: The National Institute on Drug Abuse – Substance Abuse and Mental Health Services Administration Blending Initiative in the Clinical Trials Network. J Subst Abuse Treat. 2010;38(1):S31–S43. 19. Roman PM, Abraham AJ, Rothrauff TC, Knudsen HK. A longitudinal
study of organizational formation, innovation of adoption, and dissemi-nation activities within the National Drug Abuse Treatment Clinical Trials Network. J Subst Abuse Treat. 2010;38(1):S44–S52.
20. Wakim P, Rosa C, Kothari P, Michel ME. Relation of study design to recruitment and retention in CTN trials. Am J Drug Alcohol Abuse. 2011;37(5):426–433.
21. Zeger SL, Liang KY. Longitudinal data analysis for discrete and con-tinuous outcomes. Biometrics. 1986;42:121–130.
22. Substance Abuse and Mental Health Services Administration (SAMHSA). Highlights for 2007 treatment episode data set (TEDS). Rockville, MD: SAMHSA; 2009 [last updated February 17, 2009]. Available from: http://oas.samhsa.gov/TEDS2k7highlights/ TEDSHighl2k7Tbl2a.htm. Accessed July 6, 2010.
23. Division of Population Surveys, Office of Applied Studies, SAMHSA, RTI International. Results from the 2007 National Survey on Drug Use and Health: national findings. Rockville, MD: SAMHSA; 2008 [last updated September 4, 2008]. Available from: http://www.oas.samhsa. gov/NSDUH/2k7NSDUH/2k7results.cfm#7.3. Accessed July 6, 2010. 24. Heinzerling KG, Swanson A, Kim S, et al. Randomized, double-blind,
placebo-controlled trial of modafinil for the treatment of methamphet-amine dependence. Drug Alcohol Depend. 2010;109:20–29. 25. Fals-Stewart W, Lam WKK. Computer-assisted cognitive rehabilitation
for the treatment of patients with substance use disorders: a randomized clinical trial. Exp Clin Psychopharmacol. 2010;18(1):87–98.
Dovepress Participation in clinical trials
Substance Abuse and Rehabilitation downloaded from https://www.dovepress.com/ by 118.70.13.36 on 27-Aug-2020
26. Warden D, Rush AJ, Wisniewski SR, et al. Income and attrition in the treatment of depression: a STAR*D report. Depress Anxiety. 2009; 26(7):622–633.
27. Fiorentine R, Hillhouse MP. Replicating the Addicted-Self Model of recovery. Addict Behav. 2003;28(6):1063–1080.
28. Moos RH, Schutte K, Brennan P, Moos BS. Ten-year patterns of alcohol consumption and drinking problems among older women and men. Addiction. 2004;99(7):829–838.
29. Pers comm; Jack Blaine, September 14, 2010.
30. Ginther DK, Schaffer WT, Schnell J, et al. Race, ethnicity, and NIH research awards. Science. 2011;333(6045):1015–1019.
31. Tabak LA, Collins FS. Weaving a richer tapestry in biomedical science. Science. August 19, 2011;333(6045):940–941.
Dovepress
Korte et al
Substance Abuse and Rehabilitation downloaded from https://www.dovepress.com/ by 118.70.13.36 on 27-Aug-2020
Appendix I
Statistical significance (
P
-values) of parameters in models for availability of primary outcome measure
Trial Main effects* Two-way interactions** Three-way interaction** Comment*** Treatment group Gender Race/Ethnicity Age G 3 RE G 3 Age RE 3 Age G 3 RE 3 Age CTN0001 0.932 0.617 0.941 0.128 – – – – CTN0002 0.055 0.668 0.063 0.009 – – – – 35–44 . 25–34 . 45–54 . 18–24 . 55–64 CTN0003 0.001 0.072 0.320 0.690 – – – – CTN0004 0.937 0.996 0.142 0.307 – – – – CTN0005 0.506 0.898 0.761 0.421 – – – – CTN0006 0.002 0.787 0.753 0.250 – – – – CTN0007 0.791 0.171 0.320 0.022 – – – – CTN0009 0.023 0.352 0.710 0.203 – – – – CTN0010 0.032 0.376 0.299 0.857 – – – – CTN0011 0.476 0.646 0.909 0.009 – – – – 45–54 . 35–44 . 18–24 . 25–34 CTN0013 – na – – na na – na CTN0014 0.237 0.780 0.076 0.312 – – – – CTN0015 0.979 na 0.120 0.143 na na – na CTN0017 0.612 0.154 0.440 0.002 – – – – 55–64 . 45–54 . 18–24 . 25–34 . 35–44 CTN0018 0.480 na , 0.001 , 0.001 na na – na MR . H . W . AA, 55–64 . 45–54 . 35–44 . 25–34 . 18–24 CTN0019 0.043 na 0.181 0.061 na na – na CTN0020 0.356 0.002 0.037 0.010 – – – – F . M, 55–64 . 45–54 . 35–44 . 25–34 . 18–24 CTN0021 0.191 0.465 na 0.013 na – na na CTN0027 , 0.001 0.392 0.360 , 0.001 – – – – 55–64 . 45–54 . 35–44 . 25–34 . 18–24 CTN0028 not av 0.090 0.033 0.130 – – – – CTN0029 not av 0.768 – 0.038 – – – – CTN0030 0.701 0.555 0.475 0.217 – – – – CTN0031 0.066 0.107 0.429 0.123 – – – – CTN0032 0.696 , 0.001 0.499 0.015 – – – – F . M Abbreviations:
G, gender; RE, race/ethnicity; M, male; F, female; H, Hispanic; W, white; AA, non-Hispanic African American; MR, multirace; na, not applicable; not av, not available.
Notes: *A dash (–) indicates that the main effect could not be estimated because there was only one group left after cells with small sample size were excluded. **A dash (–) indicates that the interaction term was not statistically significant ( P -value . 0.010) or could not be estimated, and was subsequently dropped from the statistical model. ***For statistically significant differences in retention for specific main effects ( P # 0.01), the ordering of main effect categories are
presented in the likelihood of retention to the study visit corresponding to the primary outcome assessment, from highest retention to lowest retention.
Appendices
Dovepress Participation in clinical trials
Substance Abuse and Rehabilitation downloaded from https://www.dovepress.com/ by 118.70.13.36 on 27-Aug-2020
Appendix 2
Statistical significance (
P
-values) of parameters in models for treatment exposure
Trial Main effects* Two-way interactions** Three-way interaction** Comment*** Treatment group Gender Race/Ethnicity Age G 3 RE G 3 Age RE 3 Age G 3 RE 3 Age CTN0001 0.001 0.927 0.597 0.181 – – – – CTN0002 , 0.001 0.752 0.465 0.597 – – – – CTN0003 0.016 0.130 0.555 0.741 – – – – CTN0004 0.631 0.979 0.197 0.962 – – – – CTN0005 0.760 0.915 – 0.066 – – – – CTN0006 0.020 0.227 0.001 0.681 – – – – H . W . AA CTN0007 0.262 0.270 0.755 0.491 – – – – CTN0009 0.025 0.172 0.086 0.187 – – – – CTN0010 0.041 0.597 0.001 0.487 – – – – MR . W . H . AA CTN0011 – 0.345 0.701 , 0.001 – – – – 55–64 . 45–54 . 35–44 . 25–34 . 18–24 CTN0013 0.516 na , 0.001 0.678 na na – na W . AA . H CTN0014 – 0.662 0.224 – – – – – CTN0015 0.967 na 0.314 0.529 na na – na CTN0017 – – – – – – – – CTN0018 0.094 na 0.215 , 0.001 na na – na 55–64 . 45–54 . 35–44 . 25–34 . 18–24 CTN0019 , 0.001 na 0.700 0.002 na na – na 55–64 . 45–54 . 18–24 . 35–44 . 25–34 CTN0020 – 0.005 , 0.001 0.775 – – – – M . F, H . W . AA . MR CTN0021 0.797 0.227 na 0.113 na – na na CTN0027 , 0.001 0.550 0.489 , 0.001 – – – – 55–64 . 45–54 . 35–44 . 25–34 . 18–24 CTN0028 not av 0.701 0.366 0.817 – – – – CTN0029 not av 0.634 0.328 0.637 – – – – CTN0030 , 0.001 0.318 0.340 0.894 – – – – CTN0031 – 0.456 0.491 0.163 – – – – CTN0032 – – – – – – – – Abbreviations: G, gender; RE, race/ethnicity; M, male; F, female; H, Hispanic; W, white; AA, non-Hispanic African American; MR, multirace; AI, Non-Hispanic American Indian/Alaska Native; na, not applicable; not av, not available. Notes : *A dash (–) indicates that the main effect could not be estimated because there was only one group left after cells with small sample size were excluded. **A dash (–) indicates that the interaction term was not statistically significant ( P -value . 0.010) or could not be estimated, and was subsequently dropped from the statistical model. ***For statistically significant differences in retention for specific main effects ( P # 0.01), the ordering of main effect categories are
presented in the likelihood of retention to the study visit corresponding to the primary outcome assessment, from highest retention to lowest retention.
Dovepress
Korte et al
Substance Abuse and Rehabilitation downloaded from https://www.dovepress.com/ by 118.70.13.36 on 27-Aug-2020
Appendix 3
Statistical significance (
P
-values) of parameters in models for attendance at follow-up visits
Trial Main effects* Two-way interactions** Three-way interaction** Comment*** Treatment group Gender Race/Ethnicity Age G 3 RE G 3 Age RE 3 Age G 3 RE 3 Age CTN0001 0.693 0.504 0.012 0.834 – – – – CTN0002 0.002 0.660 0.007 0.025 – – – – AA . W . H CTN0003 0.044 0.044 0.055 0.221 – – – – CTN0004 0.415 0.925 0.086 0.994 – – – – CTN0005 0.608 0.423 0.848 0.360 – – – – CTN0006 0.193 0.046 0.142 0.449 – – – – CTN0007 0.729 0.032 0.047 0.035 – – – – CTN0009 0.136 0.309 0.111 0.053 – – – – CTN0010 0.217 0.520 0.513 0.436 – – – – CTN0011 0.762 0.797 0.328 0.011 – – – – CTN0013 0.880 na 0.602 0.191 na na – na CTN0014 0.674 0.475 0.001 – – – – – H . W . MR . AA CTN0015 0.965 na 0.117 0.148 na na – na CTN0017 0.946 0.080 0.406 0.007 – – – – 55–64 . 45–54 . 25–34 . 18–24 . 35–44 CTN0018 0.589 na , 0.001 , 0.001 na na – na MR . H . W . AA, 55–64 . 45–54 . 25–34 . 35–44 . 18–24 CTN0019 0.025 na 0.391 0.060 na na – na CTN0020 0.574 0.011 0.138 0.033 – – – – CTN0021 0.098 0.480 na 0.020 na – na na CTN0027 , 0.001 0.881 0.532 , 0.001 – – – – 55–64 . 45–54 . 35–44 . 18–24 . 25–34 CTN0028 not av 0.083 0.072 0.751 – – – – CTN0029 not av 0.705 – 0.028 – – – – CTN0030 na na na na na na na na CTN0031 0.049 0.255 0.510 0.656 – – – – CTN0032 0.459 , 0.001 0.832 0.651 – – – – F . M Abbreviations: G, gender; RE, race-ethnicity; M, Male; F, Female; H, Hispanic; W, White; AA, Non-Hispanic African American; MR, Multi-Race; AI, Non-Hispanic American Indian/ Alaska Native; na, not applicable; not av, not available. Notes : *A dash (–) indicates that the main effect could not be estimated because there was only one group left after cells with small sample size were excluded. **A dash (–) indicates that the interaction term was not statistically significant ( P -value . 0.010) or could not be estimated, and was subsequently dropped from the statistical model. ***For statistically significant differences in retention for specific main effects ( P # 0.01), the ordering of main effect categories are
presented in the likelihood of retention to the study visit corresponding to the primary outcome assessment, from highest retention to lowest retention.
Dovepress Participation in clinical trials
Substance Abuse and Rehabilitation downloaded from https://www.dovepress.com/ by 118.70.13.36 on 27-Aug-2020
Substance Abuse and Rehabilitation
Publish your work in this journal
Submit your manuscript here: http://www.dovepress.com/substance abuse-and-rehabilitation-journal
Substance Abuse and Rehabilitation is an international, peer-reviewed, open access journal publishing original research, case reports, editorials, reviews and commentaries on all areas of addiction and substance abuse and options for treatment and rehabilitation. The manuscript manage-ment system is completely online and includes a very quick and fair
peer-review system. Visit http://www.dovepress.com/testimonials.php to read real quotes from published authors.
Dovepress
Dove
press
Korte et al
Substance Abuse and Rehabilitation downloaded from https://www.dovepress.com/ by 118.70.13.36 on 27-Aug-2020