Asset Attribution Stability And Portfolio
Construction: An Educational Example
James T. Chong, California State University-Northridge, USA William P. Jennings, California State University-Northridge, USA
G. Michael Phillips, California State University-Northridge, USA
ABSTRACT
This paper illustrates how a third statistic from asset pricing models, the R-squared statistic, may have information that can help in portfolio construction. Using a traditional CAPM model in comparison to an 18-factor Arbitrage Pricing Style Model, a portfolio separation test is conducted. Portfolio returns and risk metrics are compared using data from the Dow Jones 30 stocks over the period January 2007 through October 2013. Various teaching points are discussed and illustrated.
Keywords: R-Squared; Attribution Stability; Portfolio Construction
INTRODUCTION
egression type models are widely used in financial analysis and have a special place in the analysis of assets for portfolio construction. Two ends of the spectrum include the capital asset pricing model (CAPM), which uses asset returns as a dependent variable and a benchmark return series as a regressor and the Eta® Pricing Model (Chong, Jennings, & Phillips, 2012a), which uses sophisticated statistical methods to relate numerous economic factors to asset prices in an “Arbitrage Pricing Model” framework.
The two primary statistics that are usually derived from these asset pricing models are the constant term of the regression, which is a measure of “alpha” or excess return, and the regression coefficients, colloquially known as “betas” and which indicate the amount of risk from the particular regression term that is estimated to be priced in the asset being studied (Chong, Halcoussis, & Phillips, 2012; Chong & Phillips, 2011). However, the R-squared statistic from these regressions also has an important interpretation and application when constructing portfolios. The R-squared statistic reflects the portion of the asset variance being modeled that is “explained” by a linear function of the indexes or economic factors included in the model. When the regressors are indexes or economic variables, the R-squared is also a measure of the consistency of a statistical relationship over the time horizon used to compute the model parameters, a concept known as “attribution stability” (Chong, Jennings, & Phillips, 2012b).
The stock price of a publicly traded firm reflects the present value of the future cash flows available to equity holders (Parrino, Kidwell, & Bates, 2011, p. 276ff). Using historical data, to the extent that the expected cash flows were closely related to the variables included in the regression models, the R-squared is high. To the extent that the relationship changes, the R-squared will be lower because a constant set of regression parameters will be less applicable over the time period used for the estimation. If a company changes its major product or acquires substantial new subsidiaries in a different business line, then the overall company’s stock may have a different relationship to the overall market and the economy. In such cases, the estimated R-squared, the attribution stability, will be relatively lower.
METHODOLOGY
This educational note studies the stocks in the Dow Jones Industrial Average (DJIA; the Dow 30 stocks) from January 2007 through October 2013. The Dow 30 stocks were selected because they are among the most visible and widely traded securities available; to the extent that the assumptions associated with market efficiency apply to a market, they should apply to these 30 stocks.
The first step in this analysis is to run regressions for each model, for each stock, using data up to the estimation date. While advanced classes may use more complicated estimation methods, ordinary least squares (OLS) was employed in this study. (Alternatives could include OLS with robust standard errors, least absolute deviation estimation, and numerous other methods. While such methods are generally found in popular statistical packages, such as GRETL, MySTAT, or EVIEWS, it is the authors’ experience that alternative methods may be unfamiliar or overly challenging for those business students without an econometric background.) Alternatively, software systems, such as MacroRisk Analytics (available to schools as part of the FAStech program and other distribution channels), provide the regression estimates automatically without the students needing to manipulate raw data or run regressions.
RESULTS
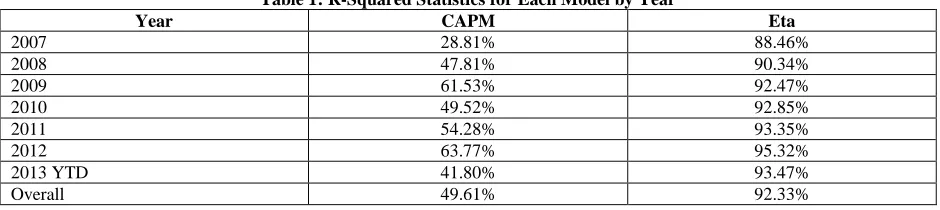
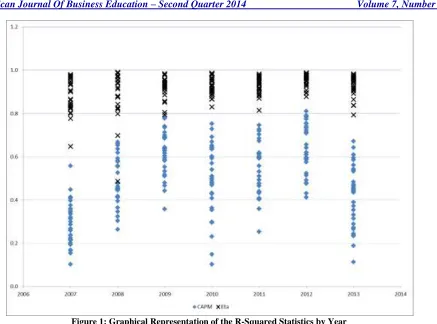
Table 1 shows the average R-squared statistics for the CAPM (single index) model and the Eta Pricing (18-factor) Model by year, and Figure 1 shows the underlying R-squared statistics graphically by year.
Table 1: R-Squared Statistics for Each Model by Year
Year CAPM Eta
2007 28.81% 88.46%
2008 47.81% 90.34%
2009 61.53% 92.47%
2010 49.52% 92.85%
2011 54.28% 93.35%
2012 63.77% 95.32%
2013 YTD 41.80% 93.47%
Overall 49.61% 92.33%
Figure 1: Graphical Representation of the R-Squared Statistics by Year
The more robust Eta Model not only demonstrates a higher explanatory percentage, but also a more concentrated distribution of squared statistics for the whole Dow 30 universe. The wide divergence in the R-squared statistics for the CAPM model also reflects an inherent instability in the CAPM model due to asymmetries between “up markets” and “down markets” (Chong, Jennings, & Phillips, 2013).
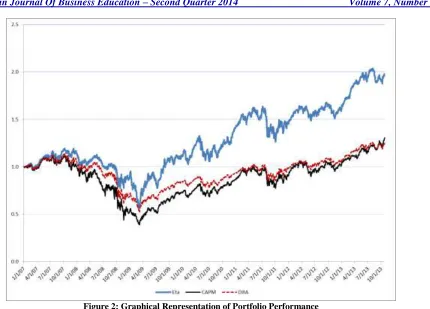
The next step in this exercise is to see whether or not different R-squared statistics have information that is useful in portfolio construction. To assess this, the authors identified the 10 DJIA stocks at the beginning of each year that had the highest CAPM R-squared statistics and constructed equally-weighted portfolios of those stocks. Likewise, for the highest Eta R-squared statistics, the authors also identified the 10 DJIA stocks and constructed equally-weighted portfolios comprising those stocks.
Figure 2: Graphical Representation of Portfolio Performance
Table 2: Summary Statistics of Portfolio Performance
Eta CAPM DJIA
Annualized Return
2007 14.46% 0.78% 6.43%
2008 -21.35% -46.81% -33.84%
2009 23.11% 35.55% 18.82%
2010 27.39% 18.85% 11.02%
2011 3.23% 5.05% 4.69%
2012 10.29% 12.71% 7.26%
2013 YTD 28.81% 35.17% 23.31%
Overall 10.53% 4.02% 3.32%
Standard Deviation
2007 15.42% 16.63% 14.50%
2008 35.62% 55.55% 37.80%
2009 37.75% 30.88% 24.19%
2010 25.15% 20.98% 16.12%
2011 25.44% 26.16% 21.02%
2012 13.23% 16.43% 11.81%
2013 YTD 11.56% 12.12% 10.45%
Overall 25.66% 29.26% 21.52%
Ratio
2007 0.9377 0.0469 0.4434
2008 -0.5994 -0.8427 -0.8952
2009 0.6122 1.1512 0.7780
2010 1.0891 0.8985 0.6836
2011 0.1270 0.1930 0.2231
2012 0.7778 0.7736 0.6147
The above exercise illustrates that attribution stability, at least over the 2007-2013 time period, is associated with a significantly higher return. Of course, students should be reminded that past performance in no way guarantees future returns. However, this illustrates how some widely available, but largely ignored, information can be easily analyzed and evaluated as a portfolio construction criterion.
CONCLUSION
The primary statistics usually derived from asset pricing models are the constant term of the regression (alpha) and the regression coefficients (betas). However, often overlooked is the R-squared statistic from these regressions. Since the R-squared statistic reflects the portion of the asset variance being modeled that is “explained” by a linear function of the factors included in the model, it is an important measure when applied to portfolio construction.
This study, the efficacy of the R-squared statistics of two asset pricing models - the Capital Asset Pricing Model and the Eta Pricing Model - were examined and applied to portfolio construction. From 2007-2013, the Eta R-squared statistics were more consistent, had higher explanatory power, and demonstrated greater robustness than their CAPM counterparts, the result of which are Eta R-squared portfolios that were more profitable and which contained less risk than those formed using the CAPM R-squared measure. The results of this study illustrate how the often neglected R-squared statistic could be utilized as an effective and profitable portfolio construction criterion.
AUTHOR INFORMATION
James T. Chong, Ph.D., is a Professor and Associate Director of the Center for Financial Planning and Investment at California State University, Northridge. He also serves as a Research Economist at MacroRisk Analytics. He received his Ph.D. in Finance from the ICMA Centre, The University of Reading. E-mail: [email protected]
William P. Jennings, Ph.D., is a Professor of Finance and Dean Emeritus of Business at California State University, Northridge, where he was formerly Chair of the Department of Finance, Financial Planning, and Insurance. He received his Ph.D. from the University of California, Los Angeles. E-mail: [email protected]
G. Michael Phillips, Ph.D., is the Director of the Center for Financial Planning and Investment and a Professor of Finance, Financial Planning, and Insurance at California State University, Northridge. He also serves as Chief Scientist for MacroRisk Analytics. He received his Ph.D. from the University of California, San Diego, with specializations in econometrics and applied economics. E-mail: [email protected] (Corresponding author)
REFERENCES
1. Chong, J., Halcoussis, D., & Phillips, G. M. (2012). Misleading betas: An educational example. American Journal of Business Education, 5(5), 617-622.
2. Chong, J., Jennings, W. P., & Phillips, G. M. (2012a). Eta® analysis of portfolios: The economy matters. Journal of Wealth Management, 15(2), 72-84.
3. Chong, J., Jennings, W. P., & Phillips, G. M. (2012b). Five types of risk and a fistful of dollars: Practical risk analysis for investors. Journal of Financial Service Professionals, 66(3), 68-76.
4. Chong, J., Jennings, W. P., & Phillips, G. M. (2013). Why downside beta is better: An educational example. American Journal of Business Education, 6(3), 371-374.
5. Chong, J., & Phillips, G. M. (2011). Beta measures market risk except when it doesn’t: Regime-switching alpha and errors in beta. Journal of Wealth Management, 14(3), 67-72.
6. Fountaine, D., Jordan, D. J., & Phillips, G. M. (2008). Using economic value added as a portfolio separation criterion. Quarterly Journal of Finance and Accounting, 47(2), 69-81.