Research and Reports in Urology 2019:11 53–60
Research and Reports in Urology
Dove
press
submit your manuscript | www.dovepress.com 53
O R i g i n a l R e s e a R c h open access to scientific and medical research
Open Access Full Text Article
The effect of time from biopsy to radical
prostatectomy on adverse pathologic outcomes
Premal Patel1
Ryan sun1
Benjamin shiff1
Kiril Trpkov2
geoffrey Thomas gotto3
1section of Urology, University of Manitoba, Winnipeg, MB, canada; 2Department of Pathology and laboratory Medicine, University of calgary, calgary, aB, canada; 3Department of surgery, University of calgary, calgary, aB, canada
Objective: To assess the impact of time between prostate cancer diagnosis on biopsy and
definitive intervention with radical prostatectomy (RP) in regard to adverse pathologic outcomes using a large multi-surgeon database.
Materials and methods: We retrospectively reviewed 2,728 patients who underwent RP
between 2005 and 2014. Patients were stratified according to biopsy Grade Group (GG). Patho-logic outcomes were evaluated for patients with <2 months between biopsy and surgery and then at monthly intervals of up to 6 months. Adverse pathological outcomes were defined as Gleason upgrading from biopsy, the presence of extraprostatic extension (EPE, pT3a) or seminal vesicle invasion (SVI, pT3b), positive surgical margins, and lymph node positivity. The chi-squared test was used for statistical analysis.
Results: In total 2,310 patients met the inclusion criteria. Median time from biopsy to surgery
was 83 days (range: 61–109 days). No difference was observed for patients in any risk category regarding the adverse pathologic outcomes, including GG upgrade from biopsy to prostatec-tomy, presence of EPE, SVI, positive surgical margins, and positive lymph node involvement, with delays of up to 6 months between biopsy and RP. Surgical margins were positive in 25% of cases with pT2 disease and 50.2% of cases with pT3 and greater disease. EPE and SVI were present in 24.5% and 7.5% of specimens, respectively.
Conclusion: Surgical delays of up to 6 months following prostate biopsy were not associated
with an increased risk of GG upgrading, EPE, SVI, positive surgical margins, or lymph node involvement.
Keywords: radical prostatectomy, prostate cancer, surgical wait time, surgical delay, pathologic
outcomes, prostate biopsy
Introduction
Low-risk prostate cancer (PCa) tends to follow an indolent course with the landmark trial PCa Intervention Versus Observation Trial demonstrating no difference in survival between surgery and observation after nearly 20 years of follow-up.1 This was also
demonstrated in a randomized controlled trial of monitoring, surgery, or radiotherapy for localized PCa at 10 years that demonstrated a low rate of PCa-specific mortality and no significant difference between treatment modalities.2 Given the indolent nature
of low-risk PCa, this led to the development of Active Surveillance (AS) as a tool to reduce the morbidity of radical treatment.3 Now that AS has become the standard of
care for management of low-risk PCa, recent studies have evaluated the risk of adverse pathological findings comparing those undergoing immediate radical prostatectomy (RP) to those with delayed RP. Many of these studies have yielded no significant risk correspondence: Premal Patel
section of Urology, University of Manitoba, 203-1710 Taylor avenue, Winnipeg R3n0n9, MB, canada Tel +1 204 396 2755
email [email protected]
Journal name: Research and Reports in Urology Article Designation: Original Research Year: 2019
Volume: 11
Running head verso: Patel et al Running head recto: Patel et al
DOI: http://dx.doi.org/10.2147/RRU.S187950
Research and Reports in Urology downloaded from https://www.dovepress.com/ by 118.70.13.36 on 27-Aug-2020
For personal use only.
This article was published in the following Dove Medical Press journal:
Dovepress
Patel et al
of adverse findings at RP for those who underwent delayed RP, specifically with low-risk PCa, suggesting there is still a chance for cure with delayed intervention.4–7
Recent reports have also evaluated the potential for select patients with intermediate-risk disease and their eligibility for AS.8 Although promising, there is still a realistic chance
that delayed surgical intervention may increase the risk of adverse pathological findings owing to disease progression and metastatic disease for patients who may have been cured with upfront intervention.7–9
Although several studies have evaluated the possibility of delayed intervention in the setting of indolent, low-risk PCa, there exists a small volume of varied literature report-ing the impact of surgical delay and adverse findreport-ings for intermediate and higher-risk disease, with delays of as short as 30 days reported to correlate with adverse pathological outcomes.10,11 As surgical delay is a common occurrence due
to limited access to operating room resources, we sought to evaluate our institutional outcomes of surgical delay and adverse pathological findings at RP using a large institutional multi-surgeon database.
Materials and methods
Full ethics approval was obtained from the Conjoint Health Research Ethics Board at the University of Calgary. Given that this study was retrospective in nature using deidentified patient information, patient consent for review of medical records was not required. Maintenance of patient data confi-dentiality was in accordance with the Declaration of Helsinki. We retrospectively reviewed all patients who underwent RP between 2005 and 2014 in our institution. The first major revision of Gleason grading system for prostatic carcinoma occurred in 2005 at an International Society of Urological Pathology Gleason consensus conference.12 We used the last
transrectal ultrasound guided biopsy (TRUS bx) prior to sur-gical intervention for the analysis. TRUS bx was performed using a standardized template, which typically included 12 cores sampled from the apex, mid and base, bilaterally. RP was also completely sampled. Both TRUS bx and RP were reported using standardized protocols in a centralized uropa-thology setting. Patients were stratified according to TRUS bx Grade Group (GG),13 age, gland volume, number of positive
cores, total core percent involvement on bx, prostate-specific antigen (PSA), PSA-density (PSAD) and days from biopsy to surgery. Pathologic outcomes were evaluated for patients with <2 months between biopsy and surgery and then at monthly intervals of up to 6 months. Adverse pathological outcomes were defined as GG upgrading from biopsy,
pres-ence of extraprostatic extension (EPE, pT3a) or seminal vesicle invasion (SVI, pT3b), positive surgical margins, and positive lymph node involvement. The chi-squared test and logistic regression were used for statistical analysis.
Results
Of the 2,728 who underwent RP from 2005 to 2014, 2,310 (84.7%) had complete data for analysis. Table 1 presents biopsy GG of all patients and the cohorts’ mean age, median gland volume, number of positive cores, total core percent, PSA, PSAD, and delays from biopsy to surgery. With respect to biopsy GG, 906 (39%), 1,048 (45%), 231 (10%), 69 (3%), and 56 (2.4%) patients had a biopsy GG of 1, 2, 3, 4, and 5, respec-tively. Overall, the mean age was 60.2 years old, median gland volume was 34.1 (IQR: 26.3–44.7), number of positive cores was 4 (IQR: 2–5), total core percent was 8 (IQR: 3–15.5), PSA was 6.0 (IQR: 4.7–8.1), PSAD was 0.18 (IQR: 0.12–0.26), and days from biopsy to RP were 83 (IQR: 61–109).
Table 2 represents the final pathology findings for all patients undergoing RP broken down by GG. Overall, there was a 59.5% concordance rate between biopsy and final sur-gical pathology with 8.7% and 31.8% of cases downgraded and upgraded, respectively. With respect to GG at RP, 514 (22.2%), 1,287 (56%), 349 (15%), 54 (2.2%), and 106 (4.6%) were GG 1, 2, 3, 4, and 5, respectively. In terms of pathologic findings, 76.5% were pT2, 16% were pT3a, and 7.5% were pT3b. Lymph node positivity was present in only 1.5% of final surgical specimens. Surgical margins were positive in 25% of cases with pT2 disease and 50.2% of cases with pT3 and greater disease. EPE and SVI were present in 24.5% and 7.5% of specimens, respectively.
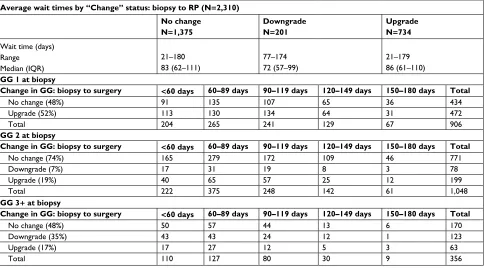
Pathologic outcomes were then evaluated for patients with <2 months between biopsy and surgery and then in monthly intervals up to 6 months. As GG 1 and 2 cor-responded to a significant portion of the cohort (n=1,954, 85%), the remaining GG 3–5 were combined for the purposes of the analysis (n=356, 15%). As shown in Table 3, median wait times between biopsy and RP demonstrating GG “no change”, “upgrade”, and “downgrade” were 83, 72, and 86 days, respectively. Chi-squared analysis demonstrated no increased GG upgrade, when we compared the surgical wait times between biopsy and RP for biopsy GG 1, 2, and 3+
groups. Logistic regression model controlling for baseline characteristics demonstrated no association as well.
Table 4 represents the other evaluated pathologic out-comes that included pT stage, margin, and lymph node status. The median wait times between biopsy and RP pathologic stage of pT2, pT3a, and pT3b disease were 84, 84, and 77
Research and Reports in Urology downloaded from https://www.dovepress.com/ by 118.70.13.36 on 27-Aug-2020
Dovepress Patel et al
Table 1 Biopsy gg of all patients and the cohorts’ mean age, median gland volume, number of positive cores, total core percent, Psa, PsaD, and delays from biopsy to surgery
All patients N=2,310
GG 1 N=906 (39%)
GG 2
N=1,048 (45%) GG 3 N=231 (10%)
GG 4 N=69 (3%)
GG 5 N=56 (2.4%) Age (years)
Range Mean (sD) 38.8–84.2 60.2 (6.9) 38.8–79.0 58.9 (7.0) 40.5–84.2 60.7 (6.7) 45.3–77.4 62.0 (6.7) 47.3–76.6 63.0 (7.2) 50.6–77.8 62.7 (6.4) Gland volume Range Median (iQR) 5.9–213.2 34.1 (26.3–44.7) 5.9–188.7 35.8 (27.7–48.8) 9.8–125.9 32.2 (25.5–41.3) 0.1–213.2 33.9 (26.2–43.7) 14.1–91.5 39.4 (28.5–55.1) 13.3–68.7 32.0 (25.2–44.2)
Number of positive cores
Range Median (iQR) 1–12 4 (2–5) 1–12 2.5 (1–4) 1–12 4 (3–6) 1–11 4 (3–6) 1–10 4 (2–6) 1–11 5 (4–8)
Total core % involvement
Range Median (iQR) 0.1–82.0 8 (3–15.5) 0.1–60.0 4 (1.5–9) 0.1–82.0 10.5 (5–19) 0.4–64.0 12.0 (5.8–21.0) 0.5–58.5 10.0 (4.0–22.5) 3.0–66.5 22.0 (13.0–30.5) PSA (ng/mL) Range Median (iQR) 0.2–60.0 6.0 (4.7–8.1) 0.2–60.0 5.4 (4.3–7.2) 0.5–55.5 6.3 (5.0–8.3) 1.6–45.6 7.0 (5.5–9.5) 1.5–56.1 7.2 (5.6–9.1) 2.9–28.3 8.3 (5.2–12.2) PSAD Range Median (iQR) 0.01–2.12 0.18 (0.12–0.26) 0.01–1.34 0.15 (0.11–0.21) 0.01–2.12 0.19 (0.14–0.28) 0.04–1.45 0.21 (0.15–0.32) 0.04–1.36 0.18 (0.13–0.26) 0.07–0.87 0.26 (0.17–0.39)
Days from biopsy to surgery
Range Median (iQR) 21–180 83 (61–109) 21–180 87 (62–115) 21–177 83 (62–109) 21–169 78 (58–103) 25–147 69 (55–84) 23–151 73 (50.5–93)
Abbreviations: GG, Grade Group; IQR, interquartile range; PSA, prostate-specific antigen; PSAD, prostate-specific antigen density.
Table 2 Final surgical pathology of all patients undergoing RP broken down by biopsy gg All patients
N=2,310 (n, %)
GG 1 N=906 (n, %)
GG 2
N=1,048 (n, %)
GG 3 N=231 (n, %)
GG 4 N=69 (n, %)
GG 5 N=56 (n, %) RP GG 1 2 3 4 5 514 (22.2) 1,287 (56) 349 (15) 54 (2.2) 106 (4.6) 434 (48) 430 (47) 29 (3) 9 (1) 4 (1) 78 (7) 771 (74) 170 (16) 12 (1) 17 (2) 1 (0.5) 73 (32) 116 (50) 17 (7) 23 (10.5) 0 (0) 10 (14) 21 (30) 15 (22) 23 (34) 0 (0) 3 (0.5) 13 (23) 1 (1.8) 39 (74.7) pT pT2 pT3a pT3b 1,766 (76.5) 370 (16.0) 174 (7.5) 827 (91.3) 68 (7.5) 11 (1.2) 763 (72.8) 200 (19.1) 85 (8.1) 130 (56.3) 63 (27.3) 38 (16.5) 33 (47.8) 20 (29.0) 16 (23.2) 13 (23.2) 19 (33.9) 24 (42.9) pN pn0 pn1 pnx 1,838 (79.6) 34 (1.5) 438 (19.0) 619 (68.3) 2 (0.2) 285 (31.5) 896 (85.5) 14 (1.3) 138 (13.2) 209 (90.5) 10 (4.3) 12 (5.2) 67 (97.1) 1 (1.5) 1 (1.5) 47 (83.9) 7 (12.5) 2 (3.6) Surgical margins pT2 negative Positive ≥pT3 negative Positive 1,324 (75.0) 442 (25.0) 271 (49.8) 273 (50.2) 636 (76.9) 191 (23.1) 33 (41.8) 46 (58.2) 559 (73.3) 204 (26.7) 153 (53.7) 132 (46.2) 94 (72.3) 36 (27.7) 47 (46.5) 54 (53.5) 26 (78.8) 7 (21.2) 18 (50.0) 18 (50.0) 9 (69.2) 4 (30.8) 20 (46.5) 23 (53.5) EPE absent Focal established 1,745 (75.5) 263 (11.4) 302 (13.1) 719 (79.4) 97 (10.7) 90 (9.9) 778 (74.2) 125 (11.9) 145 (13.8) 158 (68.4) 30 (13.0) 43 (18.6) 51 (73.9) 7 (10.1) 11 (15.9) 39 (69.6) 4 (7.1) 13 (23.2) SVI absent Present 2,137 (92.5) 173 (7.5) 895 (98.8) 11 (1.2) 963 (91.9) 85 (8.1) 193 (83.6) 38 (16.5) 53 (76.8) 16 (23.2) 33 (58.9) 23 (41.1)
Abbreviations: ePe, extraprostatic extension; gg, grade group; RP, radical prostatectomy; sVi, seminal vesicle invasion.
Research and Reports in Urology downloaded from https://www.dovepress.com/ by 118.70.13.36 on 27-Aug-2020
Dovepress
Patel et al
Table 3 Pathologic change of GG (upgrade, downgrade, no change) stratified by time interval in days from biopsy to surgery
Average wait times by “Change” status: biopsy to RP (N=2,310) No change
N=1,375
Downgrade N=201
Upgrade N=734
Wait time (days) Range
Median (iQR)
21–180 83 (62–111)
77–174 72 (57–99)
21–179 86 (61–110)
GG 1 at biopsy
Change in GG: biopsy to surgery <60 days 60–89 days 90–119 days 120–149 days 150–180 days Total
no change (48%) 91 135 107 65 36 434
Upgrade (52%) 113 130 134 64 31 472
Total 204 265 241 129 67 906
GG 2 at biopsy
Change in GG: biopsy to surgery <60 days 60–89 days 90–119 days 120–149 days 150–180 days Total
no change (74%) 165 279 172 109 46 771
Downgrade (7%) 17 31 19 8 3 78
Upgrade (19%) 40 65 57 25 12 199
Total 222 375 248 142 61 1,048
GG 3+at biopsy
Change in GG: biopsy to surgery <60 days 60–89 days 90–119 days 120–149 days 150–180 days Total
no change (48%) 50 57 44 13 6 170
Downgrade (35%) 43 43 24 12 1 123
Upgrade (17%) 17 27 12 5 3 63
Total 110 127 80 30 9 356
Abbreviations: gg, grade group; iQR, interquartile range; RP, radical prostatectomy.
Table 4 Pathologic stage (pT), margin, and nodal status and time from biopsy to RP
Average wait times by pT status at RP (N=2,310) pT2
N=1,776
pT3a N=370
pT3b N=174
Wait time (days) Range
Median (iQR)
21–180 84 (62–111)
21–176 84 (61–109)
26–175 77 (56–98)
Average wait times by margin status at RP Negative margins N=1,595
Positive margins N=715
Wait time (days) Range
Median (iQR)
21–180 82 (91–109)
21–177 86 (62–112)
Average wait time and node status at RP Negative nodes N=2,276
Positive nodes N=34
Wait time (days) Range
Median (iQR)
21–180 83 (61–109)
31–149 65 (55–90)
Abbreviations: iQR, interquartile range; RP, radical prostatectomy.
days, respectively. We found no association between the wait time and the higher pathological stage on chi-squared analysis and when performing a logistic regression analysis controlling for baseline characteristics. We also found no association between surgical wait time and positive margin
status and lymph node positivity. Median time intervals from biopsy to surgery in margin negative vs margin positive cases were 82 and 86 days, respectively. With respect to lymph node involvement, median number of days in patients with positive lymph nodes was 65 when compared with 83 for surgical specimens without lymph node involvement. We also found no association between the pathologic outcomes and wait times when logistic regression analysis was performed, controlling for the baseline characteristics.
Discussion
Using a large institutional database, we demonstrated that surgi-cal delay of up to 6 months from TRUS bx to RP does not appear to affect the pathologic outcomes for low-, intermediate-, and high-risk disease. We also found no association between wait time and increased rates of other adverse pathologic findings, such as EPE, SVI, and positive margin and lymph node status.
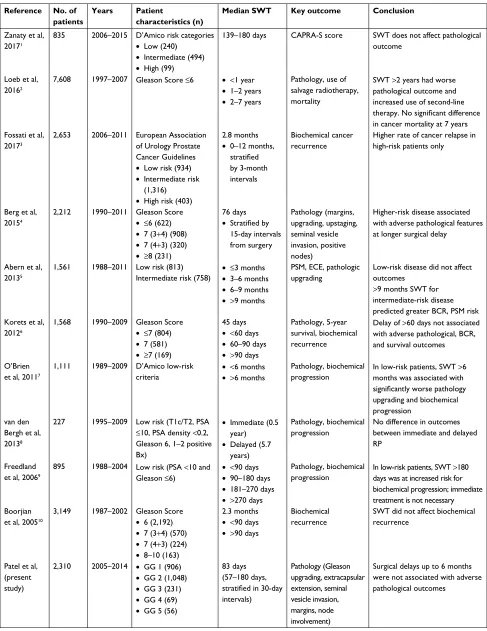
Previous studies that evaluated surgical wait times and pathologic outcomes are summarized in Table S1. The results of these studies have largely been consistent. With respect to low-grade disease, several investigators have reported no risk of adverse pathological outcomes when waiting up to 6 months for surgical intervention. However, adverse outcomes such as increased risk of biochemical and pathologic progres-sion were noted when wait times were >6 months.11,14,15 Our
Research and Reports in Urology downloaded from https://www.dovepress.com/ by 118.70.13.36 on 27-Aug-2020
Dovepress Patel et al
study was limited to 6 months from TRUS bx and therefore we cannot comment on whether prolonged intervention would lead to a greater rate of adverse pathological events. A study by Loeb et al found that men with low-grade disease who had deferred treatment for low-risk disease had more adverse pathological features and required salvage radio-therapy and androgen deprivation radio-therapy when undergoing an RP >2 years after the diagnosis. They found that the overall risk of PCa mortality at 7 years was similar between the immediate vs delayed surgery cohorts.6
Of note, GG 2 (Gleason Score 3+4) patients constituted the largest proportion of our cohort (n=1,048, 54%). We found that surgical delay of up to 6 months was not associated with a higher rate of adverse pathological findings in these patients. With respect to the GG concordance between biopsy and RP in GG 2 patients, the rate was 74%. Recent studies have aimed to assess the eligibility of intermediate-risk patients as candidates for AS, and although these strategies appear promising, there are still valid concerns about missing the chance for cure in patients with clinically localized disease.8,9 A
study evaluating delayed surgical intervention for low-risk and intermediate-risk patients found no increased risk of adverse pathological findings in patients with low-risk disease waiting
>9 months. However, patients with intermediate-risk disease waiting >9 months had a higher chance of positive margins and biochemical recurrence.7 The utility of novel biomarkers
and genetic tests, such as OncotypeDx and Prolaris, may be the key to identifying patients at risk for adverse pathological findings when deciding between immediate surgery and AS management.16 The use of multiparametric magnetic resonance
imaging (mMRI)3,17 and mMRI-guided biopsies may also
potentially have the ability to detect patients with high-risk disease that can lead to unfavorable outcomes while on AS.17
In our analysis, patients with GG 3 (n=231, 10%), 4 (n=69, 3%), and 5 (n=56, 2.4%) were grouped together. Recently, our group reported on the GG concordance between biopsy and RP evaluating the predictors of discordance.18
Overall concordance for GG 3, 4, and 5 were 50%, 22%, and 70%, respectively. Our results, in particular, reflect the litera-ture demonstrating poor correlation between biopsy and RP for GG 4.19,20 Little is known with respect to surgical delays
in the setting of intermediate-risk and high-risk disease. A systematic review in 2013 recommended that up to 3 months represents an acceptable period in which treatment choices should be made, but the authors pointed out the scarcity of available data to make this recommendation.19 In the cohort
presented herein, we demonstrated that a delay of up to 6 months did not yield worsening GG in these patients.
We provide real-life data on surgical delay and the risk of adverse pathological findings at RP, which is particularly relevant for the Canadian Health Care system, as a publicly funded one with limited access to operating room time. These data will allow physicians to counsel their patients that surgi-cal delays of up to 6 months do not lead to worse pathologic outcomes, which may alleviate significant patient and family anxiety, as well as allow for appropriate triaging of surgical cases. Although we demonstrate that higher-risk disease (GG 3+) did not have worse adverse findings with up to 6 month surgical delay, only a small proportion of these patients waited for up to 6 months for surgery (n=9, 2%). The majority of these high-risk patients were operated on within 3 months (n=237, 67%), primarily due to triaging these higher-risk cases.
Our study has several limitations that require recogni-tion. First, although a total of 2,728 constituted our RP database, complete data sets were available for 2,310 (84.7%) patients. Second, this is a single-institution, multi-surgeon, retrospective chart review, with inherent limitations in this study design. Third, as we had a relatively limited number of patients with higher-risk disease, our analysis was per-formed grouping GG 3, 4, and 5 together. Fourth, limited data exist in regard to surgical delay in high-risk patients, which is likely because these patients are being triaged and selected for surgical intervention faster than the low-risk patients. This is certainly true for our institution, as only a very small number of patients with high-risk disease waited for 6 months for surgery. Therefore, we can neither address the question whether a prolonged surgical delay in high-risk disease results in worsening of the pathologic outcomes, nor do we recommend prolonging these procedures, based on presented data. Fifth, our analysis did not include long-term postoperative follow-up, and we are therefore unable to assess relevant downstream outcomes such as biochemical recurrence and survival. Finally, our analysis did not differ-entiate between patients on AS and those with de novo PCa diagnoses prior to RP. However, the possible bias of including significant number of patients who were on AS and who had had at least two or several prior biopsies (with significantly different biopsy findings) is insignificant for this cohort, as an AS program was fully established in our institution only in 2011. Therefore, the possible differences due to inclusion of a significant number of AS subjects in this cohort represent a negligible source of bias.
Conclusion
Using a large, institutional, multi-surgeon database, we found that surgical delays of up to 6 months following prostate
Research and Reports in Urology downloaded from https://www.dovepress.com/ by 118.70.13.36 on 27-Aug-2020
Dovepress
Patel et al
biopsy were not associated with an increased risk of GG upgrading, EPE, SVI, positive surgical margins, and lymph node involvement. In particular, there was no observed differ-ence in adverse pathologic outcomes for patients in any risk category with delays of up to 6 months between biopsy and RP.
Disclosure
The authors report no conflicts of interest in this work.
References
1. Wilt TJ, Jones KM, Barry MJ, et al. Follow-up of prostatectomy ver-sus observation for early prostate cancer. N Engl J Med Overseas Ed. 2017;377(2):132–142.
2. Hamdy FC, Donovan JL, Lane JA, et al. 10-Year outcomes after moni-toring, surgery, or radiotherapy for localized prostate cancer. N Engl J Med. 2016;375(15):1415–1424.
3. Klotz L. Active surveillance for low-risk prostate cancer. Curr Opin Urol. 2017;27(3):225–230.
4. Tosoian JJ, Sundi D, Trock BJ, et al. Pathologic outcomes in favorable-risk prostate cancer: comparative analysis of men electing active surveil-lance and immediate surgery. Eur Urol. 2016;69(4):576–581. 5. Filippou P, Welty CJ, Cowan JE, Perez N, Shinohara K, Carroll
PR. Immediate versus delayed radical prostatectomy: updated out-comes following active surveillance of prostate cancer. Eur Urol. 2015;68(3):458–463.
6. Loeb S, Folkvaljon Y, Robinson D, et al. Immediate versus delayed prostatectomy: nationwide population-based study(.). Scand J Urol. 2016;50(4):246–254.
7. Abern MR, Aronson WJ, Terris MK, et al. Delayed radical prostatectomy for intermediate-risk prostate cancer is associated with biochemical recurrence: possible implications for active surveillance from the search database. Prostate. 2013;73(4):409–417.
8. Musunuru HB, Yamamoto T, Klotz L, et al. Active surveillance for intermediate risk prostate cancer: survival outcomes in the Sunnybrook experience. J Urol. 2016;196(6):1651–1658.
9. Yamamoto T, Musunuru HB, Vesprini D, et al. Metastatic prostate cancer in men initially treated with active surveillance. J Urol. 2016;195(5): 1409–1414.
10. Fossati N, Rossi MS, Cucchiara V, et al. Evaluating the effect of time from prostate cancer diagnosis to radical prostatectomy on cancer control: can surgery be postponed safely? Urol Oncol. 2017;35(4):150. e9–150.e15.
11. Berg WT, Danzig MR, Pak JS, et al. Delay from biopsy to radical pros-tatectomy influences the rate of adverse pathologic outcomes. Prostate. 2015;75(10):1085–1091.
12. Epstein JI, Allsbrook WC, Amin MB, Egevad LL; ISUP Grading Com-mittee. The 2005 International Society of urological pathology (ISUP) consensus Conference on Gleason grading of prostatic carcinoma. Am
J Surg Pathol. 2005;29(9):1228–1242.
13. Epstein JI, Egevad L, Amin MB, et al. The 2014 International Society of urological pathology (ISUP) consensus Conference on Gleason grading of prostatic carcinoma: definition of grading patterns and proposal for a new grading system. Am J Surg Pathol. 2016;40(2):244–252. 14. O’Brien D, Loeb S, Carvalhal GF, et al. Delay of surgery in men with
low risk prostate cancer. J Urol. 2011;185(6):2143–2147.
15. Freedland SJ, Kane CJ, Amling CL, et al. Delay of radical prostatectomy and risk of biochemical progression in men with low risk prostate cancer.
J Urol. 2006;175(4):1298–1303.
16. Cucchiara V, Cooperberg MR, Dall’Era M, et al. Genomic markers in prostate cancer decision making. Eur Urol. 2018;73(4):572–582. 17. Siddiqui MM, Rais-Bahrami S, Turkbey B, et al. Comparison of MR/
ultrasound fusion-guided biopsy with ultrasound-guided biopsy for the diagnosis of prostate cancer. JAMA. 2015;313(4):390–397.
18. Athanazio D, Gotto G, Shea-Budgell M, Yilmaz A, Trpkov K. Global Gleason grade groups in prostate cancer: concordance of biopsy and radical prostatectomy grades and predictors of upgrade and downgrade.
Histopathology. 2017;70(7):1098–1106.
19. Epstein JL, Feng Z, Trock BJ, Pierorazio PM. Upgrading and downgrad-ing of prostate cancer from biopsy to radical prostatectomy: incidence and predictive factors using the modified Gleason grading system and factoring in tertiary grades. Eur Urol. 2012;61(5):1019–1024. 20. Evans SM, Patabendi Bandarage V, Kronborg C, Earnest A, Millar J,
Clouston D. Gleason group concordance between biopsy and radical prostatectomy specimens: a cohort study from Prostate Cancer Outcome Registry - Victoria. Prostate Int. 2016;4(4):145–151.
21. van den Bergh RC, Albertsen PC, Bangma CH, et al. Timing of cura-tive treatment for prostate cancer: a systematic review. Eur Urol. 2013;64(2):204–215.
22. Zanaty M, Alnazari M, Lawson K, et al. Does surgical delay for radi-cal prostatectomy affect patient pathologiradi-cal outcome? A retrospec-tive analysis from a Canadian cohort. Can Urol Assoc J. 2017;11(8): 265–269.
23. Korets R, Seager CM, Pitman MS, Hruby GW, Benson MC, Mckiernan JM. Effect of delaying surgery on radical prostatectomy outcomes: a contemporary analysis. BJU Int. 2012;110(2):211–216.
24. Boorjian SA, Bianco FJ, Scardino PT, Eastham JA. Urological oncology. Does the time from biopsy to surgery affect biochemical recurrence after radical prostatectomy? BJU Int. 2005;96(6):773–776.
Research and Reports in Urology downloaded from https://www.dovepress.com/ by 118.70.13.36 on 27-Aug-2020
Dovepress Patel et al
Supplementary material
Table S1 studies evaluating association between prostatectomy sWT and outcome Reference No. of
patients
Years Patient
characteristics (n)
Median SWT Key outcome Conclusion
Zanaty et al, 20171
835 2006–2015 D’amico risk categories • low (240)
• intermediate (494) • high (99)
139–180 days caPRa-s score sWT does not affect pathological outcome
loeb et al, 20162
7,608 1997–2007 gleason score ≤6 • <1 year • 1–2 years • 2–7 years
Pathology, use of salvage radiotherapy, mortality
sWT >2 years had worse pathological outcome and increased use of second-line
therapy. No significant difference
in cancer mortality at 7 years Fossati et al,
20173
2,653 2006–2011 european association of Urology Prostate cancer guidelines • low risk (934) • intermediate risk
(1,316) • high risk (403)
2.8 months • 0–12 months,
stratified
by 3-month intervals
Biochemical cancer recurrence
higher rate of cancer relapse in high-risk patients only
Berg et al, 20154
2,212 1990–2011 gleason score • ≤6 (622) • 7 (3+4) (908) • 7 (4+3) (320) • ≥8 (231)
76 days • Stratified by
15-day intervals from surgery
Pathology (margins, upgrading, upstaging, seminal vesicle invasion, positive nodes)
higher-risk disease associated with adverse pathological features at longer surgical delay
abern et al, 20135
1,561 1988–2011 low risk (813) intermediate risk (758)
• ≤3 months • 3–6 months • 6–9 months • >9 months
PsM, ece, pathologic upgrading
low-risk disease did not affect outcomes
>9 months sWT for intermediate-risk disease predicted greater BcR, PsM risk Korets et al,
20126
1,568 1990–2009 gleason score • ≤7 (804) • 7 (581) • ≥7 (169)
45 days • <60 days • 60–90 days • >90 days
Pathology, 5-year survival, biochemical recurrence
Delay of >60 days not associated with adverse pathological, BcR, and survival outcomes
O’Brien et al, 20117
1,111 1989–2009 D’amico low-risk
criteria • <
6 months • >6 months
Pathology, biochemical progression
in low-risk patients, sWT >6 months was associated with
significantly worse pathology
upgrading and biochemical progression
van den Bergh et al, 20138
227 1995–2009 low risk (T1c/T2, Psa ≤10, Psa density <0.2, gleason 6, 1–2 positive Bx)
• immediate (0.5 year)
• Delayed (5.7 years)
Pathology, biochemical progression
no difference in outcomes between immediate and delayed RP
Freedland et al, 20069
895 1988–2004 low risk (Psa <10 and gleason ≤6)
• <90 days • 90–180 days • 181–270 days • >270 days
Pathology, biochemical progression
in low-risk patients, sWT >180 days was at increased risk for biochemical progression; immediate treatment is not necessary Boorjian
et al, 200510
3,149 1987–2002 gleason score • 6 (2,192) • 7 (3+4) (570) • 7 (4+3) (224) • 8–10 (163)
2.3 months • <90 days • >90 days
Biochemical recurrence
sWT did not affect biochemical recurrence
Patel et al, (present study)
2,310 2005–2014 • gg 1 (906) • gg 2 (1,048) • gg 3 (231) • gg 4 (69) • gg 5 (56)
83 days (57–180 days,
stratified in 30-day
intervals)
Pathology (gleason upgrading, extracapsular extension, seminal vesicle invasion, margins, node involvement)
surgical delays up to 6 months were not associated with adverse pathological outcomes
Abbreviations: BcR, biochemical recurrence; caPRa-s, cancer of the Prostate Risk assessment Post-surgical; ece, extracapsular extension; gg, grade group; Psa,
prostate-specific antigen; PSM, positive surgical margins; RP, radical prostatectomy; SWT, surgical wait time.
Research and Reports in Urology downloaded from https://www.dovepress.com/ by 118.70.13.36 on 27-Aug-2020
Dovepress
Research and Reports in Urology
Publish your work in this journal
Submit your manuscript here: https://www.dovepress.com/research-and-reports-in-urology-journal
Research and Reports in Urology is an international, peer-reviewed, open access journal publishing original research, reports, editorials, reviews and commentaries on all aspects of adult and pediatric urology in the clinic and laboratory including the following topics: Pathology, pathophysiology of urological disease; Investigation and treatment of
urological disease; Pharmacology of drugs used for the treatment of urological disease. The manuscript management system is completely online and includes a very quick and fair peer-review system, which is all easy to use. Visit http://www.dovepress.com/testimonials.php to read real quotes from published authors.
Dove
press
Patel et al
References
1. Zanaty M, Alnazari M, Lawson K, et al. Does surgical delay for radical prostatectomy affect patient pathological outcome? A retrospective anal-ysis from a Canadian cohort. Can Urol Assoc J. 2017;11(8):265–269. 2. Loeb S, Folkvaljon Y, Robinson D, et al. Immediate versus delayed
prostatectomy: nationwide population-based study. Scand J Urol. 2016;50(4):246–254.
3. Fossati N, Rossi MS, Cucchiara V, et al. Evaluating the effect of time from prostate cancer diagnosis to radical prostatectomy on cancer control: can surgery be postponed safely? Urol Oncol. 2017;35(4):150. e9–150.e15.
4. Berg WT, Danzig MR, Pak JS, et al. Delay from biopsy to radical pros-tatectomy influences the rate of adverse pathologic outcomes. Prostate. 2015;75(10):1085–1091.
5. Abern MR, Aronson WJ, Terris MK, et al. Delayed radical prostatectomy for intermediate-risk prostate cancer is associated with biochemical recurrence: possible implications for active surveillance from the search database. Prostate. 2013;73(4):409–417.
6. Korets R, Seager CM, Pitman MS, Hruby GW, Benson MC, Mckiernan JM. Effect of delaying surgery on radical prostatectomy outcomes: a contemporary analysis. BJU Int. 2012;110(2):211–216.
7. O’Brien D, Loeb S, Carvalhal GF, et al. Delay of surgery in men with low risk prostate cancer. J Urol. 2011;185(6):2143–2147.
8. van den Bergh RC, Albertsen PC, Bangma CH, et al. Timing of cura-tive treatment for prostate cancer: a systematic review. Eur Urol. 2013;64(2):204–215.
9. Freedland SJ, Kane CJ, Amling CL, et al. Delay of radical prostatectomy and risk of biochemical progression in men with low risk prostate cancer.
J Urol. 2006;175(4):1298–1303.
10. Boorjian SA, Bianco FJ, Scardino PT, Eastham JA. Urological oncology. Does the time from biopsy to surgery affect biochemical recurrence after radical prostatectomy? BJU Int. 2005;96(6):773–776.
Research and Reports in Urology downloaded from https://www.dovepress.com/ by 118.70.13.36 on 27-Aug-2020