1078
Impact Of Demographic Variables On
Occupational Stress Among Bank Employees
V.Karthikeyan, Dr.Shweta Lalwani
Abstract: Banking industry plays a vital role in developing economy of a country. The job nature of bank employees is very tedious. Given the condition, it is extremely important to handle customers and to handle stress as individuals spend most of their time at work; At the work place, various roles are performed which have to be in synchronization with the roles at home and other places. The purpose of the study was to find the differences in Occupational Stress level with respect to demographic variables related to age, gender, Education level and Length of service among bank employees in India. Sample consists of 500 respondents who are working in public and private sector banks in India.Results revealed that there is no significant difference in occupational stress levels with respect to age, gender, education level and length of service. Stress handling training should be imparted on a regular basis, so that the employees working in banking sector will be able to handle the customers who in turn will benefit the organization as well as the customer.
Index Terms: Age, Bank, Education, Gender, Length of Service, Occupational Stress,
—————————— ——————————
1.
INTRODUCTION
Banking industry, the backbone of the country‘s economy is playing a major role in prevention of economic cataclysm. The nature of job of banking employees is very tiring as it involves long working hours, inappropriate reward system, role conflict and lack of job autonomy. There is no such thing like stress – free job. Everyone is exposed to tension and anxiety as they get through the duties assigned to them. As a result, organisations constantly have to incorporate changes in strategy, structure, process and culture to ensure continued organisational performance and to maintain competitive advantage. We have moved into an era of customer delight added to increased customer awareness and knowledge of each service. Today, individuals are forced to work and interact on a daily basis with those from varying cultural or ethnic backgrounds, thanks to the increasing diversity in the demography of the workforce in the global economy. The professionals are demanded to communicate empathetically, competently and ethically to maintain a professional demeanor and foster a healthy work environment. In the process the professionals are fatigued and consequently deplete their emotional resources. The study was intended to explore the extent to which demographic characteristics i.e.… gender, educational qualification, age and , length of service are related to occupational stress of bank employees.
2.
OCCUPATIONAL STRESS
In the past two decades, interest in the concept of stress and research has reached all time high. Life would be peaceful
indeed if all of our needs were automatically satisfied. But in reality, many obstacles both personal and environment prevent this ideal situation. All situation positive and negative that requires adjustments can be stressful. The emotional problems that developed were supposed to be due to stress.Carlson(2019) says that, ―Stress is nothing more than a socially acceptable form of mental illness‖. It is the psychological and physical state that results when the resources of the individual are not sufficient to cope with the demands of the work. Occupational stress is stress related to one‘s job. WHO(2019) states that Occupational stress often stems from unexpected responsibilities and pressures that do not align with a person‘s knowledge, skills or expectations inhibiting one‘s ability to cope. Occupational stress can increase when workers do not feel supported by supervisors or colleagues or to feel as if they have little control over work process.Stress can hit anyone at any level of the business. Recent research confines that work related stress is not confined to anyone sector and it is widespread. HSE(2019) defines stress as ―The adverse reaction people have to excessive pressure or other types of demand placed them at work‖ For any individual to be in a stress situation there should be possible sources/ factors of stress (called as stressors). These factors are found to be strenuous in relation to available resources (which can act as mediating or moderating factors as well as can be different for different individuals) to an individual. Because of these stressors, an individual experiences a stress situation of which strain is a consequence.
————————————————
V.Karthikeyn is currently pursuing Doctoral program in Management in Sir Padampat Singhania University, Udaipur, India,
PH-0917708070861. E-mail: kaarthikmba@gmail.com
Health and safety executive (HSE) organisation have identified seven key factors of stress at work place. They are as follows:
Figure 1 - Sources of Stress under work Context Source: (HSE, Health and Safety Executive Management standards)
TABLE 1 - SOURCES OF STRESS
Sl.No Factor Name Description
1 Demands Ability to cope up with the demands of their job 2 Control Ability to have a say about the way they do their work. 3 Peer Support Receive adequate information and support from their
colleagues.
4 Manager‘s Support Receive adequate information and support from their Management (Superiors)
5 Relationships Not subjected to unacceptable behaviors, e.g. bullying at work. 6 Role Employees understanding of their roles and responsibilities. 7 Change Frequent engagement of employees when the organization
undergoes an organizational change.
Source: (HSE, www.hse.gov.uk/stress/standards/index.htm)
3.
LITERATURE REVIEW
Solkhe, Ajay(2011) studied the level of occupational stress among public sector bank employees of Punjab national bank in Punjab, Haryana and Chandigarh. He found that the bank employees are facing high stress with respect to relations with co-workers, responsibility, working conditions etc.Dhawan (2013) examined the stress level of public and private bank employees in India. He found that the employees working at private sector banks encountered more stress than the employees working in public sector banks. He also found that there is a relation between stress perceptions of executives in regard to role stressors. Singh D.(2015)analysed the relation between occupational stress and leadership behavior. He found that the results reflect the leadership style exhibited by the managers leadership style differs on various criteria such as situation, personal attributes etc. Batagoda (2011)
1080 was conducted among school teachers and bank
employees including 14 schools and 17 banks. Samples undertaken were 120 with a break up of 60 school teachers and 60 bank employees in Jaffna. Results revealed that school teachers have high level of ability to manage their stress by using emotional recognition and expression rather than those using by bank staff... Finally EI and its impact on managing stress revealed that both organizations have significant impact of emotional intelligence on managing stress experienced at workplace and the school teachers have higher level of ability manage their stress level by using their emotional intelligence than those using by bank staff. Rahim S. H(2010)studied the relationship between EI competencies and stress. The sample size was 630 bank employees from 23 banks being distributed among Public sector banks: 3, Private Sector: 18, Foreign banks: 2. It concluded that more than 75% employees experience stress on daily basis and demand from higher management.
4.
RESEARCH METHODOLOGY
The current research was conducted in two public sector and private sector banks in India. The mode of data collection is through structured questionnaire developed
by UK Health & Safety Executive's (HSE) management
standards where the first section was related to demographic data of the respondents like age, Gender, Marital Status, Education and length of service. Second section consists of measuring Occupational stress of the respondent.
4.1 Data and Sample
The sampling technique used is non probability
convenience sampling. Population of the study includes 500 respondents, being 267 respondents from public sector and 233 respondents from private sector
4.2 Research Hypotheses:
H1: There is no significant relationship between demographic variables (Gender, educational qualification, age and length of service) and OS dimensions
4.3 HSE Management standards Indicator tool The Health & Safety Executive's (HSE) management standards approach to dealing with work-related stress has recommended the use of a survey to gather the views of employees on their exposure to
seven dimensions of the psychosocial work
environment that can lead to stress-related outcomes if not properly managed. The HSE has developed a 35-item self-report survey instrument, known as the Management Standards Indicator Tool, as a readily accessible resource that organizations may use to investigate employees' exposure to these dimensions. For each inventory item, study participants are requested to indicate, using a five-point Likert scale ranging from ‗Never‘ to ‗Always‘, how often they demonstrate the behaviour in question. Respondents are asked to answer each inventory item.
Table 2 provides a list of the HSE Management standards Indicator tool Inventory subscales with an associated characteristic survey item. The 35 item questionnaire is divided into seven subscales consisting of:
TABLE 2
SUBSCALES OF OCCUPATIONAL STRESS
Sub Scale Name Characteristic Item No of Items
Demands (DE) Includes issues such as workload, work patterns and the work environment
8 items Control(CL) How much say do the people have over the way they work? 6 items Manager‘s Support
(MS)
Included encouragement,sponsorship and resources provided by the organisation
5 items Peer Support (PS) Includes encouragement by line management and colleagues 4 items Relationships(RS) Includes promoting positive working to avoid conflict and deal with
unacceptable behavoior
4 items Role(RL) Do people understand their role within the organisation and does
the organisation ensure roles are not conflicting?
5 items Change (CH) How organisational change is (large and small) managed and
communicated?
3 items
5.
ANALYSIS AND INTERPRETATION
5.1
Analysis of OS Dimensions with respect to Gender
To examine if there exists any difference between Gender and Occupational Stress dimensions, Independent Sample t test was employed
TABLE 3
GROUP STATISTICS OF OS VARIABLES ON GENDER
OS Variable Gender N Mean Std. Deviation Std. Error Mean
DEMANDS(DE) Female 324 23.35 2.547 .142
Male 176 23.34 2.395 .181
CONTROL (CL) Female 324 18.85 2.308 .128
Male 176 18.53 2.138 .161
MANAGERS SUPPORT(MS)
Female 324 15.35 1.725 .096
Male 176 15.34 1.723 .130
PEER SUPPORT(PS) Female 324 10.89 2.024 .112
Male 176 10.72 2.097 .158
ROLE(RL) Female 324 19.40 5.301 .295
Male 176 18.72 5.402 .407
CHANGE (CH) Female 324 9.43 1.659 .092
Male 176 9.13 1.819 .137
RELATIONSHIPS(RS) Female 324 8.48 3.326 .185
Male 176 8.78 3.148 .237
Occupational Stress Female 324 105.75 5.248 .292
Male 176 104.56 5.450 .411
It is evident from table 3, that no significant difference was observed in the mean scores of female and male respondents on the OS dimensions of DE,CL,MS,PS,CH and RS.Variable RL has a moderate difference female being 19.40 and male being 18.72. The overall OS mean score for female and male are 105.75 and 104.56, which is a moderate difference
TABLE 4
INDEPENDENT SAMPLE T-TEST FOR GENDER COMPARISON AMONG OS VARIABLES
t-test for Equality of Means
t df
Sig. (2-tailed)
Mean Difference
Std. Error Difference
DE Equal variances assumed .047 498 .963 .011 .234
Equal variances not assumed .048 378.72 .962 .011 .229
CL Equal variances assumed 1.523 498 .128 .321 .211
Equal variances not assumed 1.558 383.42 .120 .321 .206
MS Equal variances assumed .049 498 .961 .008 .161
Equal variances not assumed .049 359.74 .961 .008 .161
1082 Equal variances not assumed .876 348.47 .382 .170 .194
RL Equal variances assumed 1.354 498 .176 .677 .500
Equal variances not assumed 1.346 353.55 .179 .677 .503
CH Equal variances assumed 1.910 498 .057 .307 .161
Equal variances not assumed 1.858 332.16 .064 .307 .165
RS Equal variances assumed -.992 498 .322 -.303 .306
Equal variances not assumed -1.008 376.53 .314 -.303 .301
OS Equal variances assumed 2.389 498 .017 1.190 .498
Equal variances not assumed 2.362 347.90 .019 1.190 .504
Table 4 depicts the independent t test for OS variables. Their statistical interpretation are given below
DE: Equality of Mean statistics shows that two groups are differing in mean scores, which is not statistically different t (498) = 0.047, p=0.963>0.005
CL: Equality of Mean statistics shows that two groups are differing in mean scores, which is not statistically different t (498) = 1.52, p=0.128>0.005
MS: Equality of Mean statistics shows that two groups are differing in mean scores, which is not statistically different t (498) = 0.049, p=0.961>0.005
PS: Equality of Mean statistics shows that two groups are differing in mean scores, which is not statistically different t (498) = 0.885, p=0.377>0.005
RL: Equality of Mean statistics shows that two groups are differing in mean scores, which is not statistically different t (498) = 1.354, p=0.176>0.005
CH: Equality of Mean statistics shows that two groups are differing in mean scores, which is not statistically different t (498) = 1.910, p=0.057>0.005
RS: Equality of Mean statistics shows that two groups are differing in mean scores, which is not statistically different t (498) = -0.992, p=0.322>0.005
OS: Equality of Mean statistics shows that two groups are differing in mean scores, which is statistically different t (498) = 2.389, p=0.017<0.005
Conclusion:
It is observed that the male and female respondents are statistically not different in terms of OS variables. However there is significant difference between Male and female in terms of Occupational Stress
5.2 ANALYSIS OF OS DIMENSIONS WITH RESPECT TO EDUCATION
To examine if there exists any difference between Educational level and Occupational Stress dimensions, Independent Sample t test was employed.
TABLE 5 -
GROUP STATISTICS OF OS VARIABLES ON EDUCATION
OS Variable Education N Mean Std. Deviation Std. Error Mean
DE Graduate 369 23.39 2.513 .131
Post Graduate 131 23.24 2.440 .213
CL Graduate 369 18.71 2.270 .118
Post Graduate 131 18.82 2.210 .193
MS Graduate 369 15.42 1.718 .089
Post Graduate 131 15.14 1.727 .151
PS Graduate 369 10.78 2.039 .106
RL Graduate 369 19.27 5.254 .273
Post Graduate 131 18.85 5.590 .488
CH Graduate 369 9.30 1.687 .088
Post Graduate 131 9.40 1.822 .159
RS Graduate 369 8.47 3.229 .168
Post Graduate 131 8.89 3.356 .293
OS Graduate 369 105.34 5.457 .284
Post Graduate 131 105.28 5.036 .440
It is evident from table 5, that no significant difference was observed in the mean scores of Graduate and Post Graduate respondents on the OS dimensions of DE,CL,MS,PS,CH and RS.Variable RL has a moderate difference Graduate being 19.27 and Post graduate being 18.85. The overall OS mean score for graduate and Post graduate respondents are 105.34 and 105.28, which indicates no difference
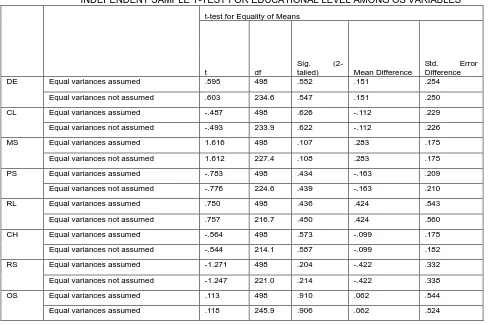
TABLE 6 –
INDEPENDENT SAMPLE T-TEST FOR EDUCATIONAL LEVEL AMONG OS VARIABLES
t-test for Equality of Means
t df
Sig.
(2-tailed) Mean Difference
Std. Error Difference
DE Equal variances assumed .595 498 .552 .151 .254
Equal variances not assumed .603 234.6 .547 .151 .250
CL Equal variances assumed -.487 498 .626 -.112 .229
Equal variances not assumed -.493 233.9 .622 -.112 .226
MS Equal variances assumed 1.616 498 .107 .283 .175
Equal variances not assumed 1.612 227.4 .108 .283 .175
PS Equal variances assumed -.783 498 .434 -.163 .209
Equal variances not assumed -.776 224.6 .439 -.163 .210
RL Equal variances assumed .780 498 .436 .424 .543
Equal variances not assumed .757 216.7 .450 .424 .560
CH Equal variances assumed -.564 498 .573 -.099 .175
Equal variances not assumed -.544 214.1 .587 -.099 .182
RS Equal variances assumed -1.271 498 .204 -.422 .332
Equal variances not assumed -1.247 221.0 .214 -.422 .338
OS Equal variances assumed .113 498 .910 .062 .544
Equal variances assumed .118 245.9 .906 .062 .524
Table 6, depicts the independent t test for OS variables. Their statistical interpretation are given below
DE: Equality of Mean statistics shows that two groups are differing in mean scores, which is not statistically different t (498) = 0.595, p=0.552>0.005
CL: Equality of Mean statistics shows that two groups are differing in mean scores, which is not statistically different t (498) = -.487, p=0.626>0.005
MS: Equality of Mean statistics shows that two groups are differing in mean scores, which is not statistically different t (498) = 1.61, p=0.108>0.005
PS: Equality of Mean statistics shows that two groups are differing in mean scores, which is not statistically different t (498) = -.783, p=0.434>0.005
RL: Equality of Mean statistics shows that two groups are differing in mean scores, which is not statistically different t (498) = 0.780, p=0.436>0.005
CH: Equality of Mean statistics shows that two groups are differing in mean scores, which is not statistically different t (498) = -.564, p=0.573>0.005
-1084 1.271, p=0.204>0.005
OS: Equality of Mean statistics shows that two groups are differing in mean scores, which is statistically different t (498) = .113, p=0.910<0.005
Conclusion:
It is observed that the graduate and post graduate respondents are statistically not different in terms of OS variables. However there is significant difference between male and post graduates in terms of Occupational Stress
5.3 ANALYSIS OF OS DIMENSIONS WITH RESPECT TO AGE GROUP
To examine if there exists any difference in age group of the respondents and Occupational Stress dimensions, one way ANOVA was conducted
TABLE 7-
ANOVA TEST FOR AGE GROUPS WITH RESPECT TO THE DIMENSIONS OF OCCUPATIONAL STRESS OS
Dimension
Age group in years
Total F value Sig. Below 30
years
31 – 40 years
41-50 Years
Above 50 years
DE 23.17
(2.25) 23.60 (2.59) 23.45 (2.53) 23.23 (2.59) 23.35
(2.49) 0.834 0.476
CL 18.59
(2.14) 18.81 (1.98) 18.45 (2.03) 19.02 (2.67) 18.74
(2.2) 1.50 0.212
MS 15.36
(1.70) 15.18 (1.70) 15.29 (1.72) 15.52 (1.76) 15.35
(1.72) 0.904 0.439
PS 10.88
(2.05) 10.70 (2.04) 10.88 (2.05) 10.85 (2.06) 10.83
(2.04) 0.222 0.881
RL 19.14
(5.39) 19.25 (5.06) 19.07 (5.37) 19.15 (5.57) 19.16
(5.3) 0.019 0.996
CH 9.39
(1.73) 9.26 (1.87) 9.29 (1.82) 9.34 (1.52) 9.3
(1.7) 0.142 0.935
RS 8.33
(3.20) 8.78 (3.25) 8.96 3.24) 8.40 (3.33) 8.58
(3.2) 0.977 0.403
Total OS 104.86 (5.63) 105.58 (5.39) 105.38 (5.28) 105.52 (5.07) 105.33
(5.34) 0.506 0.679 Note: The value within bracket refers to SD
Degrees of Freedom (df): Between Groups: 3 Within Groups : 496
In the above ANOVA Table 7,the dimensions of Occupational Stress are compared with different age groups .The significance value for DE,CL.MS,PS,RL,CH and RS are 0.476,0.212,0.439,0.881,0.996,0.935,0.403,0.679respectively which is greater than the significance limit (P>0.05). It States that there is no significant relationship between OS dimensions and Age group.
The overall value of F =.50, and significance value p=.67, which is greater than the significance limit (P>0.05).The fact that the p value is greater than .05, we conclude that that there are no significant differences in Occupational stress between the various age groups. The mean Occupational Stress value is 105.33 and SD is 5.34.
5.4 ANALYSIS OF OS DIMENSIONS WITH RESPECT TO LENGTH OF SERVICE
To examine if there exists any difference in length of service of the respondents and OccupationalStress dimensions, one way ANOVA was conducted
TABLE 8 –
LENGTH OF SERVICE IN YEARS WITH RESPECT TO THE DIMENSIONS OF OCCUPATIONAL STRESS
OS Dimensions
Length of Service
Total F value Sig. 0-5 yrs 6-10 yrs 11-15 yrs
16-20
yrs 21 - 25 yrs
26 yrs & Above
DE 23.11
(2.33) 23.59 (2.37) 23.88 (2.83) 23.15 (2.38) 23.41 (2.70) 23.45 (2.41) 23.35
(2.49) 0.99 0.42
CL 18.77
(1.96) 18.52 (2.28) 18.51 (2.01) 18.79 (2.40) 18.81 (2.77) 19.03 (1.57) 18.74
(2.25) 0.37 0.87
MS 15.30
(1.70) 15.13 (1.70) 14.96 (1.70) 15.56 (1.74) 15.44 (1.73) 15.79 (1.80) 15.35
(1.72) 1.46 0.2
PS 10.88
(2.05) 10.78 (2.11) 10.71 (2.04) 10.86 (2.08) 10.93 (2.03) 10.39 (2.01) 10.83
(2.05) 0.42 0.84
RL 19.13
(5.42) 19.22 (5.04) 18.71 (4.65) 19.29 (5.73) 19.12 (5.44) 19.73 (5.57) 19.16
(5.34) 0.16 0.98
CH 9.43
(1.76) 9.16 (1.84) 8.96 (1.61) 9.51 (1.99) 9.26 (1.55) 9.48 (1.37) 9.32
(1.72) 0.95 0.45
RS 8.46
(3.12) 8.86 (3.39) 9.10 (3.25) 8.83 (3.31) 8.30 (3.36) 8.30 (3.34) 8.58
Total OS 105.08 (5.32)
105.2 (5.68)
104.8 (5.83)
106.0 (5.27)
105.28 (5.06)
106.18 (5.35)
105.33
(5.35) 0.59 0.73
Note: The value within bracket refers to SD
Degrees of Freedom (df): Between Groups: 5 Within Groups : 494
In the above ANOVA Table 8,the dimensions of Occupational Stress are compared with length of service .The significance value for DE,CL.MS,PS,RL,CH and RS are 0.42,0.87,0.2,0.84,0.98,0.45,0.63 respectively which is greater than the significance limit (P>0.05). It States that there is no significant relationship between OS and length of service
The overall value of F =.59, and significance value p=.73, which is greater than the significance limit (P>0.05).The fact that the p value is greater than .05, we conclude that that there are no significant differences in Occupational stress between the various age groups. The mean Occupational Stress value is 106.18 and SD is 5.35.
6. DISCUSSION AND CONCLUSION:
Employee is the key asset for any organization. No organization can succeed without employee‘s contribution. In recent times, huge interest has been given by organizations to examine conditions of factors that foster greater employee working environment. The interest is to be believed that the behaviours of satisfied employees made positive contributions to the organizational effectiveness and performance. Gone are those days where we talk about customer satisfaction. The present competitive business expects customer delight. The present study helped in understanding Occupational stress level among bank employees in India. Results of the study have conclusively proved that there is no difference in occupational stress in relation to demographic factors relat4d to age, gender, education and length of service. Employers need to study the stress level on a regular basis and need to provide stress relaxation training programmes .Employees need to gear up and update them in enhancing their customer interaction, for which they should be emotionally capable to handle customers in highly stressful conditions.
REFERENCES
[1] T. Lu and W. Neng, "Future internet: The Internet of Things," in Advanced Computer Theory and Engineering (ICACTE), 2010 3rd International Conference on, 2010, pp. V5-376-V5-380. [2] Batagoda, W. (2011). Job Stress and Job Satisfaction: A
study of Managerial Employees in Domestic Commercial bANKS. International Conference on Business and. Colombo
[3] Belias. (2011). Occupational stress and emotinal intelligence among greece bank employees. International Journal of human resource studies , 79-101
[4] Carlson. (n.d.). Retrieved june 6, 2019, from www.legacee.com: https://www.legacee.com/core-competencies/self-mastery/what is stress/
[5] Dhawan. (2013). Am Emprical analysis of role stressors in the banking sector. Global E-learning Journal , 2-17. [6] Dimitrios Belias, A. K. (2013). Occupational Stress and
Emotional Inteligence among Greek Bank Employees. International Journal of Human Resource Studies , 79-101.
[7] HSE. (n.d.). Retrieved June 06, 2019, from www.hse.gov.uk/:
www.hse.gov.uk/stress/standards/index.htm
[8] HSE. (n.d.). Health and Safety Executive Management standards. Retrieved June 06, 2019, from www.hse.gov.uk/:
www.hse.gov.uk/stress/standards/index.htm
[9] HSE. (n.d.). www.hse.gov.uk/stress/standards/index.htm. Retrieved June 06, 2019, from www.hse.gov.uk: www.hse.gov.uk
[10]Kappagoda, S. (2013). Emotional Inteligence of the
Managers in the Banking Sector in Srilanka. International Journal of Research in Commerce,IT and Management , 1-6.
[11]Mayuran. (2013). Impact of emotional intelligence on stress management: study of schools with banks in jaffna district. Global Journal of commerce and management perspective , 67-71.
[12]Rahim, S. H. (2010). Emotional Intelligence and Stress: An Analytical Study of Pakistan Banks . International Journal of Trade, Economics and Finance , 194-199. [13]Singh, D. (2015). Emotional Intelligence at work : A
Professional guide. India: Sage Publications,4th Edition. [14]Solkhe, Ajay. (2011). Occupational Stress among Bank
employees : A case study of Nationalised Bank. Gyanpratha- Accman Journal of Management , 67-74. [15]WHO. (n.d.). Retrieved June 06, 2019, from
https://en.wikipedia.org/wiki/Occupational_stress.
[16]WHO. (n.d.).