Lincoln
University
Digital
Thesis
Copyright
Statement
The
digital
copy
of
this
thesis
is
protected
by
the
Copyright
Act
1994
(New
Zealand).
This
thesis
may
be
consulted
by
you,
provided
you
comply
with
the
provisions
of
the
Act
and
the
following
conditions
of
use:
you
will
use
the
copy
only
for
the
purposes
of
research
or
private
study
you
will
recognise
the
author's
right
to
be
identified
as
the
author
of
the
thesis
and
due
acknowledgement
will
be
made
to
the
author
where
appropriate
Population and diet of the New Zealand fur seal
(
Arctocephalus forsteri
): molecular approaches
A thesis
submitted in partial fulfilment
of the requirements for the Degree
of PhD of E
volutionary Genetics
at
Lincoln University
by
Arsalan Emami Khoyi
Abstract of a thesis submitted in partial fulfilment of
the requirements for the Degree of PhD
Evolutionary-
Genetics
Abstract
Population and diet of the New Zealand fur seal (
Arctocephalus forsteri
):
molecular approaches
by
Arsalan Emami Khoyi
The recent increase in the New Zealand fur seal (Arctocephalus forsteri) population has given
rise to socio-economic concerns regarding the potential conflicts with human interests.
Elaboration of a comprehensive management strategy has been hindered by the paucity of
solid information concerning New Zealand fur seal ecology.
Recent developments in massive parallel DNA sequencing and computational infrastructures
were used to address some of the major areas of conflict with human commercial interests.
The first focus of the current study was to test a series of non-destructive methods for
collecting biological samples for high- throughput DNA analysis.
A second focus of the study was application of whole mitochondrial genomes in conjunction
with Y chromosome Zinc fingers (ZFY) from New Zealand fur seals throughout the whole range
of the species distribution in an Approximate Bayesian Computation framework to reconstruct
the recent demographic history of the species. The pristine population size (pre-human
colonisation), historical population size after human first arrival and the bottleneck population
size were estimated.
There was enough variability left in the mitochondrial genomes to detect the 18th -19th-
century’s population bottleneck in the species. The pattern observed in ZFY data set was more
uniform in its distribution with few distant haplotypes that could represents the presence of
old lineages or potential introgression from other sympatric species.
The intriguing pattern observed in ZFY data also resulted in the discovery of a rare genomic
event called ‘’ectopic gene conversion” between non- recombining parts of Y and X
chromosomes in the New Zealand fur seal genome
The third focus of the study is on the fine scale population structure of NZ fur seals at a local
scale around Banks Peninsula, -South Island, and New Zealand. No evidence of local
population structure was found in the area suggesting the presence of substantial gene flow
among colonies at a local scale. Moreover, the “spill over“ colony expansion dynamics,
suggested previously as a pattern for recolonizing new habitat, was supported at the local
scale using genetic data. Most of the newly-established colonies in the area showed the
highest degree of genetic structure similarities with older colonies in their vicinity emphasizing
the important role of “spill over” dynamics of older colonies in formation of new colonies. The
data significantly support multi recolonization events with occasional local recruitment of
immigrating individuals.
There is a short mitogenomic announcement in chapter five where I used the complete
mitogenomes of New Zealand fur seals in addition to three mustelid species (all de novo
sequenced in the current research) to re-examine the origin of pinnipeds in the light of new
Data supported a generalist pattern of feeding behaviour of the New Zealand fur seal. As many
as 64 prey species were identified from faecal samples and/or regurgitates in a single colony.
Surprisingly, only 10% of species in fur seals diet were species of commercial interest.
The population and diet data will provide marine ecosystem managers with an increased
knowledge necessary for elaborating any long-term conservation plan for the New Zealand fur
seal.
Keywords: New Zealand fur seals, Banks Peninsula, mitochondrial, zinc finger, ABC,
Acknowledgements
I would like to express my sincere gratitude to my supervisors, Dr Adrian Paterson, Dr Robert
Cruickshank and advisor Dr Laura Boren, for their patience, excellent guidance and immense
support during my PhD.
I would like also to thank Dr James Ross and Dr Elaine Murphy for their exemplary generosity
and encouragement during my research.
I am sincerely thankful of Lincoln University and New Zealand Department of Conservation
and its rangers for providing me with the unique opportunity of pursuing current research and
consolidating my knowledge.
A special thanks to Dr David Hartley for his excellent ideas and perseverance in laboratory
work and to Dr Andrea Betancourt for patiently walking me through the fascinating world of
population genetics.
I would like to express my appreciation to all other people at Lincoln University and
elsewhere who contributed to my research.
I also express my respects to Dr Masoud Afzali for his inspiring presence in the hardest period
Table of Contents
Once you have edited this document you will need to update the Table of Contents to reflect the
changes, and to remove any error messages. To update the Table of Contents, right-click anywhere
on the grey area below, select ‘Update Field’ (and select ‘Update Entire Table’ if prompted). Delete
this note when you are familiar with how to update this table of contents.
Abstract ... ii
Acknowledgements ... v
Table of Contents ... vi
List of Tables ... viii
List of Figures ... ix
Chapter 1 Introduction ... 1
1.1 Evolution of seals ...5
1.2 Otaridae ...6
1.3 Fur seals ...7
1.3.1 New Zealand fur seal ... 7
1.3.2 Exploitation history ... 9
Chapter 2 A research diary of the specimen collection methods ... 12
2.1 Flipper notching ... 12
13 2.2 Non-invasive methods of DNA collection ... 14
2.2.1 Buccal Swabs ...14
2.2.2 Environmental DNA ...17
2.2.3 Dart Biopsy ...19
Chapter 3 New Zealand fur seal population genetics using complete mitochondrial DNA and evidence for X to Y gene conversion ... 26
3.1 Introduction ... 27
3.2 Material and methods ... 32
3.2.1 Sample collection ...32
3.2.2 Justification for number of sequenced individuals ...32
3.2.3 Whole mitochondrial genome sequencing and assembly ...36
3.2.4 Y Chromosome zinc finger sequencing and assembly ...38
3.2.5 An overview of the analysis ...39
3.3 Results ... 52
3.3.1 Mitochondrial DNA ...52
3.3.2 Estimating posterior distribution of the parameters ...56
3.3.3 ZFY data ...56
3.4 Discussion... 71
Chapter 4 Fine scale population structure and colony expansion dynamics of New Zealand fur
seals (Arctocephalus forestri) around Bank Peninsula ... 84
4.1 Introduction ... 85
4.2 Material and Methods ... 89
4.2.1 Tissue collection ...89
4.2.2 Control region amplification/ analysis ...91
4.3 Results ... 93
4.4 Discussion... 103
Chapter 5 A mitogenomic announcement: complete mitochondrial genome of the stoat (Mustela erminae) and New Zealand fur seal (Arctocephalus forsteri) and their significance for mammalian phylogeny ... 107
Chapter 6 Identifying prey and parasite items from New Zealand fur seal faeces using massive parallel sequencing ... 118
6.1 Introduction ... 118
6.2 Material and Methods ... 123
6.3 Results ... 125
6.3.1 Stewart Island ...126
6.3.2 Fiordland ...126
6.3.3 Kaikoura ...127
6.3.4 Cape Palliser ...127
6.3.5 Bay of Plenty ...127
6.4 Discussion... 128
6.4.1 New Zealand fur seal parasites ...128
6.4.2 New Zealand fur seal prey Items ...129
Chapter 7 Conclusion ... 137
Appendix A Brief history of Zinc finger markers ...143
List of Tables
Table 3-1. Long PCR primer combinations designed to amplify New Zealand fur seal whole
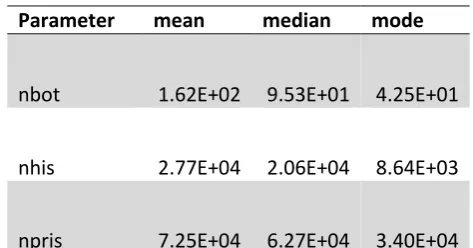
mitochondrial genomes. ...38 Table 3-2 Basic statistics calculated from 50 New Zealand fur seals mitogenomes ...53 Table 3-3 the summary statistics (mode, median and mode) calculated from posterior distribution
of the estimated parameters. The bottleneck population size (Nbot), the size of the fur seal population after first arrival of humans in to New Zealand (Nmao) and
pristine population size (Npris). ...61 Table 3-4 Bias and precision of ABC analysis of bottleneck and historical population size. The
number are calculated from posterior distribution of the parameter. (NBOT), the size of population after first arrival of humans in to New Zealand (NMAO and pristine population size (NPRIS). The true values correspond to the known value based up on them the pseudo data were created. ...62 Table 3-5 Basic statistics calculated from the first group of ZFY sequences ...63 Table 3-6 Basic statistics calculated the second group of ZFY sequences. ...64 Table 3-7 BLAST results for the first consensus sequence calculated from New Zealand fur seal ZFY
data. ...67 Table 3-8BLAST results of the second group of New Zealand fur seal ZFY consensus sequence. ....68 Table 3-9 Position and length of putative gene conversion sites among New Zealand fur seals
group 1 consensus ZFY sequence and Californian sea lion ZFX (Next page). ...69 Table 4-1 Absolute pairwise shared haplotypes among different colonies in Banks Peninsula.
Number inside parenthesis represent the number of samples taken from each colony. ...95 Table 5-1 Annotation of the protein coding genes in New Zealand fur seal complete
mitogenome. ...115 Table 5-2 Annotation of the tRNA genes in New Zealand fur seal complete mitogenome. ...116 Table 5-3 Annotation of the rRNA genes in New Zealand fur seal complete mitogenome. ...117 Table 6-1 Fish and squid species identified from New Zealand fur seal faecal samples across 5
different colonies across New Zealand ...133 Table 6-2 Parasite species identified from New Zealand fur seal faecal samples across 5
List of Figures
Figure 2-1 A New Zealand fur seal neutralized for biopsy collection by researchers at Banks Peninsula. Picture from author...13 Figure 2-2 A standard Schulz mouth gag. Picture kindly provided by medical- Tool Company
(http://www.medical-tools.com/ ...16 Figure 2-3 A Pneu dart DNA collection device. Picture from the company web site
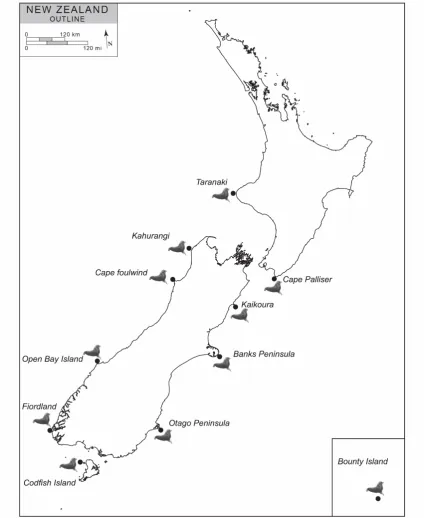
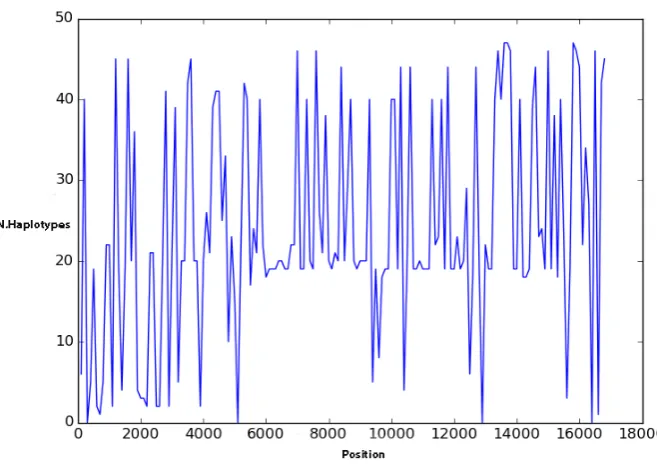
(http://www.pneudart.com) ...22 Figure 3-1 New Zealand colonies where tissue biopsies were collected. ...33 Figure 3-2 Variation is the resolution power of different 100 bp long windows of New Zealand fur
seal mitochondrial DNA in identifying correct number of haplotypes. X axis is position in the fur seal genome and Y axis is the number of identified haplotypes for that window. Zero means that those fragments don’t have resolution power to differentiate between sequences at all. In other word the sequence it is not
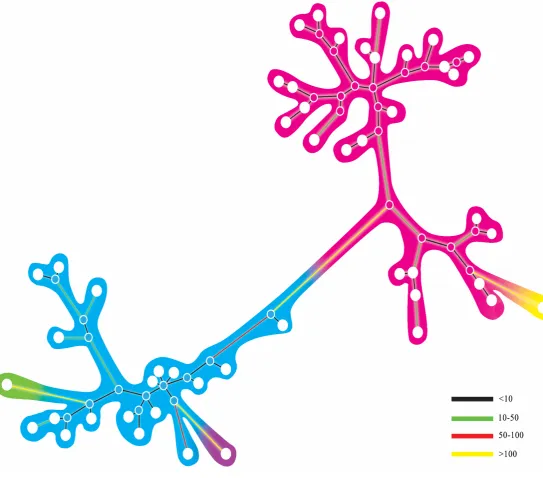
variable. ...36 Figure 3-3 A median- joining network constructed from whole mitochondrial genomes. The
different coloured lines (black, green, yellow and red) demonstrate mutation steps between neighbouring
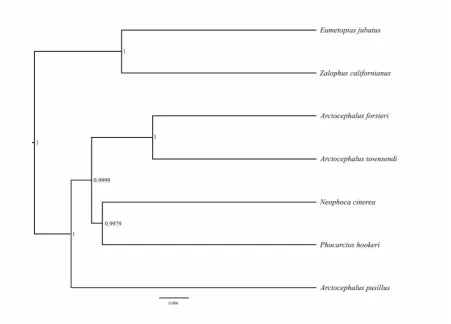
haplotypes. Empty circles show median haplotypes while the full circles show the observed haplotypes. The yellow, magenta and green haplotypes were considerably separated from the rest of network. ...54 Figure 3-4 A Bayesian phylogenetic tree reconstructed from complete mitochondrial DNA of seven
different species of Otaridae. Numbers on each node represent posterior
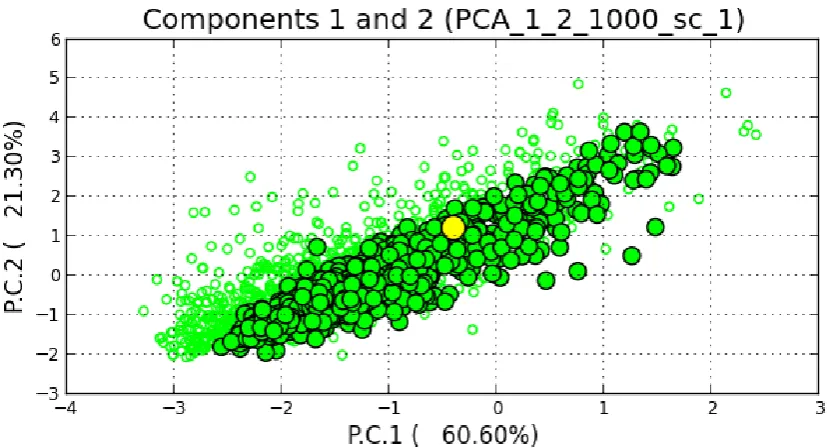
probabilities. The scale bar represents base substitutions in the mitogenomes. ...55 Figure 3-5 Principal Component Analysis (PCA) of the ABC simulations for the mitochondrial data
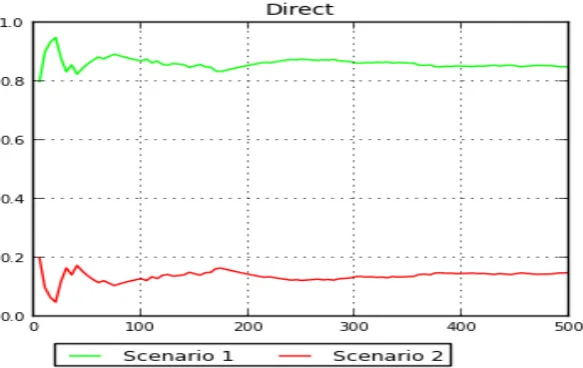
for a population that passed through a bottleneck 250 years ago (above) and a population with constant size in the past 250 years (below). The yellow circle shows the position of the observed data. The X and Y axes respectively illustrate the first and second principal components, which together explain over 80% of the variation in posterior distributions. ...57 Figure 3-6 Posterior probability of the bottleneck model (scenario1) and a constant size
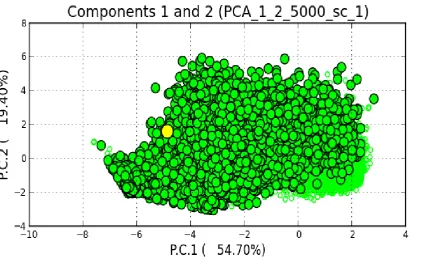
population (scenario2) calculated from a subset of 500 and 2000 closest simulated data set in a direct estimation and logistic regression method. X axis is subset of closest data set and Y axis is the posterior probability. ...58 Figure 3-7 Principal Component Analysis (PCA) of the ABC simulations for the mitochondrial data
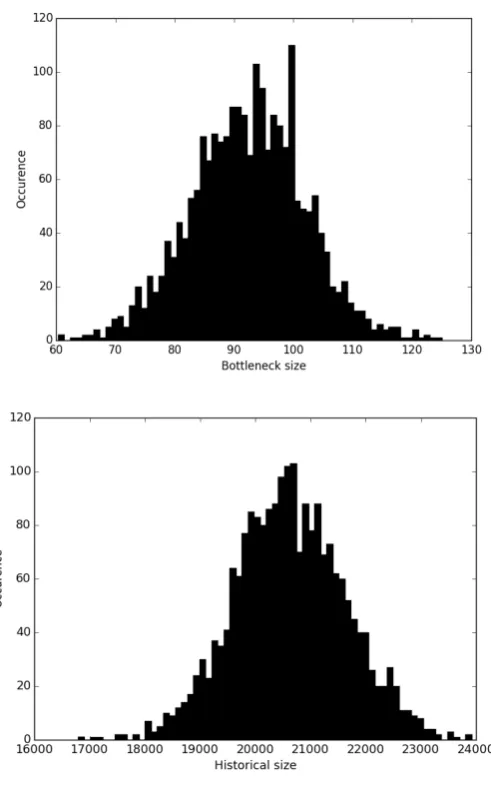
for a population that passed through a bottleneck 150 years ago The yellow circle shows the position of the observed data. The X and Y axes respectively illustrate the first and second principal components, which together explain over 70% of the variation in posterior distributions ...59 Figure 3-8 Posterior distributions of the bottleneck population size , the size of population after
first arrival of humans in to New Zealand, historical size and pristine population size of New Zealand fur seals. Note that the numbers on the Y axis are direct counts. ...60 Figure 3-9 A Bayesian phylogenetic tree for ZFY sequences. The (a) and (b) phylogenetic tree
Figure 4-3 A Bayesian Phylogenetic tree of mitochondrial DNA control region from Bank Peninsula. The scale bar show the substitution in mitochondrial DNA control region (Black and grey represent different clades in the area ...97 Figure 4-4 Principal Component Analysis (PCA) of the ABC simulations for the mitochondrial data
for a model depicting multisource nature of recolonization of the Banks
Peninsula.The yellow circle shows the position of the observed data. The X and Y axes respectively illustrate the first and second principal components, which together explain over 50% of the variation in posterior distributions. ...98 Figure 4-5 Posterior probability of multisource pattern of recolonization of Banks Peninsula
(scenario1) and a single massive recolonization (scenario2) and gradual increase from a small population of size 100 (scenario3) calculated from a subset of 2000 closest simulated data set in a logistic regression estimation method. X axis is subset of closest data set and Y axis is the posterior probability. ...100
Figure 4-6 the mantel test on mitochondrial DNA control region from Banks Peninsula. X axis is geographical distance and Y Axis is genetic distance. ...101
Figure 4-7 Spatial autocorrelation of the mitochondrial DNA control region from Banks Peninsula. X axis is distance classes and Y axis (Ay) is genetic distance. ...102 Figure 4-8 Genetic landscape of mitochondrial DNA control region from Banks Peninsula. X and Y
axis are geographic coordinates of the sampled colonies and Z axis is genetic distance among haplotypes. ...103 Figure 5-1 A Bayesian Phylogenetic tree constructed for eleven members of Mustelidae, two
member of Ursidea and two pinnipeds (New Zealand fur seal (Arctocephalus forsteri) and Weddell seals (Leptonychotes weddelii)). Numbers of each node represent posterior distribution and scale bar is time in millions of years. ...113 Figure 5-2 A Bayesian Phylogenetic tree constructed for eleven members of Mustelidae, two
member of Ursidea and two pinnipeds (New Zealand fur seal (Arctocephalus forsteri) and Weddell seals (Leptonychotes weddelii)). Numbers of each node represent estimated divergence date (Millions years ) and scale bar is time in millions years.Figure 5-1 A Bayesian Phylogenetic tree constructed for eleven members of Mustelidae, two member of Ursidea and two pinnipeds (New Zealand fur seal (Arctocephalus forsteri) and Weddell seals (Leptonychotes weddelii)). Numbers of each node represent posterior distribution and scale bar is time in millions of
Chapter 1
Introduction
Applications of DNA-based methods to wildlife ecology issues is a fast developing domain for
ecological studies. The advent of new sequencing technologies has opened a new horizon for
wildlife managers to answer many questions of ecological relevance. Examples of DNA-based
methods applications to the major areas of wildlife science are numerous. Molecular
approaches have been successfully tested in wildlife forensics (Alacs, Georges et al. 2010),
estimating census and effective population size (Gardner, Royle et al. 2010, Harris, Winnie et
al. 2010, Brinkman, Person et al. 2011), diet and trophic dynamics (Carreon-Martinez and
Heath 2010, Deagle, Chiaradia et al. 2010), fine scale population structure (Sellas, Wells et al.
2005, Warnock, Rasmussen et al. 2010), tracking of individuals (Ernest, Penedo et al. 2000),
diversity (Nybom 2004) and population genomics (Hohenlohe, Bassham et al. 2010).
The population of fur seals (Arctocephalus forsteri) in New Zealand is increasing (Taylor 1982,
Dix 1993, Lalas and Harcourt 1995, Taylor, Barton et al. 1995, Bradshaw, Lalas et al. 2000) and
escalating conflict with fisheries and coastal region inhabitants seems inevitable (Lalas and
Bradshaw 2001). Density-dependent factors, such as habitat quality, are not strong enough to
regulate population expansion at this stage (Crawley 1990). The future of this species will be
a major area of concern for all New Zealand marine ecosystem managers in coming years. A
The expansion of fishing industries and the application of the modern processing and storage
technologies have changed the traditional concept of commercial species. Species classified
as non-commercial are now of increasing economic value which, in turn, expands the potential
degree of conflict between humans and fur seals. Understanding the extent of competition
between seals and humans is not possible without precise knowledge of fur seal diets.
There have been several valuable studies concerning New Zealand fur seal diets in New
Zealand (see Chapter 5 on diet). Several issues prevent the large-scale application of these
studies. First, the fur seal diet is dynamic, it changes according to time and space and it is
difficult to generalize findings from one study to the whole populations in all of their
distribution areas. Each study is no more than a snapshot which, at best, represents
characteristics of a particular population at a specific time. Second, none of the methods used
to determine fur seal diet are free of biases. Comparisons of data obtained using different
methods are not always valid. Each method of diet reconstruction performs well in identifying
some elements of the diet but does not re-construct other contributors to an individual diet
with equal precision (Tollit, Steward et al. 1997). A combination of different methods can
provide the most precise estimation and that is why any new methods of diet estimation is
worth investigating.
Major contributors to the fur seal diet have been identified using traditional hard-parts
methods (see Chapter 5). Uncertainty concerning the contribution of both small-sized species
(with easily degradable hard-parts) and large-sized species (that cannot be consumed
completely and, therefore, usually lack diagnostic hard parts) still persists. Furthermore,
traditional methods are inappropriate for analysing the contribution of soft-bodied species
Molecular techniques can be used as a complementary method for more accurate diet
estimation and the new method has the potential to provide scientists with a range of new
data, otherwise unobtainable by traditional methods. The current study is the first application
of molecular methods to study fur seal diet in New Zealand. A molecular approach may
validate (or invalidate) earlier traditional studies of diet and provide ecosystem managers with
more solid knowledge of New Zealand fur seal diet for any future decision making. By targeting
the diversity and complexity of fur seal diet, the more accurate role of this animal in marine
food webs will be clarified and the potential fields of conflict with human interests will be
established. These results will help decision makers, and especially conservation authorities,
to better understand the dynamics of fur seal diets and, therefore, to construct more precise
ecosystem management plans.
A second focus of the current research will address the issue of genetic diversity in New
Zealand fur seal populations. What effect has the severe population bottleneck and
subsequent re-colonisation of New Zealand by fur seals had on genetic structure and variation
in the species? Is it necessary to continue with existing conservation plans? At what point will
we need to intervene (if at all)? Current knowledge of fur seal population biology does not
allow us to answer these questions confidently.
It is expected that, due to a history of severe over-harvesting during the last few centuries,
the current fur seal population in New Zealand does not show a high degree of genetic
further investigation. Without exact answers to these questions we cannot decide on the
future of current management programs.
This thesis follows four different objectives: In chapter two the advantages and disadvantages
of different methods of biological sample collection are discussed and the rationale for why
dart biopsy and/or flipper –notching were chosen as the preferred method for sample
collection is expressed in detail. Finally, some concerns regarding the use of these methods
are reviewed.
In chapter three two models of evolutionary history (constant size versus a bottleneck model)
in the evolutionary history of New Zealand fur seals is evaluated simultaneously. The timing
of the bottleneck, its size and the size of the fur seal population before human large-scale
colonisation of New Zealand are estimated. Consistency between two markers with different
inheritance pattern (mitochondrial DNA versus Zinc Finger on Y chromosome) in
reconstructing the evolutionary history of New Zealand fur seals are tested.
In chapter four, the fine-scale population genetic structure of New Zealand fur seals in Banks
Peninsula is studied. Female philopatry and stability of matrilineal societies are investigated.
The founder effect and its severity in the recolonization of Banks Peninsula is tested in more
detail.
In chapter five the evolutionary history of pinnipeds were re-examined using few new
mitogenomes sequenced in this research.
In chapter six the main contributors to the fur seal diet are identified using a massive parallel
sequencing method on faecal DNA. The potential overlaps with commercial or recreational
1.1
Evolution of seals
The first mammalian species appeared on land approximately 200 million years ago. The
existence of mammals adapted to life in the sea represents “a return to the ancestral home”
rather than direct descent from marine ancestors (Reeves and Stewart 2003). Several
independent lineages re-entered the sea (Reeves and Stewart 2003). The small, primitive,
hoofed, probably hippopotamus-like, ancestors of cetaceans (whales, dolphins, and
porpoises) and the sub-ungulate ancestors of the sirenia (manatees, dugongs, and sea cows)
were the first mammals to re-invade the seas. Mammals similar to modern day cetaceans and
sirenians flourished in early Eocene waters more than 50 million years ago (Doming 2002,
Fordyce 2002 ). Later, possibly in the late Oligocene or early Miocene (15-30 million years ago),
the bear- or weasel-like ancestors of the Otariidae (fur seals and sea lions), Odobenidae
(walrus) and Phocidae (true seals) began re-invading the aquatic habitats (Berta 2002). The
latest waves of water re-invasions resulted in modern species like the polar bears, sea otters,
and marine otters (Heyning and Lento 2002). This study focuses on pinnipeds in general and
otariids in particular.
The earliest known otariid is Pithanotaria, with remains found from several localities in
California dating from 12-13 million year ago. Pithanotaria was a small animal, 1.5 m in length,
the size of a Galapagos fur seal (Arctocephalus galapagoensis), the smallest living otariid
(Macdonald 2001). Around 8 million years ago there were otariids in the North Pacific that
split the otariids dispersion through southern hemisphere (South America, South Africa, and
Australasia) started. Geological records from 6 million to about 2-3 million years ago showed
limited diversification in this linage which remained similar to the modern southern
hemisphere fur seals Arctocephalus spp. However, in the past two million years, the southern
linage radiated into many species. This radiation was accompanied by a change in body size
and development of singe rooted check teeth (Macdonald 2001).
Today’s marine mammals are a diverse group of more than 120 different species (Martin and
Reeves 2009) that spend the whole or a major part of their life cycle in the water, mainly in
the oceans and open seas. The degree of water dependency varies among members of this
group. Some species, like cetaceans and sirenians, spend all of their life cycle in the water
unable to survive outside water for very long, while others, including members of the families
Otariidae, Odobenidae, and Phocidae, are still dependent on land for part of their life cycle,
mainly breeding. Given the importance of otariids in the current research, the remaining part
of this chapter will focus on this group of pinnipeds.
1.2
Otaridae
Members of the family Otariidae (eared seals, fur seals and sea lions) are discerned from
members of the Phocidae by their external ear pinnae, a fact that gives rise to their common
name “eared seals” (Otariidae means “little ear”). Compared to Phocidae, members of the
Otaridae family have larger fore flippers and smaller hind flippers. They are distributed in both
hemispheres. They are found along the coast of north eastern Asia, western North America,
South America, southern Africa, southern Australia, New Zealand and many, predominantly
southern, oceanic islands (Novak 2003). Otariids have stream-lined, sleek bodies that provide
can move up to a speed of 20 km/h. The strong fore flippers not only support their body mass
on land but also provide them with necessary steering power in the water. They can also easily
scull with the rear end of their body as members of phobias lineage do. To reach higher
speeds, they usually porpoise, projecting themselves in shallow arcs out of the water. (Crawley
1990). Total length in otarriids ranges from 120 to 350 cm and the weight varies between
27-1100 kg (Novak 2003). Extreme sexual dimorphism is obvious in this group of animals, males
are usually much larger than females.
1.3
Fur seals
Fur seals are a group of eared seals, including nine different species belonging to two separate
genera (Crawley 1990). A dense, soft hair under their outer covering of stiff, waterproof hair
led to a specific appearances that give rise to their common name “fur seals”. Eight species of
fur seals belong to the genus Arctocephalus (the generic name means ‘bear head‘ (Berta,
Sumich et al. 2006)) and the one remaining species, to the genus Callorhinus (the generic name
means ‘beautiful nose’ (Berta, Sumich et al. 2006)).
Based on fossil records and anatomical evidence, Repenning (1977) suggests that divergence
between the Callorhincus - Arctocephalus lineages was probably in the late Miocene, whereas
the radiation of sea lions from the Arctocephalus lineage occurred in the late Pliocene or early
Pleistocene.
found in suitable rocky habitat throughout New Zealand, from the Three King’s islands to
Macquarie Island. Even though their distribution is spread over 2700 km their presence has
been reported to be discontinuous and seasonally variable (Singleton , 1972; Csordas et al,
1965, as cited in Crawley 1990).
The botanist George Forster in 1773 was the first scientist to describe “sea bears” in his
account of the second voyage of Cook to New Zealand. A scientific description of this species
was published later in 1828 (Todd 2002). Crawley and Wilson (1976) described the species as
“dark grey-brown in appearance; the coat colour of adults merges from a dark grey-brown
dorsally to a lighter grey-brown ventrally. The thick under fur is a rich chestnut colour; the
guard hairs are coarse and dark grey, often with white tips which impart a silvery sheen to the
dry fur. Sexual dimorphism is obvious in this species with males reaching up to185 kg in weight
and 2.5 m in length, whereas females seldom exceed 50 kg and 1.5 m length” (Crawley and
Warneke 1979).
As in other pinnipeds, New Zealand fur seals are active both day and night and possess acute
vision and good hearing under water (Novak 2003). New Zealand fur seals usually use their
olfactory sense to discern other individual seals (King 1983). The brain size in relation to body
size is similar to terrestrial, non-diving carnivores (Armstrong 1982).
(Miller 1975) observed continuous presence of individual fur seals in a colony throughout the
year. However, the dynamics of the colony in terms of numbers, ages and sex classes differs
substantially between seasons. First to arrive on shore are breeding males. Soon after their
arrival, males establish territories which they might hold for as long as nine weeks. Within a
few weeks pregnant females arrive to give birth to the previous year pups. Although the exact
formation might start in mid-November. Females usually mate with the first male they meet,
which is usually the harem holder of the territory where their last year pup was born (Miller
1975). Mating can take anywhere between 5-38 minutes (Miller, 1974). The whole gestation
period including delayed implementation takes up to a year. At birth, pups (which are usually
a single ) are about 55 cm long and weigh 3.5 kg (Crawley and Wilson 1976).
Male sexual maturity has been reported between 5-9 years (Dickie and Dawson 2006)
although fur seals probably do not form their own harem until they reach age 10 (Mattlin,
1978, as cited in Dickie and Dawson 2006). Female sexual maturity is estimated at between 4
and 6 years of age (Dickie and Dawson 2006).
New Zealand fur seals are among the deepest diving fur seals and have the longest dive
duration (Mattlin, Gales et al. 1998). Maximum dive duration and depth were 9.3 min and 312
m for females and 14.8 min and >380 m in males (Page, McKenzie et al. 2005). New Zealand
fur seals used different habitat as their prime foraging areas. While most of females choose
continental shelf waters, males usually prefer deeper continental shelf breaks or pelagic
waters (Page, McKenzie et al. 2005).
1.3.2 Exploitation history
Pinnipeds have been hunted by humans living in coastal areas for centuries (Todd 2002). Maori
neighbouring islands (Hutton and Drummond 1923). Capitan Cook observed fur seals in New
Zealand only on the coast of the South Island in his first voyage. On his second voyage, “the
first fresh meat eaten by him at Dusky Bay was obtained from the first seal killed there. During
his stay of nearly two months at the southern Sounds, Cook’s crew killed many seals, using the
flesh for food, the skin for repairs to the rigging and the blubber for oil for his lamps” (Hutton
and Drummond 1923).
Small scale commercial sealing began in the New Zealand waters in 1792-3, when around 4500
skins were taken in Dusky Sound. Systematic large scale exploitation probably started in the
early 1800s (Crawley 1990). Commercial hunting was carried out so vigorously that the New
Zealand population came close to extinction in many localities. The actual number of seals
killed and skins taken was never published mainly due to the secrecy of the industry. The
magnitude of the harvest is indicated by official cargo reports, 60,000 skins from the Antipodes
Islands in 1804-1805 and 53 000 in 1906-1907 (Macnab, 1907 , as cited in Crawley 1990) and
a total of more than 180,000 skins from Macquarie Island between 1810-1813 (Csordas, 1958,
as cited in Crawley 1990) show the scale of the hunting.
Hutton and Drummond (1923) wrote “as early as 1810 the effects of reckless slaughter began
to be felt, and it was the discovery of Campbell Island and Macquarie Island in that year which
gave fresh life to the trade “. By the 1830s, the seal population had been eliminated on the
Antipodes and Macquarie Islands, and only a few fragmented populations survived on the
Snares, Bounty, Chatham, Auckland and Campbell Islands (Macnab 1907 , as cited in Crawley
1990).
The eventual poor economics of sealing and an imposition of a system of a closed season and
Campbell Island in 1924-1926, and parts of southern New Zealand in 1946, no killing of fur
seals, other than for scientific proposes, has been allowed over the last hundred years.
Protection is now guaranteed under the New Zealand Protection Act (1978), except in cases
where the Act allows for commercial fisherman to kill seals actually caught in the act of
robbing nets and damaging fishing gear.
The severe decline of the seal population during the last two centuries likely resulted in a
bottleneck that had severe impacts on the genetic diversity of the modern population. Local
populations are likely descended from a few dozen individuals that found refuge in the remote
areas during large-scale harvesting and then recolonized mainland areas.
The current number of New Zealand fur seals is unknown. Barton (1996) estimated the
population size as over 100,000 individuals. Taking an annual 5% increases in population size
in to account (Taylor 1982), the current population is assumed to be about 200,000 individuals
Chapter 2
A research diary of the specimen collection methods
Finding an adequate source of biological sample for DNA-based studies is the first step in
initiating any large scale genetic studies. In this chapter I detail the process by which I tested
collecting methodology to minimise impact on individual seals while maintaining high integrity
of data. ifferent potential sources of biological sample collection from New Zealand fur seals
were evaluated thoroughly. Based on the observed efficiency and disruptiveness (Lefort,
Boyer et al. 2014) of the different methods, the most optimal method was chosen for the rest
of the study.
2.1
Flipper notching
Flipper notching is the method of choice in biological sample collection from pinnipeds
(Worthington Wilmer, Allen et al. 1999, Hoffman and Amos 2005, Robertson and Gemmell
2005, Hoffman, Forcada et al. 2006, de Oliveira, Hoffman et al. 2008). The method involves
the collection of biopsy samples from the inter-digital margin of fore-flippers by restraining
animals, mainly females and pups rather than aggressive males.
In this method, the individual pups to be sampled are chosen based on a strategy that
minimises panicking other pups which could result in injuries. Two trained researchers encircle
the targeted individual. One person captures the seal. While the first person is neutralizing
the animal by slightly pressing against its head and hind flipper(Majluf and Goebel 1992), the
second person performs the biopsy operation and wound disinfection (Figure 2.1).
The success rate of the flipper notched biological samples in this research was extremely high.
No samples failed to provide mitochondrial DNA or zinc finger amplifications, justifying the
collected throughout New Zealand, 100% of them showed enough concentration and
purification for amplification of mitochondrial DNA and Zinc finger. Whether the whole
mitochondrial DNA was considered or a short fragment of the control region no sign of DNA
degradation or external contamination was detected.
Despite being an excellent source of biological sample for DNA studies, this method involved
some minor degrees of damage to the animal physical integrity which could result in external
bleeding. This method is widely used for biological sample collection from suckling pups which
are more vulnerable to excessive bleeding and external stress. To alleviate the potential stress
2.2
Non-invasive methods of DNA collection
Non-invasive tissue sampling for DNA analysis has been used in many conservation genetic
studies, especially on rare and illusive species. Despite being a preferred method for scientists,
the poor quality and low quantity of DNA generally recovered using non-invasive methods has
hampered their large-scale use in studies of wild populations (Taberlet, Waits et al. 1999).
Access to an adequate source of DNA is an important consideration in genomic analysis, which
in turn will considerably facilitate comprehensive study of wild animals (Brooks, Williamson et
al. 2003).
Priority is given to methods of DNA collection that do not jeopardise the physical integrity of
individuals, although some minor disturbance in the behaviour of subject animals is often
unavoidable. There are several non-invasive approaches that have been tested in the current
research to sample DNA.
2.2.1 Buccal Swabs
Despite wide use of saliva as a source of DNA in human studies, its application in wild
populations studies remains scarce (Williams, Blejwas et al. 2003). Saliva as an alternative to
other non-invasive source of DNA (faecal samples, hairs , etc.) would substantially reduce the
effort needed to collect samples in the field (Inoue, Inoue-Murayama et al. 2007). Brooks,
Williamson et al. (2003) first tested saliva as a source of DNA in a comparative genomic study
of non-human mammals, including cows and pigs. Oberbauer, Grossman et al. (2003) used
DNA recovered from saliva in a genome linkage study in canine species, and Meldgaard, Bollen
et al. (2004) successfully PCR-amplified mouse DNA from buccal swabs. In wild populations,
and reptiles (Williams, Blejwas et al. 2003). To test the feasibility of saliva as a source of DNA,
the issue of capturing animals, and then keeping their mouth open long enough to take an
effective sample, needs to be considered, especially for non-domesticated wild animals.
In New Zealand fur seals, capturing seals pups definitely involved some degree of stress and
unease. It is up to the person collecting the buccal swabs to choose the least stressful capture
and handling methods for the target individual. (Pidancier, Miquel et al. 2003) .
Capturing seals pups for this research was not difficult since many pups in the early stages of
their life have not developed a natural fear of humans, and are easily approachable to very
close distances. The rocky nature of their colony facilitated their capture, even when they
were hiding in the spaces between rocks. However, opening the mouth, and keeping it open
during operation, was not a trivial task. To keep the mouth cavity open during swabbing, a
modified smaller version of a Schulze mouth gag (medical-tools. Pakistan) (Figure 2-2) was
designed to fit inside the mouth cavity of a fur seal pup. The gag is placed in the mouth cavity
and a handle on upper part of the gag provides the operator with the necessary grip to keep
the month open.
To test the method, three researchers approached pups cautiously to minimise unnecessary
stress. While the first person had captured the pup and neutralized it with slight pressure
against its neck and hind flipper, the second researcher fitted the mouth gag inside the pup’s
mouth. The third researcher swabbed gently inside the mouth cavity for 30-45 seconds using
The swabs were air-dried for few minutes before putting them into a plastic cover and kept
cold until they could be analysed in the Molecular Ecology Lab at Lincoln University, usually
within few days.
DNA was extracted using a protocol recommended in the manufacturer’s instructions for the
Master Amp DNA extraction kit. The DNA concentration was measured using a Qubit
quantitation kit (Life Technologies, Catalogue number Q33217). A 1kb fragment of the control
region of the mitochondrial genome was amplified (for details of PCR amplification and
thermal cycles see the chapter 4). Amplicons were screened on a 2% agarose gel to assess the
success rate of the process.
2.2.2 Environmental DNA
Humans shed approximately 400,000 skin cells each day, from all parts of the body
(Wickenheiser 2002). Trace amounts of DNA may be deposited on objects coming into contact
with the body. Depending on the nature, frequency, and duration of contact, as much as
several hundred nanograms of DNA can be present on touched objects (Van Oorschot, Weston
et al. 1998, Castella and Mangin 2008, Sewell, Quinones et al. 2008, Raymond, van Oorschot
et al. 2009). Assuming that all mammals shed similar amount of skin cells, and hence DNA, as
humans, the method was evaluated on New Zealand fur seals.
Two different methods for collecting DNA from fur seal habitats were tested: (1) rock surface
swabbing, and (2) tape lifting. In both approaches, an adult animal was chosen based on a
strategy that caused minimal disturbance to the rest of colony. The focal animal was
approached carefully and encouraged to move from their haul-out rock. The surface of the
rock where the seal had been resting was thoroughly swabbed with a slightly wet sterile swab
or, alternatively, a small piece of water-soluble tape was stuck to the surface and then lifted
repeatedly 30-40 times. Swabs and/or tapes were immediately placed inside a sterile vial and
kept cold until DNA could be extracted in the Molecular Ecology Lab at Lincoln University. For
DNA extraction, a Qiagen DNA Investigator extraction kit (Catalogue number 56504) was used,
according to the manufacturer’s instructions. The DNA concentration was measured using a
Ten samples for each different source of DNA were tested. The success rate was different for
different DNA sources. 80% of the buccal swabs gave positive amplicons of the expected size
for this fragment of mitochondrial DNA. The BLAST results matched perfectly with New
Zealand fur seals, or closely related species. Buccal swabs consistently gave a DNA yield of less
than 3 µg, which is consistent with results of (Walker, Najarian et al. 1999). The DNA quantity
from buccal swabs is at least two orders of magnitude less than peripheral blood samples,
which have an mean yield in excess of 100 µg (Walker, Najarian et al. 1999)..
Only one sample from ten rock surface swabs and tape lifts gave a very faint band at the
expected size of approximately 1kb. Despite repeating the amplification several times, the
DNA concentration and/purity was not suitable for Sanger sequencing. None of the BLAST
results matched a mammalian species in their first five hits. Leforte (Lincoln University,
personal communication) introduced the new term “non-disruptive” DNA sampling to
emphasize that it is not only adverse effects of sampling on the physical integrity of an
individual animal that needs to be taken into account, but also fitness and long-term
psychological effects of sample collection should be considered.
The results of this study are a classic example of a situation where a “non-invasive” method is
in fact seriously disruptive to an animal’s psychological condition. Mouth swabbing, despite
being apparently non-invasive, and without any obvious damage to the animals’ physical
integrity, involved substantial amounts of stress for the target individuals. Observations show
that extra sensibility of the nasal area, accompanied by the need to neutralise individuals for
relatively long period of time, are the main factors causing discomfort in the focal individuals.
The swabbing process itself does not seem to disturb the animals significantly as the few
individuals that were easily handled without a need for a mouth gag did not show any signs of
Experience with seal pups has shown that, apart from the capturing of individuals by
researchers itself, the most stressful situation for a pup is probably touching its mouth and
nasal areas, which could provoke a sense of asphyxiation. Based on these results, mouth
swabbing was considered more disruptive than traditional, relatively invasive, flipper
notching. Buccal swabs were not used in the rest of study, although the possibility of saliva as
a source of DNA in other animals (amphibians, birds), with different sensibilities, remains
open.
The reason that environmental DNA was not successful in the current research is yet to be
clarified. Forensic studies have shown that shedding of epithelial cells from human hands is
varies among individuals, with some individuals shedding cells more easily than others (Bright
and Petricevic 2004). Actions such as hand-washing could also decrease the amount of
epithelial cells shed by an individual (Van Oorschot, Weston et al. 1998). It is possible that
dense fur covering the body, along with constant submersion in sea water could have some
impacts on epithelial cell shedding resulting in a low recovery rate.
In conclusion the low amplification success rate, coinciding with highly degraded nature of the
extracted DNA, implied that environmental DNA was not a reliable source for this study.
2.2.3 Dart Biopsy
The remote collection of tissue samples from wild, marine mammals has historically been the
most effective, and least invasive, method of tissue collection for ecological studies (Brown,
A minor degree of disturbance to target individuals is inevitable in most sampling operations.
Caudron (2006) summarised three factors that influence the degree of invasiveness of any
sample collecting operation in wild populations as (1) the duration of sampling, (2) the number
of humans involved in the operation and (3) the sampling distance (i.e. the distance between
a target animal and the person responsible for collecting the biopsy). Although these factors
influence all the individuals in the colony, it is known that different individuals may react
differently to similar environmental stressors (BearzI 2000, Kiszka, Simon-Bouhet et al. 2010).
The eventual response of individuals may depend on individual physiological and
psychological factors (Barrett Lennard, Smith et al. 1996), age and size (Peters 1986, Gauthier
and Sears 1999), gender (Brown, Kraus et al. 1991, Gauthier and Sears 1999), reproductive
and hormonal conditions, illness or concurrent pathologies, behaviour at the time of sampling
(Barrett Lennard, Smith et al. 1996), and previous experience (Barrett Lennard, Smith et al.
1996). Examples of the use of remote biopsies in the studies of wild populations of pinnipeds
are numerous (e.g. Hoberecht, Vos et al. 2006, Hoffman, Forcada et al. 2006, Curtis, Stewart
et al. 2007, Hoffman, Forcada et al. 2007, Hoffman and Forcada 2009, Nino-Torres, Gardner
et al. 2009, Hoffman and Nichols 2011).
Although it is not always necessary to determine the individual from which the biopsy sample
originates, in some studies involving parentage assignment or fine-scale population social
structure, determining the origin of DNA is of pivotal importance (Krützen, Barré et al. 2002).
One method to correctly determine the origin of a DNA sample is to capture target animals
before collecting the sample. Capturing wild animals is always a risky operation for both
humans and animals. Although the development of tranquilizers has facilitated the capture
and handling of target animals, it is still one of the most challenging parts of an ecological
study. The use of tranquilizers needs considerable expertise in both animal anaesthesiology
thermal stress (Gemmell and Majluf 1997). In general, chemical capture and anaesthesia of
wild mammals usually involves some degree of uncertainty regarding the animal’s recovery,
even in healthy individuals. The results of a survey published in the British Journal of
Anaesthesia shows that approximately 0.01-0.05% of deaths in humans, 0.1% in dogs and cats,
and 1% in horses, are directly or indirectly attributable to anaesthesia (Jones 2001). Several
studies show that immobilisation of pinnipeds and other marine and terrestrial mammals,
both with and without anaesthetic, may result in a mortality rate of around 3-20% (Loughlin
and Spraker 1989, Baker, Fedak et al. 1990, Work, DeLong et al. 1993, Heath, Calkins et al.
1996). As an alternative, which allows for high quality tissue samples without the need for
chemical and/or physical immobilisation, a biopsy sample can be obtained by shooting a
biopsy dart projectile with an appropriate propelling device. This method permits selective,
non-destructive sampling of fresh, uncontaminated tissue samples for genetic and
eco-toxicological studies (Gemmell and Majluf 1997).
In the current research the applicability of a new remote biopsy collection system developed
by (Pneu –Dart. Pennsylvania-USA) on New Zealand fur seals was tested. A purpose made DNA
collection dart system was constructed. The dart was a 120mm cylindrical shape projectile
consisting of a 100 mm body and a 20 mm barbed biopsy needle encased within a 25 mm
tubular cutter (Fig 2.3). The barb needle protrudes approximately 4mm from the tip of the
tubular cutter. A X-2 Gauged CO2 Projector pistol (Pneu –Dart. Pennsylvania-USA) was used
to propel the biopsy dart towards the target animals. The biopsy system were tested on four
tip length will cause excessive injury and/or unsuccessful sampling. Gemmell (1997) reported
that careful biopsy sampling should not cause any tissue damage, or bone fracturing or
chipping at the point of impact. Hoberecht (2006), in his study on sea lions, observed a small
circular wound at the point of impact that generally bled for about 10 minutes. After 30-60
minutes it became difficult to discern the dart penetration site from other abrasions on the
animal’s skin. He also reported that the amount of bleeding was affected by the ambient
temperature. Bleeding continues for longer on hot sunny days compared to cold rainy days.
Another cause of concern is the complication of the wound healing process in sea water. This
mysterious and rapid process in marine mammals has attracted a considerable amount of
attention (e.g. WÜRsig and WÜRsig 1977, Bertilsson‐Friedman 2006, Van Den Hoff and
Morrice 2008). Marine mammals are prone to many different causes of skin trauma in their
daily life. Territorial disputes, the rocky nature of their habitat, and living in a challenging
environment with regular encounters with carnivorous predators, leave their mark on an
animal’s body. For example, one study in Monteron Bay showed that 36% of dolphins bear
the scars of an encounter with sharks (Corkeron, Morris et al. 1987). Surprisingly, most of
these wounds heal very quickly. Wursig (1977) reported that pigment spots and bite marks
made by conspecific bottlenose dolphins disappeared in less than one year. Another study
showed that dart wounds on dolphins normally heal in less than two months (Krützen, Barré
et al. 2002). Efficient healing of soft tissue trauma in marine mammals is further evidenced by
the survival of southern elephant seals (Van Den Hoff and Morrice 2008) and Hawaiian monk
of sea water causes the formation of a buffer layer of degenerating cells that prevents the
trauma from spreading to the deeper tissues. Corkeron (1987) also proposed that constant
and gentle irrigation of the wound by sea water will facilitate the wound healing process.
Another important aspect of wound healing in marine mammals is the biochemical structure
of blubber tissue. Blubber accumulates many toxic materials of anthropogenic origin, such as
organohalogenes and heavy metals from their food resource. In addition to these pollutant
organohalogenes, blubber can also accumulate organohalogenes of natural origin (Vetter,
Scholz et al. 2001, Vetter and Jun 2003, Vetter, Jun et al. 2003). Although the origins of these
non-human derived organohalogene compounds are unknown, several similar substances are
produced by marine organisms such as algae and plankton (Gribble 2003). These
organohalogenes are known to have antimicrobial properties, such as inhibition of biofilm
formation (Janssens, Steenackers et al. 2008), and antibiotic activity (Ezaki, Koyama et al.
1983). The extent to which these substances are released in damaged blubber tissue and help
to prevent the spread of wounds to the adjacent tissues, interfering in the wound healing
process, is yet to be studied (Zasloff 2011). In conclusion, the complication of the biopsy
wound seems a very remote possibility.
Remote biopsy however appears to involve some degree of unease and pain in target
individuals. Gemmell (1997) observed that South American fur seals recoiled from the impact
of the dart biopsy and searched briefly for the assailant, which indicates the painfulness of
dart penetration. The sea lion, with its larger body size, also turned in the direction of the dart
and escaped to sea (Hoberecht, Vos et al. 2006). It does not seem that this brief, painful
experience has any long-term impact on animal behaviour. At least in the latter study, the sea
lion returned to land in less than five minutes. Krutzen (2002), in a study on dolphins, observed
that dolphins reacted equally to being hit or missed by a dart. It was probably a sudden
to have less impact. He also observed that target animals did not change their long-term
behaviour towards humans because they were still easily approachable by researchers.
It is suggested that, at least with regards to male New Zealand fur seals, that the relatively
invasive remote collection method is less disruptive that all other methods involving the live
capture and anaesthesia of animals. Individuals do not have to tolerate stressful physical
restraint and the disturbance in the colony is minimal. Using advanced propellers and retriever
systems, individual may be targeted from a safe, for both seal and researcher, distance.
Targeted individuals are usually mature males that are used to wounds and bruises in their life
cycle. When the method is compared to the flipper notching of young pups in early month of
their life the advantages of taking biopsy from adult males is more obvious. The blubber tissue
collected using this method is also suitable for other studies, such as food web dynamics using
radioactive isotopes which traditionally required capture and anaesthesia of target
individuals.
Respecting the sensibilities of the public opinions, which understandably oppose the shooting
of the New Zealand fur seals even by a dart gun, and after a thorough and detailed
consultations with New Zealand Department of Conservation, it was decided to choose the
seal pups flipper notching method for the rest of the this research. However, the application
of this methods in future studies after answering public concerns remain a feasible
Chapter 3
New Zealand fur seal population genetics using complete
mitochondrial DNA and evidence for X to Y gene conversion
Summary
New Zealand fur seals are one of the many pinniped species that have passed through a
population bottleneck due to historical commercial sealing. Investigating sex-specific
demographic dynamics during and after a population bottleneck requires reconstructing
population dynamic history using genetic markers with different inheritance patterns. I
reconstructed the demographic history of New Zealand fur seals in a Bayesian framework
using maternally inherited whole mitochondrial DNA sequences and sequences from an intron
of the male-specific zinc-finger Y chromosomal protein gene (ZFY). Both mitogenomic and Y
chromosomal data suggest the presence of two separate population refuges for New Zealand
fur seals surviving large-scale human harvest.
Approximate Bayesian Computation (ABC) analysis of the New Zealand fur seal mitogenome
strongly supports the hypothesis of a population bottleneck around 35 generations ago,
coinciding with the peak of commercial sealing in the Southern hemisphere. There appears to
have been a catastrophic decline in effective population size of the New Zealand fur seal to
approximately less than 1% of its historical size during the commercial sealing period.
Mitogenomic data are consistent with a pristine effective population size of 62700 that first
declined to 20600 after the establishment of Polynesian populations into New Zealand and
then dropped to an extreme low of 95 breeding individuals during commercial sealing.
Y chromosome data identify more subtle population demographic dynamics. The ZFY data are
Y chromosome with its X chromosome counterpart. The ZFY region of the Y chromosome is
situated outside the pseudo autosomal region. Chromosomal rearrangement in this region is
rare and might indicate an adaptive mechanism to counteract gradual degeneration of the Y
chromosome due to a high mutation rate.
3.1
Introduction
The study of genetic variability is of great relevance in conservation ecology and evolutionary
biology (Lehman 1998, Hoelzel, Fleischer et al. 2002, Valqui, Hartl et al. 2010). Genetic
diversity provides natural selection with the necessary variation to act on populations.
Individual fitness and population viability are equally influenced by genetic variation.
Natural populations can pass through episodes of substantially low densities, often termed
‘bottlenecks’, due to a variety of natural and human-influenced factors. These episodes of
population bottlenecks usually result in the reduction of effective population size (Wright
1938), loss of heterozygosity (Nei, Maruyama et al. 1975), loss of alleles (Maruyama and Fuerst
1985), and greater frequency of linkage disequilibrium (Hartl and Clark 1997). Populations that
pass through population bottlenecks are more prone to developmental instability, decline in
competitiveness, loss of disease and/or parasite resistance, and a reduced survival rate
(Hoelzel, Fleischer et al. 2002). Genetic drift can further threaten the viability of these small
populations, not only by random elimination of whatever diversity has been left, but also by
acting as the predominant mode of evolution, replacing natural selection (Lacy 1997). There
Burger and Lynch (1995) reported that fluctuation in genetic variation in small populations is
of sufficient magnitude to limit adaptations of these populations to changing environments,
and eventually causes extinction. Larger populations are more resilient to environmental
stochastisity. Each case of extinction is an instance of a population failing to adapt rapidly
enough to natural, or human-induced, environmental changes (Lacy 1997). Spielman, Brook
et al. (2004), in a meta-analysis of many different taxa, found that genetic diversity is on
average 35% lower in endangered species compared to non-endangered organisms.
The impact of bottlenecks on genetic diversity depends mainly on demographic factors. The
effects of a severe bottleneck may be minimized if recovery is rapid (Nei, Maruyama et al.
1975, Miller and Hedrick 2001) and in some cases, a bottleneck can even be beneficial in
purging deleterious alleles from populations (Weber, Stewart et al. 2004).
The role of genetic variation in species viability is the subject of contentious debate. Decline
in genetic variation may have negative impacts on mate acquisition, infant mortality,
resistance to disease , physiological responses to stress, social dominance, longevity, and
other components of fitness in wild populations (Lacy 1997). Packer, Pusey et al. (1991) found
that, in an isolated population of African lions (Panthera leo) that had passed through a recent
population bottleneck of no more than 10 individuals in the Ngorongoro Crater of Tanzania,
the frequency of sperm abnormalities was higher and sperm motilities were lower, than in the
neighbouring large populations of the Serengeti. Asian lions (Panthera leo persica) reduced to
a single population in the Gir forest in western India displayed a similarly low degree of genetic
variation, low sperm counts, and an exceptionally high rate of spermatozoa deformity (Obrien,
Despite the essential role of genetic diversity in species’ evolutionary potentials there are
several examples of animals with low levels of genetic variation that survive well, at least in
short term, in nature (Simberloff 1988, Caro and Laurenson 1994). Northern elephant seals
(Mirounga angustirostris) are recovering rapidly to very large numbers despite experiencing a
severe population bottleneck size of an estimated 10-30 individuals (Hoelzel, Halley et al.
1993). African cheetahs (Acinonyx jubatus) have survived even with a low level of genetic
variation due to several population bottlenecks in the past (O'brien, Wildt et al. 1983, O'brien,
Roelke et al. 1985, Obrien 1994).
Pinnipeds are a group of animals whose genetic diversity is of pivotal importance for their long
term survival (Hoffman, Matson et al. 2006). The 2008 IUCN (International Union for
Conservation of Nature) review of the status of the mammals of the world classified pinnipeds,
alongside other marine mammals, as disproportionately threatened and of particular concern.
One in three species of pinnipeds is considered threatened compared to one in five species
for other mammals (Kovacs, Aguilar et al. 2012). The long history of commercial harvesting in
the 18th and 19th centuries pushed many pinniped species out of their historical ranges and
decreased their population densities close to extinction. The remaining populations were
highly fragmented, and reduced in their distribution range, with subsequent reductions in
genetic diversity (Weber, Stewart et al. 2000, Wynen, Goldsworthy et al. 2000, Pastor, Garza
et al. 2004, Schultz, Baker et al. 2009). All extant fur seal and sea lion species have survived
population bottlenecks, with different degrees of severity (Reeves, Stewart et al. 1992,
reported a similar trend between life-time success and heterozygosity in long-fin pilot whales
(Globicephala melas) and grey seals (Halichoerus grypus). Acevedo-Whitehouse, Gulland et al.
(2003) showed that California sea lions (Zalophus californianus) stranded due to illness had
less genetic diversity than control animals stranded due to trauma. Similarly, Bean, Amos et
al. (2004) demonstrated a higher genetic diversity in healthy versus dead grey seals pups. A
strong correlation between genetic diversity and fitness has also been suggested for harp seals
(Pagophilus groenlandicus) (Kretzmann, Mentzer et al. 2006) and bottle nose dolphins
(Tursiops sp.) in Shark Bay Australia (Frère, Krützen et al. 2010).
New Zealand fur seals (Arctocephalus forsteri) survived commercial sealing of the 18th and
19th centuries in dramatically reduced populations probably in a few remote refuges. The
reduction in population size resulted in a considerable loss of genetic diversity in the species
(Lento, Mattlin et al. 1994). Fur seal populations in many southern areas may all descend from
small groups that survived the massive human harvest in regional refuges.
Since the enforcement of a series of protective measures in the early 20th century inhibiting
commercial sealing, the population of New Zealand fur seal seals has recovered rapidly from
the brink of extinction (Taylor 1982, Dix 1993, Lalas and Harcourt 1995, Taylor, Barton et al.
1995, Bradshaw, Lalas et al. 2000). Taylor (1982) estimated that the New Zealand fur seal
population was growing at least 2% per year in the 1980s and this may have reached 5% in
the Bounty Islands, and possibly elsewhere. Assuming a steady increase of 5% per year, the
current estimate for the New Zealand fur seal population in 2015 is around 200,000 (Laura
Boren, Department of Conservation, personal communication). It is believed that the current
population size is still considerably smaller than it was before humans arrived in New Zealand,