Factors Associated With Early Adiposity Rebound
Ahmad R. Dorosty, BSc, MSc*; Pauline M. Emmett, BSc, SRD‡; Imogen S. Cowin, BSc‡;
John J. Reilly, BSc, PhD*; and the ALSPAC Study Team
ABSTRACT. Objective. The age at which body mass index (BMI) increases after its nadir in childhood, adi-posity rebound (AR), is a critical period for the develop-ment of obesity. Children with early AR are at substan-tially increased risk of adult obesity. Few studies have examined the factors that influence the timing of the AR. The aims of this study were to test for influences on the timing of the AR, and to test the hypothesis that early AR is promoted by high-protein intake.
Design and Participants. Longitudinal cohort study of 889 children representative of the United Kingdom, followed from birth to 5 years.
Main Outcome Measures. We tested for differences in dietary intake, parental BMI, socioeconomic status, and childhood BMI between 3 groups of children character-ized by the following: very early AR (at or before 43 months), early AR (from 49 but before 61 months), and later AR (after 61 months).
Results. There was no evidence of associations be-tween dietary protein intake, or any other dietary vari-able, and timing of the AR. Children with very early AR and early AR had parents with significantly higher BMI, and were significantly more likely to have at least 1 obese parent.
Conclusion. This study does not support the hypoth-esis that early AR is promoted by high-protein intake. None of the dietary variables tested were significantly associated with timing of the AR, and timing of AR was not associated with socioeconomic status. Parental obe-sity was associated with an earlier AR. Pediatrics 2000; 105:1115–1118;obesity, child, body mass index, macronu-trients, adiposity rebound.
ABBREVIATIONS. AR, adiposity rebound; BMI, body mass index; ALSPAC, Avon Longitudinal Study of Pregnancy and Childhood; UK, United Kingdom; SDS, standard deviation score; ANOVA, analysis of variance.
T
here is now considerable evidence that
adipos-ity rebound (AR), the point at which the body
mass index (BMI) increases after its nadir in
childhood, is a critical period for the development of
obesity.
1An early AR (younger age at onset of AR) is
associated with higher BMI in adolescence and
young adulthood,
2– 4and substantially increased risk
of adult obesity, as defined by BMI.
5At present, the factors that influence the timing of
the AR are unclear, and research aimed at identifying
these is indicated.
5An understanding of which
fac-tors influence the timing of AR might facilitate
obe-sity prevention, and might also identify important
mechanisms of energy balance regulation. In a small
study of French children (n
⫽
112) higher protein
intake at age 2 years was associated with earlier AR,
6and it was suggested that the association was causal.
The primary aim of the present study was to test this
hypothesis using a larger sample of children. A
sec-ondary aim was to assess the influence of a number
of other factors on timing of the AR in a large-scale
prospective cohort study, the Avon Longitudinal
Study of Pregnancy and Childhood (ALSPAC
7).
METHODS Subjects
ALSPAC is a prospective cohort study of the determinants of health during childhood in the Bristol-Avon area of the United King-dom (UK).7The cohort has been described in detail elsewhere7,8and
is broadly representative of the UK population in terms of socioeco-nomic status, although with a slight underrepresentation of ethnic minority families, and slight overrepresentation of wealthier fami-lies.8Summary anthropometric measurements of the cohort from
infancy and early childhood did not differ significantly from UK reference data,9and in fact were almost identical to these data.8
Subjects used in the analyses for the present study represented a 10% subsample of the cohort, randomly selected for more detailed inves-tigations. These children (n⫽889) were born in 1991 and 1992 and are representative of the entire cohort.7,8Measurements on this
sub-sample were made at frequent intervals: birth, 4, 8, 12, 18, 24, 31, 37, 43, 49, and 61 months.
Childhood Measurements
Height, Weight, BMI, and AR
At each measurement occasion up to 24 months, length was measured to 0.1 cm using the Harpenden Neonatometer and Holtain Kiddimetre (Holtain, Dyfed, Wales). From 24 months height was measured to 0.1 cm using the Leicester Height Measure (Cranlea, Birmingham, United Kingdom). Weight was measured to 0.1 kg at each measurement occasion in underwear using SECA scales (SECA Ltd, London, United Kingdom). BMI was then cal-culated for each measurement period.
Timing of AR was assessed, as a categorical variable, by visual inspection, using the method previously described.2,3This involved
identifying an upward trend in BMI after its nadir. To identify that such a trend had occurred (and to distinguish it from random fluc-tuation and measurement error) it was necessary to: 1) specify that all consecutive measurements of BMI after the nadir showed an in-crease, and 2) require that any increase in BMI after the nadir had to equal or exceed 0.1 kg/m2. In fact, changes in BMI between
measure-ments of such a small magnitude around the time of AR were rare, but this additional criterion was included to reduce any subjectivity in the assessment and to avoid basing judgements on changes in BMI which were within the limits of measurement error. This definition of rebound was therefore slightly more conservative than the defini-tions in the literature on which it was based.2,3We established that
our definition was the same as that of the literature method on which
From the *University of Glasgow Department of Human Nutrition, Yorkhill Hospitals, Glasgow, Scotland; and the ‡Unit of Paediatric and Perinatal Epidemiology, Institute of Child Health, University of Bristol, Bristol, United Kingdom.
Received for publication Apr 6, 1999; accepted Sep 8, 1999.
it was based by consulting the principal author of the original report2
and conferring over the BMI versus age plot for 9 children who comprised a wide range in timing of AR. This procedure confirmed that our methods for assessing the timing of AR produced the same conclusions.
The BMI was expressed as a standard deviation score (SDS), also known as theZscore, relative to contemporary UK reference data9(Child Growth Foundation Software, London, UK).
Dietary and Nutrient Intake
Dietary intake data were obtained in all children by 3-day prospectively collected household measures records at ages 8 and 18 months. To replicate the earlier study6 presentation of the
analysis is confined here to the dietary data at 18 months, al-though conclusions did not differ when dietary data were ana-lyzed at the other time period. From these records we calculated absolute intake of energy and macronutrients, energy intake per kg body mass, and macronutrient intake as a percentage of dietary energy intake using the most recent computerized version of McCance and Widdowson’sThe Composition of Foods(Royal Soci-ety of Chemistry, Cambridge, UK).
Parental Information
Parental heights (to 1 cm) and weights (to 0.5 kg, pregravid weight of mothers) were obtained by self-report.7Socioeconomic
status (social class category) was determined in the standard way10
from the occupation of the mother’s partner. Educational attain-ment of the mother was obtained by self-report and summarized in 5 categories from lowest (category A) to highest (category E). These 5 categories were as follows: A, Statutory school attendance to age 16 years, with no formal qualifications attained; B, Attain-ment of technical or vocational qualifications by age 16 years; C, Attainment of at least 1 pass in academic examinations taken at age 16; D, Attainment of academic examinations taken at age 18; and E, Attainment of university degree.
Statistical Analysis
The aim of the analysis was to test for differences between chil-dren with earlier AR and the rest, using timing of the AR as a categorical variable. Very early AR was defined here as at or before 43 months; early AR from 49 but before 61 months; and later AR after 61 months. Although these definitions were somewhat arbitrary, we confirmed that our results were not a function of the precise catego-ries chosen by repeating the analyses with different combinations of categories to represent different timing of AR. Differences between categories distinguished based on continuous variables were tested for significance using 1-way analysis of variance (ANOVA) with follow-up multiple comparisons incorporating Bonferroni correc-tions as appropriate. Differences for categorical variables were tested for significance using2tests.
RESULTS
Dietary and Nutrient Intake at 18 Months of Age
Dietary and nutrient intakes at age 18 months,
avail-able for 772 of the 889 subjects, are given in relation to
timing of the AR in Tables 1 (absolute intakes) and 2
(relative intakes). There was no evidence of differences
in dietary intake associated with timing of the AR.
There was no evidence of any association between
protein intake and timing of the AR.
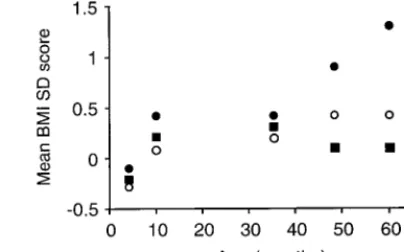
Childhood BMI
There was no evidence of differences in absolute
BMI between those with very early or early AR and
the rest at any age before 4 years (ie, before the
rebound). There was some evidence that girls with
very early rebound had higher BMI SDS before the
rebound than the rest. After the rebound had
oc-curred BMI SDS and absolute BMI were significantly
higher in those children who had rebounded very
early (1-way ANOVA;
P
⬍
.001; Fig 1).
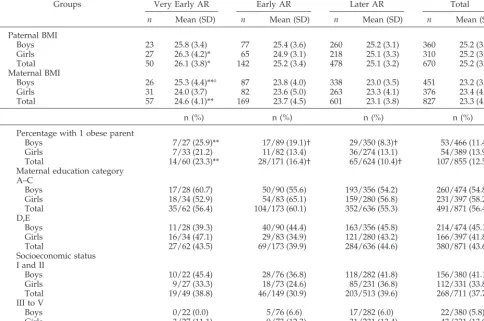
Parental BMI
Mean BMI of parents was significantly higher in
those children with very early rebound (Table 3).
Having at least 1 obese parent (defined as BMI
ⱖ
30.0) was also significantly associated with both
very early and early AR.
Parental Education and Socioeconomic Status
There was no evidence of any associations
be-tween parental educational attainment or
socioeco-nomic status, and timing of the AR (Table 3).
DISCUSSION
There is currently considerable interest in critical
periods for obesity development
1because these
might offer opportunities for obesity prevention, and
a way of understanding the mechanisms by which
energy balance is regulated. Although the AR
con-stitutes only 1 of 3 such critical periods,
1the timing of
the AR does have a significant influence on BMI in
adolescence and adulthood, and risk of adult obesity
as defined by BMI.
2–5Rolland-Cachera et al
6found
that an early AR was associated with high-protein
intake, and speculated that this relationship was
causal.
11This was based on a relatively small study
(112 subjects) and the authors concluded that their
findings should be confirmed by other studies. To
our knowledge, the present study is the only attempt
to replicate that of Rolland-Cachera et al.
6The
TABLE 1. Absolute Dietary and Nutrient Intake at 18 Months in Relation to Timing of AR, Mean (SD)
Absolute Intake n Protein (g/d) Fat (g/d) Carbohydrate (g/d) Energy (KJ/kg/d) Energy (KJ/d)
Boys
Very early 25 43.7 (9.5) 50.2 (10.9) 145.5 (34.1) 422.0 (105.5) 5059 (999)
Early 85 42.4 (10.0) 48.7 (10.2) 142.5 (23.9) 418.7 (71.2) 4932 (749)
Later 322 42.3 (10.4) 47.6 (11.9) 140.0 (28.8) 417.8 (85.0) 4845 (928)
Total 432 42.4 (10.2) 47.9 (11.5) 140.8 (28.2) 417.8 (83.7) 4874 (900)
Girls
Very early 28 40.0 (9.2) 43.6 (10.2) 138.6 (29.5) 407.4 (76.6) 4633 (811)
Early 71 40.1 (9.7) 45.1 (10.8) 128.5 (28.1) 418.3 (77.9) 4526 (807)
Later 241 39.8 (9.9) 45.5 (12.5) 131.0 (24.4) 414.9 (95.0) 4575 (995)
Total 340 39.9 (9.8) 45.3 (11.9) 131.1 (29.1) 414.9 (90.0) 4569 (943)
Total
Very early 53 41.7 (9.5) 46.7 (11.0) 141.9 (31.6) 414.1 (90.4) 4834 (921)
Early 156 41.3 (9.9) 47.1 (10.6) 136.2 (26.7) 418.7 (74.1) 4747 (800)
Later 563 41.2 (10.2) 46.7 (12.2) 136.2 (29.4) 416.6 (89.6) 4729 (966)
Total 772 41.3 (10.1) 46.8 (11.8) 136.5 (29.0) 416.6 (86.7) 4740 (931)
No differences reached statistical significance.
present study was a large-scale, prospective test of
the hypothesis that higher protein intake promotes
earlier AR. We found no evidence to support this
hypothesis, although group mean values for the
per-centage of energy from protein (Table 2) were not
quite as high as those of the children who
experi-enced early AR in the Rolland-Cachera study.
6In
fact, there was no clear evidence that any of the
dietary variables were related to timing of the AR
(Tables 1 and 2). This result, like the others reported
in the present study, was independent of the
catego-ries chosen to represent differences in timing of the
AR: our conclusions were not altered when different
combinations of categories were chosen to represent
differences in timing of the AR.
A number of possible mechanisms of early AR
have been proposed. These include parental control
over feeding in early childhood, which can be
coun-terproductive and lead to impaired ability to regulate
energy intake.
12Although we did not test this
hy-pothesis directly, there was no evidence of any
asso-ciation between energy intake and timing of the AR
in this study. It has been suggested that early AR
might be associated with gestational diabetes,
13and
might be a marker for early maturation
1,14but we did
not measure these variables. Our evidence of no
association between socioeconomic status and timing
of the AR is consistent with one recent European
study
15and is potentially important given current
concerns over the interrelationships between
socio-economic status and obesity.
There were significant associations between
paren-tal BMI, parenparen-tal obesity (defined as BMI
ⱖ
30.0), and
earlier AR (Table 3), and, indeed, these were the only
variables we tested that were positively and
signifi-cantly associated with earlier AR. This observation
provides further emphasis that the child of obese
parents could be a useful target for obesity
preven-tion efforts. However, it should be noted that
paren-tal BMI was less confidently measured than the other
variables because it was based on self-report.
Self-reports of height, and to a greater extent weight, are
subject to small but significant biases.
16It is also
worth noting that the effect of timing of AR on risk of
adult obesity is independent of parental obesity.
5The present study was considerably larger than
previous investigations of the causes/correlates of
early AR. Children who had very early AR in our
study were present in relatively large numbers,
and they experienced AR around 2 years earlier
than mean values from studies in the literature
(mean values of AR typically 5–7 years;
2–5). This
might, in part, reflect a secular trend to earlier AR
9:
previous studies were conducted on cohorts that
experienced AR
⬎
20 to 30 years ago;
2–5our cohort
experienced AR in the mid-1990s and AR occurs
earlier now than in the past.
9Therefore, it seems
likely that children in our category of very early
AR were unusual at least in the sense that their AR
occurred early relative to that of their peers, but
even in this group there was little evidence of
differences in the variables measured, with the
exception of parental obesity. It is conceivable that
genetic factors might be important in influencing
timing of the AR,
1but the relative importance of
genotype and environment on the AR remain
un-clear.
5The secular trend to earlier AR
9suggests
that there are strong environmental influences on
the timing of the AR.
CONCLUSION
In summary, the present study suggests that dietary
energy and macronutrient intakes are not associated
with timing of the AR. In particular, there was no
evidence that higher protein intake was associated with
early AR. Timing of AR was not associated with
socio-economic status. The only factor significantly
associ-ated with timing of the AR in the present study was
parental BMI. Children of parents with high BMI, or
with at least 1 obese parent, were significantly more
likely to have an earlier AR. Parental obesity is a
well-established risk factor for obesity
17and the present
study suggests that it may operate, at least in part, via
an influence on the timing of the AR. In the absence of
any other markers of early AR, the factors currently
known to be associated with obesity risk, including age
and parental obesity,
16inactivity/watching television,
18and preschool activity
19should continue to be used as
the principal targets of obesity prevention measures in
children.
TABLE 2. Macronutrient Intake as Percentage of Dietary En-ergy Intake at 18 Months in Relation to Timing of AR, Mean (SD)
Relative Intakes n Protein Fat Carbohydrate
Boys
Very early 25 14.5 (2.2) 37.4 (3.6) 48.1 (5.0) Early 85 14.4 (2.4) 37.1 (4.2) 48.6 (5.2) Later 322 14.6 (2.2) 36.8 (4.9) 48.6 (5.7) Total 432 14.6 (2.2) 36.9 (4.6) 48.5 (5.6) Girls
Very early 28 14.4 (1.7) 35.4 (5.8) 50.2 (6.3) Early 71 14.8 (2.3) 37.5 (5.5) 47.6 (6.4) Later 241 14.6 (2.2) 37.2 (4.4) 48.2 (5.2) Total 340 14.6 (2.2) 37.1 (4.8) 48.2 (5.6) Total
Very early 53 14.5 (1.9) 36.3 (4.9) 49.2 (5.8) Early 156 14.6 (2.4) 37.3 (4.8) 48.1 (5.8) Later 563 14.6 (2.2) 37.0 (4.7) 48.4 (5.5) Total 772 14.6 (2.2) 37.0 (4.7) 48.4 (5.6)
No differences reached statistical significance.
Fig 1. Mean BMI SDS (Zscore) in children characterized by very
ACKNOWLEDGMENTS
ALSPAC was supported by the Wellcome Trust, Department of Health, Ministry of Agriculture Fisheries and Food, Medical Re-search Council, British Gas, and other companies.
Ahmad Dorosty was supported by the Iranian Ministry of Health and Medical Education.
We thank all of the parents and children who took part in the study, and the ALSPAC Study Team, which consists of inter-viewers, technicians, clerical workers, scientists, volunteers, and managers.
In addition, we thank Dr Marie Francoise Rolland-Cachera for her help and advice on the methodology for defining timing of the AR. We also thank Dr Jan Love of the Robertson Center for Biostatistics for statistical advice, and the Child Growth Foundation, London, for providing the growth monitoring equipment.
REFERENCES
1. Dietz WH. Periods of risk in childhood for the development of adult obesity—what do we need to learn?J Nutr.1997;127:1884S –1886S 2. Rolland-Cachera MF, Sempe M, Guillard-Bataille M. Adiposity rebound
in children: a simple indicator for predicting obesity.Am J Clin Nutr.
1984;39:129 –135
3. Prokopec M, Bellisle F. Adiposity in Czech children from 1 month of age to adulthood.Ann Hum Biol.1993;30:517–525
4. Siervogel RM, Roche AF, Guo S, et al. Patterns of change in weight2/
stature from 2–18 years.Int J Obes.1991;15:479 – 485
5. Whitaker RC, Pepe MS, Wright JA, et al. Early adiposity rebound and risk of adult obesity. Pediatrics. 1998;101(3). URL: http:// www.pediatrics.org/cgi/content/full/101/3/e5
6. Rolland-Cachera MF, Deheeger M, Akrout M, Bellisle F. Influence of macronutrients on adiposity development.Int J Obes.1995;19:573–578 7. Golding J and the ALSPAC Study Team. Children of the nineties: a
resource for assessing the magnitude of long term effects of prenatal and perinatal events.Contemp Rev Obstet Gynecol.1996;8:89 –91 8. ALSPAC. Children of the nineties. Available at: http://alspac2.
ich.bris.ac.uk/ALSPACext
9. Cole TJ, Freeman JV, Preece MA. Body mass index reference curves for the UK, 1990.Arch Dis Child1995;73:25–29
10. Office of Population Censuses and Surveys.Standard Occupation Classi-fication. 1st ed. London, United Kingdom: Her Majesty’s Stationery Office; 1990
11. Rolland Cachera MF, Deheeger M, Bellisle F. Nutrient balance and body composition.Reprod Nutr Dev.1997;37:727–734
12. Johnson SL, Birch LL. Parents’ and childrens’ adiposity and eating style.
Pediatrics.1994;94:653– 661
13. Silverman BL, Landsberg L, Metzger BE. Fetal hyperinsulinism in offspring of diabetic mothers: association with the subsequent de-velopment of childhood obesity.Ann N Y Acad Sci.1993;699:36 – 45 14. Rolland-Cachera MF, Deheeger M, Guilloud-Battsaile M. Tracking the
development of adiposity from 1 month of age to adulthood.Ann Hum Biol.1987;14:219 –229
15. De Spiegelaare M, Dramaix M, Hernart P. Socio-economic status and changes in body mass from 3–5 years.Arch Dis Child1998;78: 477– 478
16. Rowland ML. Self reported weight and height.Am J Clin Nutr.1990;52: 1125–1133
17. Whitaker RC, Wright JA, Pepe MS, Seidel KD, Dietz WH. Predicting obesity in young adulthood from childhood and parental obesity.
N Engl J Med.1997;337:869 – 873
18. Gortmaker SL, Must A, Sobol AM, et al. Television viewing as a cause of increasing obesity among children in the United States.Arch Pediatr Adolesc Med.1996;150:3546 –362
19. Moore LL, Uyen-Sa DTN, Rothman KJ, Cupples LA, Ellison RC. Pre-school physical activity level and change in body fatness in young children.Am J Epidemiol.1995;142:982–988
TABLE 3. Parental Characteristics in Relation to Timing of AR
Groups Very Early AR Early AR Later AR Total
n Mean (SD) n Mean (SD) n Mean (SD) n Mean (SD)
Paternal BMI
Boys 23 25.8 (3.4) 77 25.4 (3.6) 260 25.2 (3.1) 360 25.2 (3.2)
Girls 27 26.3 (4.2)* 65 24.9 (3.1) 218 25.1 (3.3) 310 25.2 (3.3)
Total 50 26.1 (3.8)* 142 25.2 (3.4) 478 25.1 (3.2) 670 25.2 (3.3)
Maternal BMI
Boys 26 25.3 (4.4)**¤ 87 23.8 (4.0) 338 23.0 (3.5) 451 23.2 (3.7)
Girls 31 24.0 (3.7) 82 23.6 (5.0) 263 23.3 (4.1) 376 23.4 (4.3)
Total 57 24.6 (4.1)** 169 23.7 (4.5) 601 23.1 (3.8) 827 23.3 (4.0)
n (%) n (%) n (%) n (%)
Percentage with 1 obese parent
Boys 7/27 (25.9)** 17/89 (19.1)† 29/350 (8.3)† 53/466 (11.4)
Girls 7/33 (21.2) 11/82 (13.4) 36/274 (13.1) 54/389 (13.9)
Total 14/60 (23.3)** 28/171 (16.4)† 65/624 (10.4)† 107/855 (12.5)
Maternal education category A–C
Boys 17/28 (60.7) 50/90 (55.6) 193/356 (54.2) 260/474 (54.8)
Girls 18/34 (52.9) 54/83 (65.1) 159/280 (56.8) 231/397 (58.2)
Total 35/62 (56.4) 104/173 (60.1) 352/636 (55.3) 491/871 (56.4)
D,E
Boys 11/28 (39.3) 40/90 (44.4) 163/356 (45.8) 214/474 (45.1)
Girls 16/34 (47.1) 29/83 (34.9) 121/280 (43.2) 166/397 (41.8)
Total 27/62 (43.5) 69/173 (39.9) 284/636 (44.6) 380/871 (43.6)
Socioeconomic status I and II
Boys 10/22 (45.4) 28/76 (36.8) 118/282 (41.8) 156/380 (41.1)
Girls 9/27 (33.3) 18/73 (24.6) 85/231 (36.8) 112/331 (33.8)
Total 19/49 (38.8) 46/149 (30.9) 203/513 (39.6) 268/711 (37.7)
III to V
Boys 0/22 (0.0) 5/76 (6.6) 17/282 (6.0) 22/380 (5.8)
Girls 3/27 (11.1) 9/73 (12.3) 31/231 (13.4) 43/331 (13.0)
Total 3/49 (6.1) 14/149 (9.4) 48/513 (9.4) 65/711 (9.1)
Significant differences between very early AR group and the rest at *P⬍.05, **P⬍.01. † Significant difference between later AR group and early AR group,P⬍.05.
Parental obesity defined as BMIⱖ30.0.
DOI: 10.1542/peds.105.5.1115
2000;105;1115
Pediatrics
the ALSPAC Study Team
Ahmad R. Dorosty, Pauline M. Emmett, SRD?; Imogen S. Cowin, John J. Reilly and
Factors Associated With Early Adiposity Rebound
Services
Updated Information &
http://pediatrics.aappublications.org/content/105/5/1115
including high resolution figures, can be found at:
References
http://pediatrics.aappublications.org/content/105/5/1115#BIBL
This article cites 16 articles, 5 of which you can access for free at:
Subspecialty Collections
http://www.aappublications.org/cgi/collection/obesity_new_sub
Obesity
http://www.aappublications.org/cgi/collection/endocrinology_sub
Endocrinology
following collection(s):
This article, along with others on similar topics, appears in the
Permissions & Licensing
http://www.aappublications.org/site/misc/Permissions.xhtml
in its entirety can be found online at:
Information about reproducing this article in parts (figures, tables) or
Reprints
http://www.aappublications.org/site/misc/reprints.xhtml
DOI: 10.1542/peds.105.5.1115
2000;105;1115
Pediatrics
the ALSPAC Study Team
Ahmad R. Dorosty, Pauline M. Emmett, SRD?; Imogen S. Cowin, John J. Reilly and
Factors Associated With Early Adiposity Rebound
http://pediatrics.aappublications.org/content/105/5/1115
located on the World Wide Web at:
The online version of this article, along with updated information and services, is
by the American Academy of Pediatrics. All rights reserved. Print ISSN: 1073-0397.
the American Academy of Pediatrics, 345 Park Avenue, Itasca, Illinois, 60143. Copyright © 2000
has been published continuously since 1948. Pediatrics is owned, published, and trademarked by
Pediatrics is the official journal of the American Academy of Pediatrics. A monthly publication, it
at Viet Nam:AAP Sponsored on August 30, 2020
www.aappublications.org/news