2014 Data Indicate That Four in Ten Children
Live in Low-Income Families
Half of These Are in Poor Families and Nearly Half of Those
in Deeply Poor Families
J e s s i c a A . C a r s o n , A n d r e w S c h a e f e r , a n d M a r y b e t h J . M a t t i n g l y
National Issue Brief #94 Winter 2015
University of
New Hampshire
Carsey School of Public PolicyCARSEY RESEARCH
I
n September 2015, the Census Bureau released 2014 poverty data from the American Community Survey (ACS), the only regular source for reliably estimating child poverty in geographic areas below the state level using the official poverty measure. In this brief, we use ACS data to explore child poverty rates across the United States by region, state, and place type (rural, suburban, and city). We also examine data on children who are deeply poor (those in families with incomes below half of the poverty line), as well as low-income children (those in families with low-incomes less than twice the poverty line). We find that while child poverty declined nationwide between 2013 and 2014, that drop was not felt uniformly across the country: several states saw declines, a few states saw increases, and others saw no change at all. We also found sub-stantial differences in the magnitude of change across rural places, suburbs, and cities.Child Poverty Rates Vary by State
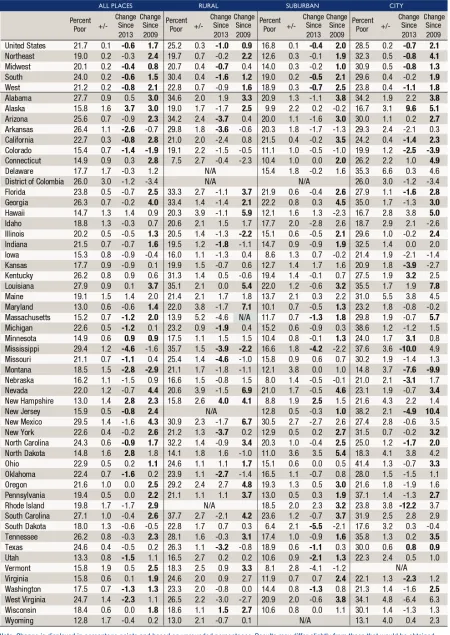
While child poverty declined overall, rates still vary tremendously across states, regions, and place types (see Table 1). Nationwide, 21.7 percent of children lived in poor families in 2014 (that is, with incomes below $19,073 for a single parent with two children),1 down 0.6
TABLE 1. PERCENT OF CHILDREN IN POVERTY, BY STATE AND PLACE TYPE, 2014, OFFICIAL POVERTY MEASURE
poverty rate remained stable between 2013 and 2014 whereas other regions experienced a decline. Child poverty remained higher than in 2009 (post-recession) in nearly every region and place type, with the sole exception of the rural Midwest, where the 2014 child poverty rate was similar to the 2009 rate.
State-by-state variations in child poverty rates are illustrated in Figure 1. States with poverty rates below 15 percent included
Connecticut, Hawaii, Maryland, Minnesota, New Hampshire, North Dakota, Utah, and Wyoming. At the other end of the spectrum, rates in Alabama, Arkansas, Arizona, Georgia, Kentucky,
Louisiana, Mississippi, New Mexico, South Carolina, Tennessee, and Washington DC were above 25 percent. Between 2013 and 2014, changes in child poverty were not consistent across states: while fourteen witnessed a decline in
child poverty over the year, four experienced a significant increase. Looking over a longer period—from the end of the Great Recession in 2009 until 2014—twenty states had child poverty rates similar to those at the end of the Great Recession, and two states—Colorado and Montana—had rates that were lower. Worth noting, however, is that the poverty rate has not fallen below its pre-recession rate in any state (data available upon request).
FIGURE 1. PERCENT OF CHILDREN IN POVERTY, 2014, OFFICIAL POVERTY MEASURE
Place-Based Patterns
Persist in Other “Poverty”
Measures
In addition to tracking trends in child poverty over time, the analysis of other income-based measures in conjunction with children’s des-ignation as poor or not poor can further improve our understanding of children’s economic well-being. For instance, there is considerable evidence that the official poverty measure is an inadequate indica-tor of need, and multiple meth-ods for improving assessments of income, including the U.S. Census Bureau’s Supplemental Poverty Measure (SPM),2 have been
pro-posed. Although the data used here allow us to examine sub-state geographies, they do not provide SPM measures or the information necessary to compute the SPM. Instead, we expand our exploration of children’s economic well-being by documenting the share of children who live not only below 100 percent of the poverty line, as above, but also below 50 percent of the federal poverty line (“deeply poor”) and below 200 percent (“low income”).3
These categorizations have mea-sured implications for children. First, we chose a “low-income” indicator of less than 200 percent of poverty based on research which has found that families require incomes between 1.5 and 3.5 times the federal poverty threshold to meet their most basic household needs.4 For a single parent with two
children, the 200 percent threshold equates to $38,146 per year, $3,179 per month, or $34.84 per person, per day. Families with incomes below those levels very likely have difficulty meeting basic day-to-day
needs, and parents may curtail spending on certain necessities like nutritious food or medications in order to pay rent or utilities. Second, we incorporate a measure of deep poverty, as research identi-fies a concentration of the deleteri-ous effects of poverty, including worse cognitive scores and greater behavioral problems, at incomes at or below 50 percent of the poverty line.5 For a single parent with two
children, this equates to $9,536 per year, $795 per month, or $8.71 per person, per day.
As shown in Table 2, 44.1 per-cent of children live in families with incomes below 200 percent of the poverty line. The share of children living below this thresh-old varies substantially across the nation. For instance, more than half of children in cities and rural places live in low-income families (52.9 and 51.7 percent, respec-tively), compared with just 36.9 percent of suburban children. In suburbs and cities, the share of children who were in low-income families fell between 2013 and 2014, though rates were stable in rural places and remain elevated compared to post-recession levels in all place types. The Midwest and West experienced declines in low-income rates between 2013 and 2014. Rates of low-income children were more stable than child poverty rates between 2013 and 2014, with only five states (California, Missouri, Nebraska, Oklahoma, and Utah) experienc-ing declinexperienc-ing shares of children in low-income families, and no states experiencing increases.
Figure 2 on page 6 shows the share of children by state who lived in deeply poor families (incomes
below 50 percent of the poverty line) in 2014.6 As with other
pat-terns in child economic well-being, the states with the highest rates of deep poverty tend to be clustered in the South. Nationwide, nearly one in ten children (9.6 percent) lived in deeply poor families, down 0.3 percentage point since 2013 but still nearly a full percentage point above 2009 post-recession levels. In most states, the share of children who were deeply poor remained stable between 2013 and 2014. However, higher shares of children were deeply poor in Maine and North Dakota, while rates dropped in seven other states (Arkansas, California, Florida, Indiana, Maryland, Michigan, and North Carolina).
Poor Children Can Be
Clustered in States Where
Poverty Rates Are ‘Low’
TABLE 2. PERCENT OF CHILDREN IN LOW-INCOME FAMILIES, BY STATE AND PLACE TYPE, 2014
Implications
Not only are higher shares of children living in poverty than prior to the Great Recession, but nearly one in ten children live in families with incomes below half of the poverty line, that is, with incomes below $12,004 for a family of two adults and two children. That nearly 7 million American children are living in such deeply poor homes highlights the necessity of the social safety net. It is important to note that
although policy interventions like tax credits or other work supports may improve the quality of life for many children, the impact of these interventions may not show up in official poverty statistics, since official statistics do not consider these supports in their calcula-tions. As a result, policy makers might consider using innovative measures like the Supplemental Poverty Measure or additional cal-culations using the official poverty measure in assessing the efficacy of safety net efforts. In calculating
the SPM, the U.S. Census Bureau has identified an important role for programs like refundable tax credits, albeit only for children whom such programs reach.7
Further, despite tremendous variation in the cost of living across the nation, the official poverty measure does not make adjustments for family income purchasing power. That is, poor families may be able to afford better housing or more nutritious food in relatively inexpensive states like Indiana or Kentucky
FIGURE 2. PERCENT OF CHILDREN IN DEEP POVERTY, BY STATE, 2014
than in more expensive places like California or New York, or in less-expensive rural places than in costlier urban centers.8
Nonetheless, research suggests that, depending on geography, families need between 1.5 and 3.5 times the poverty line to meet their basic needs of housing, food, child care, health insurance, medical care, transportation, and taxes. That more than four in ten of the nation’s children live in low-income homes highlights the criti-cal importance of both improving access to opportunity and of making work pay for America’s most vulnerable families. Given dramatic differences in the cost of living across the nation, it may be worthwhile to consider making or increasing geographic adjustments to a host of safety net programs.
Data
This analysis is based on estimates from the 2009, 2013, and 2014 American Community Survey. Tables were produced by aggregat-ing information from detailed tables available on American FactFinder (http://factfinder.census.gov). These estimates give perspective on child poverty, but they are based on survey data, so caution must be exercised in comparing across years or places. All differences highlighted in this brief are statistically significant (p<0.05).
Box 1: Definition of Rural, Suburban, and City
Definitions of rural and urban vary among researchers and the sources of data they use. Data for this brief are derived from the American Community Survey, which identifies each household as being within one of several geographic components. As used here, “city” designates households in the principal city of a given metropolitan statistical area, and “suburban” includes those in metropolitan areas but not within the prin-cipal city of that area. “Rural” consists of the addresses that are not within a metropolitan area.
FIGURE 3. NUMBER OF CHILDREN AT SELECTED PERCENTAGES OF POVERTY THRESHOLD, 2014
E n d n o t e s
1. “Poverty Thresholds” (Washington, DC: U.S. Census Bureau, 2014), https://www.census.gov/hhes/www/poverty/ data/threshld.
2. See Kathleen Short, “The Supplemental Poverty Measure: 2014,” Current Population Reports, P60-254 (Washington, DC: U.S. Census Bureau, 2015), https://www.census.gov/content/ dam/Census/library/publications/2015/demo/p60-254.pdf. 3. We use these terms for purposes of brevity, though, unlike “poor,” there is no official definition of “deeply poor” or “low income.” However, there is precedent for these terms as applied here. See, for example, Serena Lei, “The Unwaged War on Deep Poverty” (Washington, DC: Urban Institute, 2013), www.urban.org/features/unwaged-war-deep-poverty, and Gordon M. Fisher, “Standard Budgets (Basic Needs Budgets) in the United States Since 2006” (Washington, DC: U.S. Census Bureau, 2012), www.census.gov/hhes/povmeas/ publications/other/udusbd3.pdf.
4. See, for example, Kinsey Alden Dinan, “Budgeting for Basic Needs: A Struggle for Working Families” (New York, NY: National Center for Children in Poverty, Mailman School of Public Health, Columbia University, 2009), http:// academiccommons.columbia.edu/catalog/ac%3A126290. See also Fisher 2012.
5. See, for example, Jeanne Brooks-Gunn and Greg J. Duncan, “The Effects of Poverty on Children,” The Future of Children 7, no. 2 (1997): 55–71; J.D. McLeod and M.J. Shanahan, “Poverty, Parenting, and Children’s Mental Health,” American Sociological Review 58 (1993): 351–66; Jeanne Brooks-Gunn, Jeanne, T. Leventhal, and Greg J. Duncan, “Why Poverty Matters for Young Children: Implications for Policy,” in J.D. Osofsky and H.E. Fitzgerald, eds., WAIMH Handbook of Infant Mental Health: Vol. 3. Parenting and Child Care (New York, NY: Wiley, 1999); J.R. Smith, Jeanne Brooks-Gunn, and P.K. Klebenov, “The Consequences of Living in Poverty for Young Children’s Cognitive and Verbal Ability and Early School Achievement,” in G.J. Duncan and J. Brooks-Gunn, eds., Consequences of Growing Up Poor (New York, NY: Russell Sage, 1997); and R. Gabriela Barajas, Nina Philipsen, and Jeanne Brooks-Gunn, “Cognitive and Emotional Outcomes for Children in Poverty,” in D.R. Crane and T.B. Heaton, eds., Handbook of Families & Poverty (New York, NY: SAGE Publications, 2007).
6. Unlike for the tables, this figure does not provide state estimates broken down by place type. We omit these estimates due to insufficient sample size among the lowest-income children.
7. See Short 2015.
8. For information on state-by-state cost of living, see “Cost of Living Data Series” (Jefferson City: Missouri Department of Economic Development, Missouri Economic Research and Information Center, 2015), https://www.missourieconomy. org/indicators/cost_of_living/. For a comparison of rural and urban expenditures, see William Hawk, “Expenditures of Urban and Rural Households in 2011,” Bureau of Labor Statistics: Beyond the Numbers, Prices and Spending 2, no. 5 (2013), http://www.bls.gov/opub/btn/volume-2/expenditures-of-urban-and-rural-households-in-2011.htm.
A b o u t T h e A u t h o r s
Jess Carson is a vulnerable families research scientist at the Carsey School of Public Policy at the University of New Hampshire (jessica.carson@unh.edu).
Andrew Schaefer is a vulnerable families research associate at the Carsey School of Public Policy and a doctoral candidate in sociology at the University of New Hampshire (andrew.schaefer@unh.edu).
Beth Mattingly is director of research on vulnerable fami-lies at the Carsey School of Public Policy and a research assistant professor of sociology at the University of New Hampshire (beth.mattingly@unh.edu).
A c k n o w l e d g m e n t s
This work was supported by the Annie E. Casey Foundation and anonymous donors. The authors thank Barbara Cook, Sarah Leonard, and Jennifer Clayton for research assistance; Michele Dillon, Michael Ettlinger, Curt Grimm, and Amy Sterndale for their feedback on earlier drafts; Laurel Lloyd and Bianca Nicolosi at the Carsey School of Public Policy for their layout assis-tance; and Patrick Watson for his editorial assistance.
The Carsey School of Public Policy at the University of New Hamp-shire is a nationally acclaimed resource for research, leadership development, and engaged scholarship relevant to public policy. We address the most pressing challenges of the twenty-first century,
striving for innovative, responsive, and equitable solutions at all levels of government and in the for-profit and nonprofit sectors.
Huddleston Hall • 73 Main Street • Durham, NH 03824 (603) 862-2821
TTY Users: dial 7-1-1 or 1-800-735-2964 (Relay N.H.) carsey.unh.edu
University of New Hampshire