Speaker Identification in Network
Environment
Dr.V. RADHA
Associate Professor Department of Computer Science Avinashilingam Deemed University
Coimbatore, Tamil Nadu, India.
Abstract
The main objective of this paper is to identify a speaker in a networking environment. Automatic speaker identification is a fundamental task in speech processing. The proposed work is conducted in three phases, (1) Speech detection, (2) Clustering and (3) Speaker Identification. The process of capturing speech from a remote computer in an intranet environment involves recording huge volume of data or frames of speech. This is done by recording continuously the sound signals from the remote computer. The unwanted data in the recorded speech data is removed and the resultant data is taken to identification. MFCC technique is used for feature extraction and vector quantization is used for quantizing the features identified. To reduce the search space while performing the matching process between the speaker models and the input signal, a modified K-Means algorithm is used. After identifying the cluster that closely matches the input data, the present research work uses an innovative multi-step approach involving four tests for speaker identification. They are, cross correlation, frequency multiplication, frequency cross correlation and peak signal comparison. The Neyman-Pearson likelihood ratio test was used to combine the result of the four tests. The result of these tests ensures that the correct speaker is identified. The proposed system reduced computation time by 50-90% without affecting the identification process.
Keywords : Speaker Identification, Clustering, Modified K-Means, Likelihood Ratio, Networking Environment
1.INTRODUCTION
For many years now, there has been a growing interest in the use of voice as a means of recognizing or confirming a person’s identity. The reason for this is that a person’s voice is considered a biometric identifier, as are fingerprints, retinal patterns and DNA. It is a characteristic that is supposed to be intrinsic and unique to a person and, as such, should not be reproducible by anyone else [7]. Speaker identification has recently become an important research and development area. The driving factor behind much of the development is the desire to produce a natural form of communication between human and machine. Since speech is the most natural form of communication, it has the capability to impact on countless fields of research and development [4]. Speaker identification can be classified into two types, based on anonymity. These are open-set and closed-set speaker identification. Both sets use a database of registered speakers for identification, with the main difference being in the decision process. For open-set the decision is based upon the enrolled speakers together with the possibility that the speaker is unknown. Closed-set only considers the best match from the enrolled speakers [11]. Closed-set speaker identification can be further classified into text-dependent and text-independent. Text-dependent systems rely on prior knowledge of the text spoken by the individual for identification. This can be in the form of a phrase prompted by the system or a user specific phrase. Text-independent must be capable of recognising a speaker, without prior knowledge of the text. Text-independent systems are considerably more fixable than text-dependent, however they tend to produce lower accuracy levels [3].
Vol. 2(8), 2010, 3434-3440 series of tests applied in a multi-step fashion on the speech data. The cumulative result of the tests decides whether a speaker is identified or rejected.
2. SPEAKER IDENTIFICATION SYSTEM (SIS)
Speaker identification systems require speech signals of a previously enrolled phrase (Speech Reference Template, SRT) to be compared with the spoken input (Input Phrase, IP) to identify the speaker. To enable remote accessibility, the SIS works in a network environment with several nodes and a server. The speaker who wants to be identified speaks from a remote node. This IP is passed onto the server. The server has the SRT, which is examined with the IP received from the node and determines the identity of the speaker.
2.1Speaker Identification in Network Environment
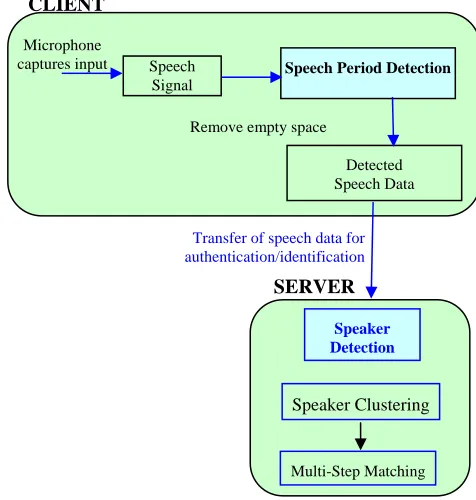
A block diagram of the proposed identification system is shown in Fig. 1. The identification system has clients and a server. The client can physically be located anywhere as long as it can transfer data to the server. The system works in a network environment with a server and several nodes. The nodes are used by the speakers initially for authentication and later, after successful detection, the speakers are allowed to use restricted information in the system. The node operates as a multithreaded window application that performs functions like (i) Reads the wave file from the sound card, (ii) Writes it into a file and (iii) Prevent I/O bottleneck during real time speaker voice recording. The speaker or the user has the task of starting and stopping the recording of the speech signal. The compression format used to store speech data is “wav”. After recording the sound, the file created (sound.wav for example) is sent to the server for analysis. If, for reasons like connection failure, the client is not connected to the server, then the sound file alone will be created and it will not be sent to the server for analysis. A very similar approach was used by [1]who created a MFC multithreaded class for recording, playing and saving WAV sound files.
Fig. 1: Speaker Identification in Network Environment
2.2 Enrolment and Identification Phase
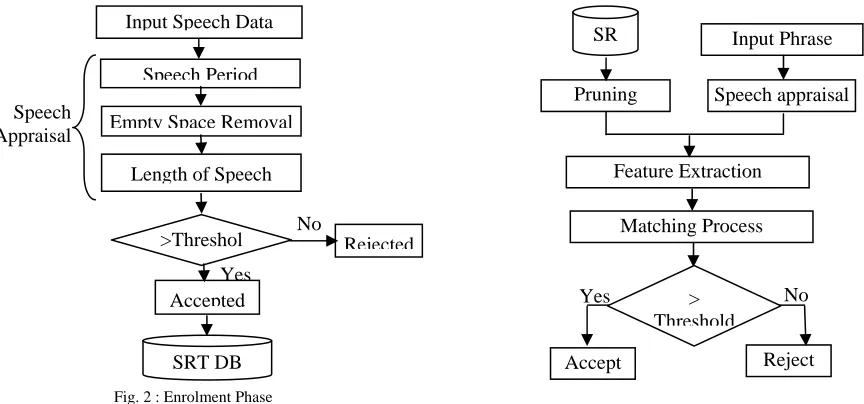
SIS works in two phases : enrolment phase and identification phase. The enrolment phase and the identification phase used in the proposed work are illustrated in Fig. 2 and 3.
Transfer of speech data for authentication/identification Microphone
captures input Speech Signal
Speech Period Detection
Detected Speech Data
SERVER CLIENT
Remove empty space
Speaker Detection
2.3 Speech Appraisal
Speech data (both IP and SRT) are captured by continuously recording the sound signals from the remote system (node). This might involve recording large numbers of frames which have both wanted and unwanted data. Unwanted data are those which do not have the required input signal and which are normally composed of silent or empty signals, where nothing is said. The first step is to remove these unwanted silent or empty signals. Speech period detection task is performed to find out when the speech data starts or ends. While recording voice for identification from the nodes, it is very difficult to know when the actual data is sent by the node. To work out this dilemma, the server is made to continuously sample the sound data and the magnitude of these sample sound is examined. When the magnitude becomes high, it is considered as the start of the speech sample. Similarly, after a high magnitude sample, a sudden dip indicates the end of the sample data. While analyzing the input signal, care must be taken to ensure that the system does not spend time examining empty space. Empty or silent data occur frequently while recording speech, which cannot be avoided. Removing silent speech greatly enhances the identification / execution time of the proposed algorithm. In the proposed system, the silent data is identified by computing of variations of the signal samples in speech frame, against the frame’s mean. If variations are big enough, the frame is considered as a speech frame, otherwise is taken as a silence.
The cleaned output signal is taken as input to the second step of speech appraisal, that is, the length of speech test. The length of speech is a measure that is very vital while testing speaker identity. Speech signal normally can have too much or too little data. Both of these types are useless for speaker identity. If the sample is very small, then the speech signal probably might not have the input data, instead has been initiated through background noise generated by motor or fan running sound that are near to the microphone in the remote environment. If this is the scenario, then these noise signals have to be ignored. Increase in the length of the input signal might be because of high pitch in the background noise that it results in constant recording or it might be because the user is issuing commands very quickly without any pause. The sample signal passes this step if the length of the sample is within a percent threshold of the length of the template. This test is mainly designed to prevent false positives.
2.4 Speaker Identification Process
When a new IP is received, the features are extracted using Mel Frequency Ceptral Coefficient (MFCC). The resultant coefficients are vector quantized. Quantization, the process of approximating continuous amplitude signals by discrete signals, is an important aspect of data compression or coding, the field concerned with the reduction of the number of bits necessary to transmit or store analogue data, subject to a distortion or fidelity criterion. Similarly, the SRT is also feature extracted. To reduce the search time, the extracted features are clustered using a modified K-means algorithm. The major disadvantage of using K-K-means algorithm for clustering is the optimal selection of the Speech
Appraisal
Input Speech Data
Empty Space Removal Speech Period
Length of Speech
Accepted
Rejected
SRT DB
Fig. 2 : Enrolment Phase
>Threshol Yes
No
Input Phrase Pruning
Matching Process
Speech appraisal
Accept Reject
> Threshold
Fig. 3 :Identification Phase
SR
Feature Extraction
Vol. 2(8), 2010, 3434-3440 serious fluctuation on the computation overhead and is one of the most essential issues in clustering. Normally, as a simple approach, the results of multiple runs with different K values are compared and the best one is chosen according to a criterion. When K equals to the optimum number of clusters, the algorithm can correctly find out the clustering centres. Otherwise, it will lead to an incorrect clustering where it becomes difficult to locate the centres of the corresponding clusters. Instead, they are either at some boundary points among different clusters or at points biased from some cluster centres. Because of the above-mentioned disadvantages, it is desirable to automatically calculate the optimal number of clusters [5]. Automatic detection of K while clustering is not a new concept. It has been used in many researches in data mining [8, 9], image processing [10], etc. However, to the best of the knowledge, it is new to speech data clustering and is explained below.
3. Modified K-Means Algorithm
This paper proposes a modified K-means algorithm based on Bayesian Information criterion (BIC) to estimate the optimal value of K. The algorithm initially divides speech data into two clusters and continues to divide each of the clusters into two more clusters. Bayesian Information Criterion [2, 6] is used as the diversion criterion. The reason for using BIC are, (i) BIC considers the selection from the exponential family of distribution and (ii) BIC is based on prior probability rather than the distance between two distributions. The modified K-means algorithm is explained below .
1. Prepare p-dimensional data whose sample size in n 2. Set ko =2, where k0 is the initial number of clusters
3. Apply K-means to all data with setting k = ko. the divided clusters are named C1, C2…, Cko
4. For each cluster Ci, apply k-means by setting k = 2. The divided clusters are named as Ci(1)and Ci(2)
5. Assumption : The following p-dimensional normal distribution for the feature xi contained in Ci is
,x) (2 ) |V | e (
f i p/2 i 1/2
) x ( V ) x ( 2 1
exp i t t1 i
then calculate BIC as
BIC = -2 log L(
ˆ
i, xi Ci) + q log niwhere ˆi =
ˆi,Vˆi
is the maximum likelihood estimate of the p-dimensional normal distribution; i isp-dimensional means vector and Vi is p x p dimensional variance-covariance matrix; q is the number of parameters
dimension and it becomes 2p if covariance Vi is ignored. xi is the p-dimensional data contained in Ci; ni is the
number of elements contained in ci. L is the likelihood function which indicates L(.) = f(.). The present research
work ignores Vi and therefore q = 2p.
6. The assumptions made are the p-dimensional normal distributions with their parameters i(1), i(2) for Ci(1), Ci(2)
respectively. The probability density function of this 2-division model becomes
G(
i (2)
1 ii ) 1 ( i i ) 2 ( i ) 1 (
i , ,x f( ,x) f( ,x)
g
where (2) i (1) i i C in included is x f i , 0 C in included is x f i , 1
xi will be included in either Ci(1) or Ci(2); I is a constant which lets g(, x) be a probability density function (1/2 I
1). I is approximated as below :
i = 0.5 / K(i)
where i is a normalized distance measure between two clusters, shown as below
| V | | V | || || 2 1 2 2 1 i
K(.) stands for an lower probability of normal distribution. The BIC for this model is BIC' = -2 log L'(ˆ'i, xi Ci) + q' log ni
where ˆ'i = [ (1) i
ˆ
, (2) i
ˆ
7. If BIC > BIC', then the two-divided model is preferred and Ci is set to Ci(1). As for Ci(2), the p-dimensional data,
cluster centers, log likelihood and the BIC are pushed onto the stack. Return to Step 4.
8. If BIC BIC', the clusters are not divided any more and we stop the process. The stacked data is extracted and Ci is set to Ci(2). Return to Step 4. When the stack is empty, proceed to Step 9.
9. The 2-division procedure for Ci is complete. The identification of the clusters are renumbered such that it
becomes unique in Ci.
10. The 2-division procedure, initial ko divided clusters, is completed. The entire clusters are renumbered so that it
becomes unique in Ci.
11. Output the cluster identification number to which each feature is allocated, the center of each cluster, the log likelihood of each cluster and the number of elements in each cluster. This is the code book.
When a new IP is received, the features are extracted using MFCC. These extracted feature vectors are used to identify the appropriate cluster. The cluster is chosen such that the distance between feature vectors, extracted from the IP and cluster representative (i.e. centroid codebook) is minimal. The use of modified K-means clustering algorithm successfully prunes all the speaker models that do not match the IP. This reduction increases the speed of the matching algorithm. After identifying the cluster, the matching algorithm (explained below) is executed to identify the correct speaker.
4. Matching Algorithm
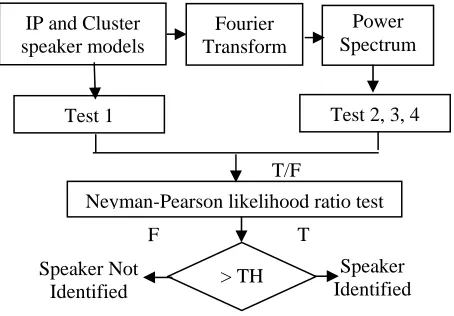
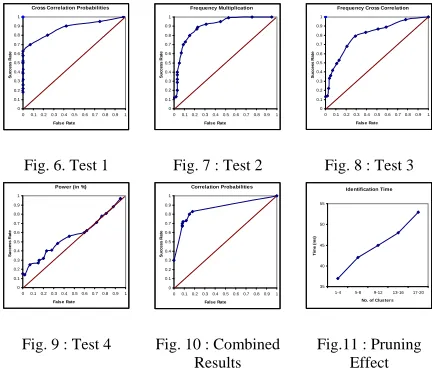
The third step of the system is speaker identification, where attempts are made to identify the speaker from the source input signals. This phase relies heavily on frequency analysis because each person has unique voice characteristics that can be isolated in the frequency domain. In order to confirm that the identity of the person is determined accurately, the proposed system performs four tests, which are applied in a multi-step fashion on the input signal frames. The results of the four tests are consolidated using Neyman-Pearson Likelihood ratio. The four tests used are, Cross correlation test (Test 1), Frequency multiplication test (Test 2), Frequency cross correlation test (Test 3) and Peak signal comparison test (Test 4). The four tests are applied to the speech data (both SRT and IP) during speaker identification process. The process of using these four tests in a multi-step fashion for speaker identification is illustrated in Fig. 4.
After the computation of correlation, a high peak in the middle of the cross-correlation figure indicates that the two signals being correlated are similar. To accept the signal, a threshold value is used. If the peak value is greater than this threshold value, then the signal is accepted, otherwise it is ignored. The cross-correlation between two discrete-time signals y[n] and x[n] is defined as
n
xy(l) y(n)x(n 1)
r where n is the sample index, and l is the lag or time shift between the two signals.
Fig. 4 : Matching Process
IP and Cluster speaker models
Power Spectrum
> TH Speaker Not
Identified
Speaker Identified Fourier
Transform
Test 1
Neyman-Pearson likelihood ratio test
F T
Test 2, 3, 4 T/F
procedure modified_FT for i = 1 to n
X(:, i) = 0; end for;
j=0;
while (j < length(x)-n) for i=1 to n tmp(i) = x(j+1);
end for;
X = X + fft(tmp, n)l j = j + n; end while;
Vol. 2(8), 2010, 3434-3440 The Fourier Transformation (FT) examines the power spectrum of the signals. It is computed using the formula,
n
n j j ) x[n]e
e (
X . The power spectrum is computed by multiplying the Fourier transform coefficients by their complex conjugate. The formula given above has the restriction that the length of the spectrum should be equal to the signal. This restriction is overcome, by dividing the signal into smaller chunks, calculating the Fourier transform for each chunk and summing them cumulatively. This allows the resulting spectra to be of a specified length and it includes data from the entire sampling range. The pseudo code of modified FT is given in the above Fig. 5.
Frequency multiplication is the most important test. First, the normalized power spectrum of the sample is calculated for each template. This is done by identifying the locations in the power spectrum where both signals have peaks. This test works because only peaks that show up in both signals will be passed on to the resulting calculation. Each element, then, is multiplied by the corresponding element in the power spectrum of the template and this value is stored. The values of all the resulting spectra are cumulatively added. The result is compared with a threshold. If it is greater, then the sample has passed this test else the test has failed.
Frequency cross correlation test is similar to frequency multiplication test. The only difference is that instead of performing a cross multiplication, a cross correlation is performed. The power spectrum of the sample is cross correlated with that of the template. The highest value from the correlation is compared against a threshold. If it is greater, then it passes the third test else it fails.
The fourth test compares the number of peaks in the power spectrum of the sample and the template. This is done by counting the number of times the power spectrum is above a certain threshold. If this value of the sample signal is close to the template value, then it is accepted by fourth test else it is rejected.
5. Results
The enrolment phase takes care of the creation of speaker (doctor) database, which acts like a template during the authentication process. To ensure high identification rates and a large reliability of the identification results, each speaker has to register and has to be enrolled to the system, by speaking a certain amount of text, which is predefined. The number of words was limited to three words and care was taken to ensure that the speech signal was within 5 seconds duration. Speech signal is recorded in laboratory environment using the recorder facilities provided by the computer system. The sampling rate used on all speech samples throughout this research work is 8kHz and the compression format used to store speech data is “wav”. The database consisted of 10 sample speech signals from each speaker taken on different days, at different times, so as to accommodate voice variation that may occur due to external and internal factors.
Another parameter that was used to evaluate the algorithm was the identification time, which determines how quickly an input signal is recognized and mapped to an individual speaker in the system. Fig. 11 shows the performance of the system when tested with different cluster size. It is evident from the figure, that the average time taken for identification is directly proportional to the number of candidate clusters selected for comparison. As the number of clusters increases, the time for matching process also increases, which in turn increases the identification time. This indicates that pruning unwanted speaker models speed up the identification process.
Cross Correlation Probabilities
0 0.1 0.2 0.3 0.4 0.5 0.6 0.7 0.8 0.9 1
00.10.20.30.40.50.60.70.80.91
False Rate
S u ccess Rat e Frequency Multiplication 0 0.1 0.2 0.3 0.4 0.5 0.6 0.7 0.8 0.9 1
00.10.20.30.40.50.60.70.80.91
False Rate S u ccess R a te
Frequency Cross Correlation
0 0.1 0.2 0.3 0.4 0.5 0.6 0.7 0.8 0.9 1
00.10.20.30.40.50.60.70.80.91
False Rate S u cc ess Rat e
Fig. 6. Test 1 Fig. 7 : Test 2 Fig. 8 : Test 3
Power (in %)
0 0.1 0.2 0.3 0.4 0.5 0.6 0.7 0.8 0.9 1
00.10.20.30.40.50.60.70.80.91
False Rate S u cc ess Rat e Correlation Probabilities 0 0.1 0.2 0.3 0.4 0.5 0.6 0.7 0.8 0.9 1
00.10.20.30.40.50.60.70.80.91
False Rate S u cc ess Rat e Identification Time 35 40 45 50 55
1-4 5-8 9-12 13-16 17-20
No. of Clusters
Time
(
m
s
)
Fig. 9 : Test 4 Fig. 10 : Combined Results
Fig.11 : Pruning Effect
6. Conclusion
In this paper, methods and techniques have been developed for speaker dependent, text dependent speaker identification from a remote environment. The experimental results clearly indicate that using pruning techniques like clustering reduces the search time, thus enhancing the identification process. It was found that the system performed successfully when the test audience was completely enrolled in the database and it fell short of
expectation when audiences were not enrolled. During the course of testing, it was also found that the system was, to a large extent, resistant to slight variations in the rate of speech; however, it required at least about two seconds of continuous speech (with pauses removed) to establish a successful match. Future work includes developing a speaker independent identification as a solution to improve the recognition rate of speakers not enrolled in the database.
References
[1] Cheffers, P. (2007) MFC Multithreaded Classes for Recording, Playing and Saving (WAV files) Sound Online Document available in www.codeguru.com/multimedia/echosound.htm
[2] Duffie, D. (1987) Stochastic Equilibria with Incomplete Financial Markets, Journal of Economic Theory, Vol. 41, Pp. 405-416. [3] Karpov, E. (2003), Real-Time Speaker Identification, Master´s thesis, University of Joensuu.
[4] Littlefield, J. and Broughton, M. (2005) Dual-Type Automatic Speech Recogniser Designs for Spoken Dialogue Systems, Australasian Language Technology Workshop 2005, Defence Science and Technology Organization.
[5] Min-Joung, K., Se-jin, O., Ho-Youl, J. and Hyun-yeol, C. (2003) A Pruning Method for Reducing Calculation Costs of Speaker Identification System, IEICE Technical report on Speech, Vol.103, No.27(20030418) Pp. 51-56.
[6] Schwarz, G. (1978) Estimating the dimension of a model, The annals of statistics, Vol. 6, Pp 461-464.
[7] Wang, L., Kitaoka, N. and Nakagawa, S. (2007) Robust distant speaker recognition based on position-dependent CMN by combining speaker-specific GMM with speaker-adapted HMM, Speech Communication, Vol. 49, No.6, 501-513.
[8] Wu, J. and Zhou, Z.H. (2002) Face Recognition with one training image per person, Pattern Recognition Letters, Vol. 23, Pp. 1711-1719. [9] Yin, P., Wang, J. and Guo, C. (Eds.) (2004) Automatic Cluster number determination via BYY Harmony Learning, Pp. 828-833.
[10] Zhang, R., Zhang, M.Z. and Khanzode, S. (2004) A data mining approach to modeling relationships among categories in image collection, Conference on Knowledge Discovery in Data, Proceedings of the tenth ACM SIGKDD international conference on Knowledge discovery and data mining, Pp. 749 - 754
[11] Zhu, B. and Micheli-Tzanakou, E. (2000) Nonstationary speech analysis using neural prediction, IEEE Eng. Med. Biol. Mag. vol. 19, 102-105