Te Waihora/Lake Ellesmere
State of the Lake 2013
Acknowledgements
Te Waihora/Lake Ellesmere State of the Lake and Future Monitoring 2013 represents the collective effort of many people and organisations – partners, sponsors and contributors alike.
Partners
Partners have contributed data, knowledge and expertise, and have helped with planning and preparing this report and the fourth Living Lake symposium. We would like to thank: Waihora Ellesmere Trust, Environment Canterbury, Te Rūnanga o Ngāi Tahu, Department of Conservation, Christchurch City Council, Selwyn District Council, Fish & Game NZ (North Canterbury), and Lincoln University.
Gold Sponsors
The following organisations have sponsored this report and the symposium. We would like to thank: Fonterra, Synlait Ltd
Silver Sponsors
The following organisation was a Silver Sponsor for the symposium. We would like to thank: DairyNZ
Bronze Sponsors
The following organisations were Bronze Sponsors for the symposium. We would like to thank: Central Plains Water Ltd, Ngāi Tahu Property, Te Whāriki
Authors, editors, design and printing
The completion of this report was made possible with the support of: Lead authors
Karen Banwell, Ian Brown, Ross Cullen, Tim Davie, Michael Fletcher, Philip Grove, Zach Hill, Ken Hughey, Kirsty Johnston, Adrienne Lomax, Ognjen Mojsilovic, Hamish Rennie, Kimberley Robinson, Ken Taylor, Gail Tipa, Howard Williams.
Content editors
Kenneth F. D. Hughey, Waihora Ellesmere Trust/Lincoln University Kirsty A. Johnston, Environment Canterbury
Adrienne J. Lomax, Waihora Ellesmere Trust Kenneth J. W. Taylor, Environment Canterbury Design and printing
In addition to providing content and assistance with developing the ideas behind this report, we must acknowledge Environment Canterbury for the design, layout and printing, in particular, Amanda Sinclair and Glenda Duffell.
Other contributors and reviewers
Jason Arnold, Mike Beentjes, Kelvin Coe, Ronnie Cooper, Shannon Crowe, Tony Hawker, Laurien Heijs, Fraser Maddigan, Trevor Partridge, David Perenara O’Connell, Alice Shanks, Robin Smith, Andy Spanton, Anita Spencer, Belinda Whyte, Lantz Wu.
Photo credits – listed by section Cover – Matt Searles
Contents page – Amanda Sinclair
Te Waihora catchment map courtesy of Environment Canterbury 1. E.Markham-Short (Te Waihora)
2. Amanda Sinclair (group photo), Matt Searles (View of Kaitorete Spit) 3. Adrienne Lomax (subdivision) 4. Hedgehog House (aerial view) 5. Matt Searles (white heron),
NIWA: Nelson Boustead (groundwater fauna) 6. Carol Jensen (Reed canary grass),
Philip Grove (willow), Adriennne Lomax (planting photos) 7. Peter Langlands (lake flies),
Adrienne Lomax (bird survey) 8. Environment Canterbury (eel fishing),
Peter Langlands (flounder fishing)
9. Fish & Game NZ (boys with fish, duck shooters), Peter Langlands (photographer, kayakers), Little River Rail Trail Trust (rail trail) 10. Andy Spanton (Te Waihora, swan eggs),
Ngai Tahu (tuna)
11. Matt Searles (heron, railtrail bridge)
Reference information
Any part of this report may be reproduced for private study, research or review. Images remain the copyright of the credited photographer, and may not be reproduced without their prior written permission.
We suggest this publication be referenced as: Hughey, K.F.D., Johnston, K.A., Lomax, A.J., and Taylor K.J.W. (eds). 2013.
Te Waihora/Lake Ellesmere: State of the Lake 2013. Technical Report No.1, Waihora Ellesmere Trust, Christchurch.
ISBN 978-0-473-26750-6 (hard) ISBN 978-0-473-26751-3 (web) This report has been prepared as a downloadable resource and is available from the WET website: www.wet.org.nz. Many sections in this report are based on a more detailed report which can also be found on the WET website, along with additional links to supporting information.
Disclaimer
3
Preface
Te Waihora/Lake Ellesmere is a special place and
valued by many people. Many are concerned about
the apparent decline in the health, recreational and
cultural worth, and biodiversity of the lake in recent
decades. A great deal of work is currently underway by
many organisations and people to restore and improve
the ecosystem health of the lake and its environs. It is
important to regularly track the progress being made.
This report from Waihora Ellesmere Trust (WET) is an
independent publication, bringing together data and
recommendations from many agencies and individuals
to report on the state of the lake and its environs.
Since the first Te Waihora/Lake Ellesmere State of the
Lake report in 2008, the aim has been to identify a
small set of indicators and to report on these regularly.
This is the first report using indicators.
Many of the indicators are part of established state
of the environment reporting programmes. By
bringing the indicator data together to report on the
lake, we are providing an overview of Te Waihora/
Lake Ellesmere in 2013. The report‘s purpose is to
explain clearly and simply what we currently know
about the lake – it is, in essence, a ‘health report
card’ for Te Waihora/Lake Ellesmere including what
influences the lake’s health. Each section includes
recommendations for future monitoring. We will use
these recommendations to review and refine the
indicator set for future reporting.
We hope in publishing this report to strengthen
links between science and management, hence the
symposium title: ‘measure to manage’. We have
certainly learned a lot in the process of compiling this
report, building on many people’s (and organisations)
state of the lake monitoring efforts. Good science
informs good management.
Hamish Rennie
Chair, Waihora Ellesmere Trust
Feedback on the report
Waihora Ellesmere Trust would like to hear your feedback on this report. What is missing, what do you want to know more about? What data exists that we have overlooked? If you have any comments please send them to [email protected].
Contents
Catchment map
4
Introduction 5
Governance and management 7
Economy 9
Land use and land cover
11
Water 15
Vegetation 19
Wildlife 23
Fish 25
Recreation 27
Cultural Health
29
¥
75¥
77¥
73¥
1¥
71¥
74¥
1¥
1¥
74 L I C re ek L II R iv er W oo d C re ek St yx R iv er St yx R iv er Ey re R iv er B og gy C re ek H ar ts C re ek Pe ra ki C re ek C ry er s C re ek Yo un gs C re ek O ka na S tr ea m D av ie s C re ek Te O ka S tr ea m Pr ic es S tr ea m K ai tu na R iv er W ai ak e St re am H aw ki ns R iv er B la ck s St re am H aw ki ns R iv er W as hp en C re ek H al sw el l R iv er H al sw el l R iv er W ai ri ri S tr ea m H or or at a R iv er H or or at a R iv er H ea th co te R iv er G le nd or e St re am W ai ke ke w ai C re ek W ai ke ke w ai C re ek A vo n R iv er /O ta ka ro W ai an iw an iw a R iv er W ai an iw an iw a R iv er K ou ko ur ar at a S tr ea m C am R iv er /R ua ta ni w ha Se lw yn R iv er /W ai ki ri ki ri Se lw yn R iv er /W ai ki ri ki ri Se lw yn R iv er N or th B ra nc h R ak ai a R iv er W ai m ak ar iri R iv er Se lw yn R iv er /W ai ki rik iri A vo n H ea th co te Ih ut ai E st ua ry M ou nt H er be rt /T e A hu P at ik i R ak ai a Li nc ol n Le es to n K ai ap oi M et hv en R an gi or a D ar fie ld H or or at a Ly tt el to n A S H B U R TO N R ol le st on D un sa ndel Sout
5
The importance of Te Waihora/Lake Ellesmere
Te Waihora/Lake Ellesmere is one of New Zealand’s most important wetland systems. The lake, New Zealand’s fifth largest by area, is a brackish, shallow lagoon with an average depth of 1.4 metres. The lake bed covers around 20,000 hectares. The lake’s catchment drains 276,000 hectares, and reaches from the foothills of the Southern Alps, to the Rakaia River, the hills of Banks Peninsula and the plains in between. The Waimakariri River has discharged to the sea several times through this area, possibly as recently as 5 – 600 years ago. Over many millennia, the area that is currently lake bed has switched back and forth between a lake and an estuary.
Since the second half of the 19th century, the lake has been situated in a predominantly agricultural catchment. The soils around Te Waihora/ Lake Ellesmere are extremely fertile and from the 1880s the level of the lake was reduced and the wetlands surrounding the lake were drained and reclaimed for agriculture. The lake level has been managed since by cutting channels through the Kaitorete Spit – a gravel barrier that separates the lake from the sea.
To Ngāi Tahu, as Kaitiaki, Te Waihora represents a major mahinga kai and an important source of mana. Te Waihora is a descriptive name, meaning spreading out waters. Under the Ngāi Tahu Claims Settlement Act 1998, ownership of the crown-owned lake bed was returned to Te Rūnanga o Ngāi Tahu.
Te Waihora/Lake Ellesmere is an area of cultural, natural, historic, recreational and commercial importance to many people. The outstanding values of the lake are recognised in a National Water Conservation Order as: habitat for wildlife, indigenous wetland vegetation and fish; and as being of significance in accordance with tikanga Māori in respect of Ngāi Tahu history, mahinga kai and customary fisheries. Internationally Te Waihora/Lake Ellesmere is significant for its birdlife abundance and diversity.
Different people hold different values for the lake and its environs. This brings challenges for the lake system and its resilience as an ecosystem, and for managing the important values people hold.
What is this report about?
This report presents a ‘health report card’ for Te Waihora/Lake Ellesmere as it is in 2013, and information about the area surrounding the lake, including what influences the lake’s health.
It is widely acknowledged that water quality, both in the lake and the surrounding tributaries, has declined over past decades due to increasing
Introduction
Te Waihora/Lake Ellesmere – State of the Lake 2013
Intr
oduction
Section 1
inflows of nutrients and sediment. A turning point in the health of the lake occurred in 1968 with the ‘Wahine’ storm which resulted in the loss of the lake weed beds which had created sheltered areas around the lake margins. This event helped cause the lake to ‘flip’, changing the ecology of the lake and further impacting on water quality and appearance. In 2005 Judge Smith, in an Environment Court case, talked about the concerns over water quality in the lake. The media reinterpreted this as declaring the lake ‘technically dead’, which is very far from the truth given the lake’s productivity and the range of species that make it their home.
In 2007, Waihora Ellesmere Trust held the first of the ‘Living Lake’ symposia at Lincoln University – an opportunity to set the record straight and look at the state of the lake and catchment and its management. A ‘State of the Lake’ report was published following the first symposium. A ‘Living Lake’ symposium has been held every two years since and this report, prepared for the 2013 symposium, provides an update to the 2008 report.
This report is for anyone with an interest in the lake – people who work and play in the area, decision makers and managers, industry and inter-est groups, and the wider community. The intention is, for organisations involved, to collaborate, improve where necessary, and repeat the health report card every two years, identifying trends and reporting on the many Te Waihora/Lake Ellesmere restoration initiatives underway.
Why do we need this report?
This report aims to show how the lake is changing, raising awareness of lake management issues and what is being done in response, including whether or not restoration actions are working. Importantly, we are aim-ing to strengthen links between science, monitoraim-ing and management.
How has this report been compiled?
Topics - Nine topics have been included in the report as sections based on topics identified, and reported on, in Te Waihora/Lake Ellesmere State of the Lake and Future Management, 2008.
Outcomes – There are many plans and policies (both statutory and non-statutory) which guide the management of Te Waihora/Lake Ellesmere. Outcomes have been included for each topic to summarise these. First we asked “how will we know when we have achieved success?” Then we expressed an outcome relative to plan and policy goals.
Indicators - indicators have been selected to enable regular reporting on progress towards achieving outcomes. We acknowledge some need further refinement.
Lead authors: Kenneth F. D. Hughey, Kirsty A. Johnston, Adrienne J. Lomax
6
Topic How will we know when we have achieved success? - main themes from a variety of planning documents
– Governance and management The role of Ngāi Tahu and kaitiakitanga is recognised in governance of the lake and catchment; there is integrated management of land and water use, with all activities operating at good practice or better, and the wider community included in decision making.
– Economy Sustainable water use supports economic development and lake/water related tourism opportunities increase.
– Land use and land cover Land use and development is integrated with water management; natural and cultural values are respected; all land use activities operate at good practice or better; communities are viable and growing.
– Water quantity and water quality Water quantity: Ecosystem and cultural health is restored and safeguarded; over allocation is reduced; water users have reliable water supplies, including for customary use, and recreational activities.
Water quality: Water quality is improved to sustain cultural values; indigenous and wildlife species are supported; drinking water is safe and water quality suitable for recreation.
– Vegetation Significant indigenous vegetation of the lake margin and tributaries streams is protected and restored, including wetland restoration and planting of riparian margins; pests are controlled.
– Wildlife Indigenous wildlife and associated habitats are protected and biodiversity increased. Pests and predators are reduced.
– Fish Native fish populations and associated habitats are protected and restored. – Recreation Compatible recreation needs are provided for, including good access, water
quality, and habitat for wildlife, including for sports fisheries.
– Cultural health Customary rights and use are recognised and mahinga kai species abundance and diversity is restored to a level to enable customary use.
Note: For the purpose of this report, the selection of indicators is specifically linked to the objectives for Te Waihora articulated in the Mahaanui Iwi Management Plan 2013.
Framework - State of Environment Reporting takes a variety of forms, many of which are built around variations of the OECD’s Pressure-State-Response framework. We have adapted this framework and will report on the state for each topic, and also consider the pressures (and, as appropriate, driving forces) and the range of responses in place. For state, pressure, and response we have identified indicators and, where possible, how those are being measured and any apparent trends over time.
Indicators are simply recognised as time-bound measures of change that are relevant to the topic being considered and which relate to desired outcomes. Indicators should be specific, measureable, attainable, relevant, time-bound and, if possible, already being measured. For this report we are including the relevant national and regional indicators already in use. Our focus is the lake, so the indicators selected relate to impacts on the lake or, in some cases, to the people using the lake.
To illustrate with a wildlife example, an agreed outcome is to protect indigenous wildlife and associated habitats. Consistent with this desired outcome, an indicator of state is abundance and distribution of wetland birds (one species we have focused on is wrybill, which is a national indicator species). The measure of this will be data collected by surveying bird populations. Pressure indicators include loss of habitat, which can be measured by area of different habitat types. The response indicators will include the number and success of habitat restoration programmes and the lake level management regime.
In many instances the state indicators for one topic will be linked to the pressure and response indicators for another. For example, the topic of vegetation includes, as a state indicator, area of different habitat types. The loss of preferred habitats is a pressure indicator for wildlife.
Individual authors, with expertise in the different topics, have produced the report cards, integrated here into one report to give an overview of the current state of the lake and its environs and, where possible, trends in selected indicators. Each report card has been reviewed.
Each report card draws on a more detailed report or set of reports, some of which have been produced in conjunction with the report card and others which are already available elsewhere. These more detailed sources are all listed on the Waihora Ellesmere Trust website (www.wet.org.nz).
Recommendations are made in relation to the indicators – are we measuring the right things? Where are the gaps? What
information is needed for good management? Leading up to the next symposium in 2015 the indicators will be reviewed and we will continue to report on the progress being achieved towards the desired outcomes.
State - abundance
and distribution of wetland birds and
other wildlife
Response indicators will
include the number and success of habitat restoration programmes
and the lake level management regime
Pressure -
indicators include loss of habitat Indigenous wildlife
and associated habitats are protected
Gover
nance and management
Context
The importance of Te Waihora/Lake Ellesmere is recognised in a National Water Conservation Order, which lists the lake’s outstanding features as wildlife habitat, habitat for indigenous wetland vegetation and fish, and significance in relation to tikanga Māori in respect of Ngāi Tahu history, mahinga kai and customary fisheries. All regional policy statements, regional plans and district plans must be consistent with the provisions of the Water Conservation Order.
A significant amount of lake margin land, approximately 35%, is administered by the Department of Conservation (DOC) and, under the Ngāi Tahu Claims Settlement Act 1998, ownership of the non-DOC administered crown-owned lake bed was returned to Te Rūnanga o Ngāi Tahu. All of these lands are managed under the Te Waihora Joint Management Plan prepared by Te Rūnanga o Ngāi Tahu and the Department of Conservation.
The catchment for the lake is large and activities throughout the catchment may impact on the lake and its tributaries. Many organisations play an important role in the governance and management of Te Waihora and its catchment. These include organisations with a statutory role (namely, Environment Canterbury, Selwyn District Council, Christchurch City Council, Department of Conservation, Ministry for Primary Industries, Fish & Game NZ, and Te Rūnanga o Ngāi Tahu), non-statutory organisations, and a range of interest groups whose views are taken into consideration. A diagrammatic explanation of the key parties involved in the governance and management of the lake and catchment is available on the WET website.
Ngāi Tahu and Environment Canterbury and the
Co-Governance arrangement for Te Waihora
Ngāi Tahu as tangata whenua have special status within Canterbury with respect to Environment Canterbury’s resource management activities. The Resource Management Act (1991) (RMA) gives regional councils specific obligations for Kaitiakitanga, the principles of the Treaty of Waitangi, the relationship between Māori and their culture and their traditions with their ancestral lands, sites, wāhi tapu and other taonga. Ngāi Tahu are not just another interest group.
As well as the RMA, Environment Canterbury has obligations under the Local Government Act (2002) (LGA) and specifically the Canterbury Water Management Strategy (CWMS). Through these, Environment Canterbury has committed to work with Ngāi Tahu to improve relations and work together better across all areas. The way this is done falls under the umbrella of the partnership joint work programme - Tuia. The governance group, Te Rōpū Tuia is made up of the chairs of the 10 Ngāi Tahu Papatipu Rūnanga and Environment Canterbury Commissioners.
Key Author: Karen Banwell, Environment Canterbury
In addition to Tuia and in also giving effect to specific targets in the Canterbury Water Management Strategy, the Te Waihora Co-govern-ance Agreement was agreed between Te Waihora Management Board (representing the tribal and Papatipu Rūnanga interests of Ngāi Tahu) and Environment Canterbury Commissioners. This is focused on how to achieve the rehabilitation and restoration of Te Waihora/Lake Ellesmere. Te Waihora is a tribal taonga, an important source of mana and a major source of mahinga kai for Ngāi Tahu and those who came before them. These values are recognised in the Ngāi Tahu Claims Settlement Act 1998 (NTCSA), the Te Waihora Joint Management Plan and more latterly in the 2011 amendment to the National Water Conservation (Te Waihora/ Lake Ellesmere) Order 1990 (WCO). Establishing a co-governance agreement for the active management of Te Waihora is a specific goal contained within the CWMS.
This Co-Governance Agreement establishes a dedicated framework for the active management of Te Waihora and its catchment. Te Waihora Co-governance concerns a range of decision-making that directly relates to Te Waihora and its management and includes the joint oversight of Whakaora Te Waihora, co-drafting of statutory plans for the lake and catchment and the review of regional and Selwyn-Waihora Zone Implementation Programmes, as well as the appointment of hearing commissioners. Whakaora Te Waihora is the shared restoration programme between Environment Canterbury, Ngāi Tahu and the Te Waihora Management Board and the Ministry for the Environment.
Other key organisations
Many other organisations play an important role in managing Te Waihora and its catchment. The Selwyn District Council and Christchurch City Council play a pivotal role in the management of the physical resources of the lake and catchment. All parties are working closely with these councils to ensure the special relationship is recognised and provided for appropriately under the new arrangements.
The Department of Conservation has specific responsibilities for Te Waihora. In addition, to their responsibilities to promote the conservation of natural resources under the Conservation Act 1987, DOC has functions under the NTCS Act to prepare and administer the Joint Management Plan. This statutory plan was completed in 2005. As noted above, DOC is also responsible for managing several reserve areas around the lake.
There is also provision for discussions with key stakeholders and community groups on the part they will play in the long term management of Te Waihora.
Governance and management
Te Waihora/Lake Ellesmere – State of the Lake 2013
Gover
nance and management
Lead author: Karen Banwell, Environment Canterbury
How will we know when we have achieved success?
The role of Ngāi Tahu and kaitiakitanga is recognised in governance of the lake and catchment; there is integrated management of land and water use, with all activities operating at good practice or better, and the wider community included in decision making.
Section 2
looking along Kaiterete spit towards Taumutu
7
Tā Mark Solomon, Kaiwhakahaere, Te Rūnanga o Ngāi Tahu;8
More information
Links to key documents and other relevant information are available from the WET website.
For background, context and information about other values associated with Te Waihora Ellesmere please see the other sections of the 2013 State of the Lake Report www.wet.org.nz/projects/2013-state-of-the-lake/
Organisation What they do Some relevant management instruments
Te Rūnanga o Ngāi Tahu Te Waihora
Management Board
– Owner of the lake bed
– Aboriginal/customary rights and interests – Joint holder lake opening consent
– Manage commercial fishing activities on lakebed – Represent Papatipu Rūnanga
– Joint Management Plan implementation – Whakaora Te Waihora Joint Plan implementation – Statutory Advisor to Fish & Game Councils – Advocacy
Whakaora Te Waihora (WTW) Co-governance agreement Mahaanui Iwi Management Plan 2013 (IMP)
Lake opening consent
Te Waihora Joint Management Plan WTW Plan
Environment Canterbury – Joint holder lake opening consent – Manage drainage & flood control schemes – Administer reserves and land management – Implement regional pest management strategy – Resource consents and compliance monitoring – Monitoring and investigations
– Biodiversity enhancement work – Regulation of navigation
– Whakaora Te Waihora Joint Plan implementation
WTW Co-governance agreement Lake opening consent
Flood Protection & Drainage Bylaw WTW Plan
Land & Water Regional Plan Monitoring and response protocol for cyanobacteria
Department of
Conservation – Joint Management Plan implementation– Land management – Species management – Wildlife Act
– Administration of the whitebaiting regulations – Conservation advocacy
Canterbury Conservation Management Strategy
Te Waihora Joint Management Plan
Selwyn District Council – Land management / stormwater – Manage drainage schemes – Administer reserves
– Land use resource consents and compliance monitoring – Biodiversity enhancement work
District Plan
Monitoring and response protocol for cyanobacteria
Christchurch City Council – Land management / stormwater
– Administer reserves and land management
– Land use resource consents and compliance monitoring – Biodiversity enhancement work
City Plan
Monitoring and response protocol for cyanobacteria
Fish and Game North
Canterbury – Hunting and shooting access and licences– Administer Maimai Agreement with TRoNT & DoC – Manage reserve
– Conservation advocacy
– Trout fishery management and monitoring
Te Waihora Joint Management Plan, Maimai Agreement
Community and Public Health, Canterbury District Health Board
– Water warnings – drinking and recreation Monitoring and response protocol for cyanobacteria National Environmental Standard for Sources of Human Drinking Water
Ministry of Primary
Industries – Customary fisheries and associated regulations– Administer Quota Management System
Universities & Crown
Context
The Te Waihora/Lake Ellesmere catchment lies mainly in Selwyn District. The District population and economy are growing faster than in any other New Zealand district. There is significant change occurring in the mix of enterprises present as dairy farming and milk processing expand. Employment growth in Selwyn District was the strongest in New Zealand in 2012 at 9.5%, approximately 1200 new jobs. Availability of water for irrigation impacts pastoral production levels. The Central Plains Water scheme will increase the area that can be irrigated from 2015 onwards. There is significant daily out and in migration as Selwyn residents commute to work in Christchurch and tertiary students, and employees commute to study or work in Selwyn District.
A small set of economic indicators has been identified. These can be used to report on at regular intervals, to describe the current economic state of the catchment, to identify trends, and to discuss pressures and responses in a general sense. While most of the Te Waihora/Lake Ellesmere catchment is within Selwyn District, small areas to the east do lie within Christchurch City. This analysis considers only the Selwyn component. Selwyn District is a recognised statistical region. Some time series data are available as economic activity indicators.
Sustainable development is an overarching goal of the Council on behalf of residents in the Te Waihora/Lake Ellesmere catchment. Income is an important contributor to human well being, but other factors also contribute to well being including quality of the nearby physical environment. Degrading parts of the environment may lower short-term production costs but eventually reduce resident’s well-being. An economy that is on track to sustainable development will enable citizens in the relevant region to have non-declining levels of welfare over time.
Data sources, availability and state
A limited number of indicators of economic activity and drivers of economic activity in Selwyn District are readily available from Statistics New Zealand, Infometrics, DairyNZ and other sources. The first nine indicators in the table below provide a range of measures to track economic activity levels in Selwyn district. They include a comprehensive activity measure (GDP); input measures (employment, business units, number of cows); demand indicators (new residential consents, average house price); a measure of inactivity (number of working age beneficiaries); and a measure of public sector activity (SDC total operating expenditure). Data are expressed as percentage change over previous year.
Water is a critical input to production and consumption in the district. Area irrigated and water use is likely to increase in the next few years as supply is augmented by completion of the Central Plains Water scheme. Tracking water use would allow calculation of ratios including: GDP/ water use and total employment/water use. Change in these ratios over time will indicate if there is any evidence of decoupling.
Three indicators are included that are more tightly centred on Te Waihora/Lake Ellesmere. The first two capture commercial activity near the lake that contributes to income and well-being for nearby residents. The final indicator is an estimate of the amount of recreation near or at the lake. Regular updates for the final four measures in the table should be completed biennially to help track sustainable development in the catchment.
Economy
Te Waihora/Lake Ellesmere – State of the Lake 2013
Economy
Lead author: Ross Cullen, Lincoln University
How will we know when we have achieved success?
Sustainable water use supports economic development and lake/water related tourism opportunities increase.
9
Selwyn census 2013
Kelvin Coe, Selwyn District Mayor
“
Selwyn is well placed to absorb the growth
that we are currently experiencing
”
.
Selwyn was a participant in the Greater Christchurch Urban Development Strategy in 2007 along with Waimakariri and Christchurch City in planning for growth through to 2041 but unlike them Selwyn’s infrastructure and residentially zoned land remained intact following the earthquake - no ‘red zones’ - so the planning for growth is already in place.
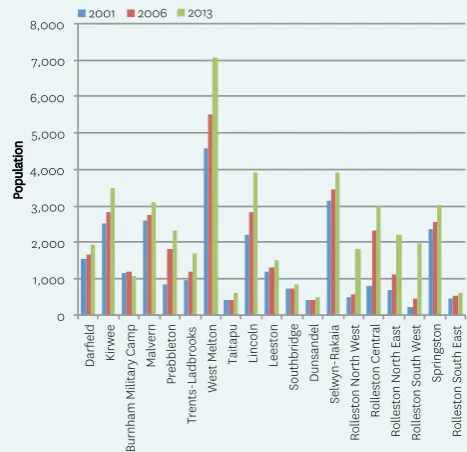
Kelvin Coe acknowledges that growth comes at a cost. “Upgrades to the roading network, stormwater systems to filter pollutants, improved recreational facilities and a new waste water treatment and disposal system at Rolleston to allow for the sustainable discharge of treated sewerage to land have been needed. There is enough land set aside to cater for 80,000 people equivalents in this scheme”. Recent census data, shown in figures 3.1 and 3.2, illustrate the significant changes in Selwyn’s population.
Section 3
0 1,000 2,000 3,000 4,000 5,000 6,000 7,000 8,000
Darfield Kirwee
Burnham Military Camp
Malvern
Prebbleton
Trents-Ladbrooks
West Melton
Taitapu Lincoln Leeston Southbridge Dunsandel
Selwyn-Rakaia
Rolleston North West
Rolleston Central
Rolleston North East Rolleston South West
Springston
Rolleston South East
Po
pu
la
tio
n
2001 2006 2013
Figure 3.1 Selwyn census area growth 2001 - 2013.
0 10,000 20,000 30,000 40,000 50,000
2001 2006 2013
10
More information
Additional information and links are available from the WET website.
For background, context and information about other values associated with Te Waihora Ellesmere please see the other sections of the 2013 State of the Lake Report www.wet.org.nz/projects/2013-state-of-the-lake/
Economic Indicator (and date data is available from)
Selwyn District One year
percent change Source
GDP (March 2012) $820 m 1.1 Infometrics 03.2012
Total population (30/6/2012) 42,300 2.9 STATS, DPE052AA
Total employment (February 2012) 13,920 8.6 TABLECODE2310#
Income tested benefit recipients age 18–64, June 2013 quarter 815 10.6 MSD TLA Benefit Factsheets
Business units (February 2012) 5407 1.1 TABLECODE2310#
Total cows (2011/12) 145,202 4.9 DairyNZ 2012
SDC total operating expenditure 2012 $67,368,000 20.7 STATS, LAF003AA
New residential consents, annual September 2012 $206,535,054 70.3 STATS, BLD063AA
House price average, July 2013 $469,825 10.3 WWW.QV.CO.NZ
Total irrigated area 99,120 Williams 2010, p.20
Agriculture output - closest 14,250ha, $34 million Butcher 2009, p.105
Waihora-Ellesmere associated quota value $1,830,000 ò MPI, Butcher 2009
Recreation visits est. (26,950 x $40/day) $1,078,000 Hughey, 2013
Pressures
Economic activity in Selwyn District is buoyant and driven by population increase, new businesses commencing, enterprise conversions to dairy farming, and business expansions. Planned water infrastructure schemes will irrigate a further 30,000 ha of land in Selwyn.
Economic activity surrounding the lake is influenced by water levels, amount of land reserved for conservation or recreation, output prices, costs of production, and fluctuations in biological productivity. More broadly, many factors drive economic activity levels in Selwyn District including population growth, new business startups, water availability, investments in irrigation, commodity prices, relocation of people and businesses following the Christchurch earthquakes. Growth of population and economic activity increases demand (pressure) on labour, buildings, urban infrastructure, electricity supply, water supply, commercial and residential land.
Responses
Proposals to tackle water quality and nutrient levels in Te Waihora/Lake Ellesmere (groundwater/ surface water balance, on farm nutrient management, lake and riparian management) are likely to impact agriculture, fishing, mahinga kai and recreation. Estimation of the latter four indicators in the table will provide basic measure of the impacts on those four activities.
References
AERU (2009). Selwyn – Economic Base of the District. AERU, Lincoln University.
Butcher, G.V. (2009). Economic values. Ch 10 in Hughey, K.F.D. and Taylor K.J.W. (eds). 2008. Te Waihora/Lake Ellesmere: State of the Lake and Future Management. EOS Ecology, Christchurch. Hughey, K.F.D. (2013). See recreation section of this report.
Williams, H. (2010) Groundwater resources in the Te Waihora/Lake Ellesmere catchment: management issues and options. Report R10/05, Environment Canterbury, Christchurch.
Conclusions and
recommendations
Statistics New Zealand regularly compiles and releases business and economic data including for Selwyn District. A detailed study of economic capability and activity in Selwyn was completed in 2009 (AERU 2009). Quarterly monitoring of economic activity in Selwyn (and all New Zealand TLAs) is completed by Infometrics, and BERL. Environment Canterbury (ECan) should fund access to a quarterly report to ensure timely, consistent economic activity indicators are available. ECan should annually calculate total irrigated area in Waihora-Selwyn catchment. ECan should fund two-yearly calculation of the four indicators focused on economic activity around or on Te Waihora/Lake Ellesmere so that activity is measured at a finer scale than at District level.
11
Land use and land cover
Te Waihora/Lake Ellesmere – State of the Lake 2013
Lead author: Kirsty A. Johnston, with Ian Brown, Michael Fletcher, Zach Hill, Ognjen Mojsilovic and Howard Williams, Canterbury Regional Council.
How will we know when we have achieved success?
Land use and development is integrated with water management; natural and cultural values are respected; all land use activities operate at good practice or better; communities are viable and wellbeing is enhanced through sustainable development.
Context
Measures of land cover and land use are often talked about interchangeably. Both are descriptive indicators for state of the environment reporting. Land cover is the physical material at the earth’s surface, such as forests, pasture, water, or asphalt. Land use is the activity or economic function to which people put the land, such as forestry, sheep or beef farming, recreation, or urban settlement.
Land cover is a state indicator, describing quantity and quality. It reflects changes in land use. Land use is a pressure indicator and tells us something about the driving forces that change environmental conditions. Measuring and reporting changes in land cover and land use, over time, are fundamental to understanding and managing the driving forces contributing to the state of Te Waihora/Lake Ellesmere. Catchment land use and land cover, past, present and future, are inextricably linked with the state of the lake and its environs.
State: Land cover
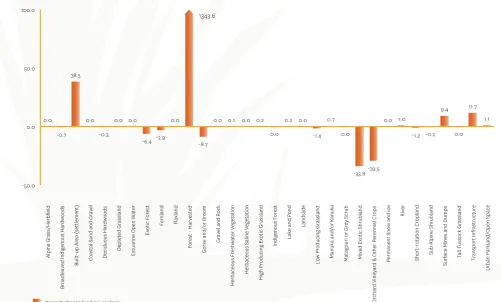
Changes in land cover in the Selwyn District, including the current state, reflect changes in land use influenced by population growth and shifts in business enterprise (refer Economy section). The Land Cover Database (LCDB), derived from satellite photography, reports standardised land cover classes. Figure 4.1 shows the precent change in land cover class for the Selwyn District between 1996/97 and 2007/08 (i.e. between LCDB1 and LCDB3). Figure 4.2 shows the LCDB3 mapped for the Selwyn District, plus the area of the Te Waihora catchment which is within Christchurch City (the eastern part of the lake, including Kaitorete Spit). The total area mapped represents the Selwyn Waihora Zone of the Canterbury Water Management Strategy (CWMS). Notable changes in land cover between 1997 and 2007 can be summarised as follows:
● Forest harvested (large increase: 1343%) ● Built up area (moderate increase: 38%) ● Transport infrastructure (small increase: 11%) ● Mixed exotic shrubland (moderate decrease: -33%)
● Orchard, vineyard and other perennial crops (moderate decrease: -29%).
LCDB4 (2012/13 satellite imagery) is due for release in 2014, at which time further changes in land cover since 2007 can be analysed and reported.
Figure 4.1: Percent change for each land cover class between LCDB1 (1996/97) and LCDB3 (2007/08) Source: Environment Canterbury 2013; LCDB1 and LCDB3 statistics.
0.0 -0.7
38.5
0.0 -0.3
0.0 0.0
-6.4 -2.9 0.0
-8.7
0.0 0.1 0.0 0.2 0.0
0.2 0.0
-1.4 0.7
0.0
-33.8 -29.5 0.0 1.0
-1.2 -0.2 9.4
0.0 11.7
1.1
-50.0 0.0 50.0 100.0
Alpine Grass/Herbfield
Broadleaved Indigenous Hardwoods
Built-up Area (settlement) Coastal Sand and Gravel Deciduous Hardwoods
Depleted Grassland
Estuarine Open Water
Exotic Forest
Fernland Flaxland
Forest - Harvested
Gorse and/or Broom
Gravel and Rock
Herbaceous Freshwater Vegetation
Herbaceous Saline Vegetation
High Producing Exotic Grassland
Indigenous Forest Lake and Pond
Landslide
Low Producing Grassland Manuka and/or Kanuka Matagouri or Grey Scrub Mixed Exotic Shrubland
Orchard Vineyard & Other Perennial Crops
Permanent Snow and Ice
River
Short-rotation Cropland Sub Alpine Shrubland
Surface Mines and Dumps
Tall Tussock Grassland Transport Infrastructure
Urban Parkland/Open Space
Percent change land cover class
1343.6
Land use and land cover
Section 4
Pressures: Land use change
Pressure indicators describe the factors which change environmental conditions, including factors causing environmental problems. For Te Waihora/Lake Ellesmere, land use change is a primary pressure indica-tor. Pressures from land use on the lake and its environs include: ● Contaminants from point and non-point sources making their way
off land and into the lake through various pathways, e.g., soils, surface water, groundwater.
● Urban/rural expansion leading to loss of indigenous/mahinga kai plants, animals and habitats, including for lake wildlife, e.g., vegetation clearance.
● Cumulative impacts from diffuse sources of contaminants over large areas where there is a lag time between the leaching of contaminants and the appearance of symptoms in the lake, or its tributaries, e.g., catchment nitrogen and phosphorus loads from agriculture. – Contaminants include nutrients (nitrogen and phosphorus),
micro-organisms and other toxic or harmful contaminants (e.g. organic compounds such as sewage effluents, pesticides), and sediments (Land and Water Forum. 2012).
– Rivers and lakes receive nutrient inputs from sources such as fer-tilisers, grazing stock and sewage discharges. Microbial inputs are received from stock, municipal sewage, urban stormwater, birdlife and some industrial discharges. Toxic or harmful compounds, including metals, pesticides and hydrocarbons, are released into rivers and lakes particularly from residential and industrial stormwater, industrial discharges and some agricultural activities, for example pesticide use. Sedimentation can occur as a result of reduced riparian protection and from activities such as stock ac-cess to waterways, bank erosion and land development. Channel modifications and maintenance for land development also have impacts (Canterbury Regional Council. 2009).
Figure 4.3: Rural land use change in the
Selwyn Waihora catchment between 2003 and 2013 Source: AgriBase, AsureQuality, 2003; 2013. Environment Canterbury 2013. Figure 4.2: Land Cover Database 3 (2007/08) mapped for the Selwyn District/ Selwyn Waihora CWMS zone.
13
Figure 4.4: Rural land use in the Selwyn Waihora catchment 2003Source: AgriBase, AsureQuality, 2003; 2013; Environment Canterbury 2013.
Figures 4.5: Rural land use in the Selwyn Waihora catchment 2013 Source: AgriBase, AsureQuality, 2003; 2013; Environment Canterbury 2013.
Figure 4.6: Changes in livestock numbers between 2007 and 2012 Source: Statistics New Zealand Agricultural Census 2007; 2012: Livestock Numbers by Type and Territorial Authority.
Figure 4.7: Changes in livestock numbers between 2007 and 2012 Source: Statistics New Zealand Agricultural Census 2007; 2012: Livestock Numbers by Type and Territorial Authority.
(Note scale for goats, horses, alpacas/llamas is different)
Figure 4.8: Changes in irrigated area 1960 to 2011 – indicative only
(Irrigated area calculated by summing estimated groundwater allocation on the face of issued resource consents. Actual water use will differ and is likely to be in the range of 40 to 50% of consented allocation. Data should be treated as annual estimates to summarise the change in irrigation area and allocated groundwater for the combined Selwyn Waimakariri and Rakaia Selwyn groundwater zones for the years reported).
Source: Environment Canterbury 2011.
0 200,000 400,000 600,000 800,000 1,000,000
dairy cattle beef cattle sheep deer pigs Change in livestock numbers Selwyn-Waihora
2007 2012
0 500 1,000 1,500 2,000 2,500 3,000 3,500 4,000 4,500 5,000
goats horses alpacas/ llamas
Change in livestock numbers Selwyn-Waihora
2007
2012
Figure 4.3 shows the percentages of changes in rural land use between 2003 and 2013 for the Te Waihora/Lake Ellesmere catchment.
Figures 4.4 and 4.5 map rural land use for the Te Waihora/Lake Ellesmere catchment in 2003 and 2013, showing the changing mix of farm activities across the catchment.
Figures 4.6 and 4.7 show the changes in livestock numbers in the Selwyn District between 2007 and 2012.
Figure 4.8 shows changes in irrigated area (indicative only) between 1960 and 2011 for the Ellesmere-Waihora irrigation area based on consented groundwater allocations. This time frame is used because these years comparisons are what is available to provide an indication of trend.
Notable changes in land use between 2003 and 2013 can be summarised as follows:
● drystock farming (sheep and beef, beef, deer) decreased ● cropping and horticulture decreased
● contract grazing increased ● lifestyle blocks increased ● dairy farming increased ● irrigation increased.
(Colours in figures 4.4 and 4.5 match those in the key for rural land use change in Figure 4.3)
14
More information
Additional information and links are available from the WET website.
For background, context and information about other values associated with Te Waihora Ellesmere please see the other sections of the 2013 State of the Lake Report www.wet.org.nz/projects/2013-state-of-the-lake/
What should be measured?
The suggested minimum set of land indicators for state of the lake reporting is listed below.
Driving forces State Pressures Responses
● Population changes and economic growth in the District
● Commodity prices; primary production and sectorial trends in the catchment
● People’s values for land, and environmental attitudes about the lake.
● Change in land cover for each land cover class, both around the lake shore, in the wider catchment, and for the district/ CWMS zone.
● Change in land use for each major land use class, both around the lake shore, in the wider catchment, and for the district/ CWMS zone ● Change in livestock numbers in
the District
● Change in irrigated land area in the wider catchment.
● Number and coverage of farm plans, including number audited, by land use type
● Change in length of riparian buffer margins along waterways, and around the lake shore
● Area of land protected around the lake shore, in the lake catchment, and for tributary streams.
References
Canterbury Regional Council. 2009. Canterbury Regional Environment Report 2008. Christchurch. Canterbury Regional Council. http://ecan.govt.nz/publications/Pages/ regional-environment-report.aspx
Land and Water Forum. 2012. Third Report of the Land and Water Forum: Managing Water Quality and Allocating Water October 2012. Wellington: Land and Water Trust. http://www. landandwater.org.nz/
Which driving forces?
Driving forces influence changes in land use, and are reflected in land cover. Driving forces have social and economic links. Social links include things like population changes, income levels and distribution, education, peoples’ values and environmental attitudes. Economic links include market forces (commodity prices, exchange rates), employment, economic growth and sectorial trends.
Driving forces influence overall levels of production and consumption which, in turn, apply pressures on the environment (Ministry for the Environment, 2007). This can be through changes in land use. Indicators that report statistics about sectorial trends in the catchment from which pressures arise are particularly important for reporting on the state of the lake and its environs.
The indicators in the economy chapter include driving forces. Mapping land use and land cover change, and interpreting this together with driving forces statistics, provides context for state of the environment reporting on the lake, including for land and water management.
What responses?
Response indicators demonstrate the efforts people make to solve environmental problems, including mitigating pressures and the impacts that arise from these. For Te Waihora and its environs, responses include, for example:
● setting water allocation limits
● setting catchment nutrient loads from agriculture ● excluding stock from waterways
● the use of farm environmental plans ● providing for ecological flows in waterways ● establishing riparian buffer margins
● the use of lake interventions such as lake openings ● funding and projects for restoring and protecting native
vegetation and biodiversity.
Discussion and recommendations
“Measure to manage” implies that the right information is available at the right time for management purposes. For state of the environment reporting this means that information about driving forces, and changes in state, pressures and impacts must be regularly available over time, and at a relevant scale, to inform responses. Identifying what information is the right information is the challenge, together with being very clear about the ‘measuring’ (and reporting) purpose (in this case, for land and water management).
Through Te Waihora living lake symposia, measures have been identified and reported concerning values for the lake: cultural health, recreation, lakeshore vegetation, fisheries, wildlife, water quality, etc. For land,
measures have included information about its economic value and the impacts on these values from proposed changes to the management of the lake and inflowing waterways (Hughey and Taylor et al. 2008). Five years on, it is important to consider land not simply from the perspective of its economic value, but also from the perspective of the pressures that arise from deriving such value. A systems approach to thinking about the complexity of relationships associated with the lake must include measures giving useful detail of land cover, land use and land use intensity.
Have we got the right information?
Yes, but improvements could include:● Combine social, cultural, economic and environmental data for reporting purposes to better effect. In this way, we can enhance our understanding of what drivers and activities across the catchment influence changes in the state of Te Waihora, and regionally over time. ● Better match geospatial boundaries for monitoring data. For
example, some data are available for the Selwyn District, other for the Te Waihora/Lake Ellesmere catchment. The two are different but closely related.
● Consider the need for other land use indicators, e.g. soil erosion, soil health, nutrient budgets and land use capability. Are they important for state of the lake reporting, and if so, why? Or are they more appropriate for operational monitoring and scientific investigations. ● Make more use of geographic information systems to map monitoring
data for reporting purposes. In this way, people can see how various driving forces, pressures, changing states and responses relate ‘on the ground’ to where people live, work and enjoy leisure and recreation activities.
● Progressively fill information gaps for state of the lake indicators which, as yet, have minimal data available for reporting. For example, many of the response indicators for land relate to more recent actions and initiatives. It will be important that ‘response’ monitoring is planned and implemented as these initiatives get underway.
Land Cover Database series (LCDB) - a geographically spatial (satellite) map of New Zealand’s land cover that is compiled at 5-yearly intervals from 1996/97. http://lris.scinfo. org.nz/file/330-lcdb-cover-class-change-summary/
15
Water
Te Waihora/Lake Ellesmere – State of the Lake 2013
W
ater
Lead author: Kimberley Robinson and Tim Davie, Environment Canterbury
How will we know when we have achieved success?
Water quantity: Ecosystem and cultural health is restored and safeguarded; over allocation is reduced; water users have reliable water supplies, including for customary use, and recreational activities.
Water quality: Water quality is improved to sustain cultural values; indigenous and wildlife species are supported; drinking water is safe and water quality suitable for recreation.
Section 5
Context
Te Waihora/Lake Ellesmere is a large coastal lake formed behind a coastal beach, intermittently open to the sea. Surface water inflow is largely from groundwater flowing into the lake’s catchment, in turn sourced from rainfall recharge and seepage from rivers. Being a lowland lake, Te Waihora not only receives inputs that affect water quality within the immediate vicinity of the lake, but also from the wider catchment across the plains up to the foothills (Hughey and Taylor et al. 2008). The Te Waihora outlet occurs at a narrow section at the southern end of Kaitorete Spit. The artificial opening of the lake, at this outlet, is a critical management intervention that has impacts upon the water quality, fish populations (both in the lake and in tributaries) and water levels on and under surrounding land. The water balance of the lake is dominated by rainfall, tributary inflows, outflows through the opening cut and, evaporation (figure 5.1).
Figure 5.1: Average water balance for Te Waihora/Lake Ellesmere 1987-2007 (from Renwick et al., 2010).
Se a infl ow s thr ou gh cut Gr oundw at er infl ow Se a infl ow s thr ou gh cut
Rainfall on lak
e Av er ag e r at e (m ³/s ) Tr ibutary infl ow s out flow s thr ou gh cut Evapor ation fr om lak e Bar rier seepag e 15 10 5 0 -15 -10 -5
Rainfall and lake levels
In the previous two years there have been four months where rainfall has been significantly above average (October 2011, August 2012, May 2013 and June 2013 – see figure 5.2). The largest rainfall was in June 2013 which resulted in significant flooding around the lake as it took several days to get the lake open.
Figure 5.2: Rainfall at Tai Tapu
(Environment Canterbury Ryans Bridge recorder).
0 50 100 150 200 250
Jul Aug Sep Oct Nov Dec Jan Feb Mar Apr May Jun
Rainfall (m
³/s)
2011/12 2012/13 Average
Rainfall is a major driver in the lake water balance through both what falls on the lake and the additional water coming in via tributaries. This can clearly be seen in figure 5.3. Also evident from figure 5.3 is the long period in early 2013 when the lake stayed open and low.
Figure 5.3: Average monthly lake level and monthly rainfall (Tai Tapu) from July 2011 to August 2013.
0 0.2 0.4 0.6 0.8 1 1.2 1.4 0 50 100 150 200 250
Jul-11 Aug-11 Sep-11 Oct-11 Nov-11 Dec-11 Jan-12 Feb-12 Mar-12 Apr-12 May-12 Jun-12 Jul-12 Aug-12 Sep-12 Oct-12 Nov-12 Dec-12 Jan-13 Feb-13 Mar-13 Apr-13 May-13 Jun-13 Jul-13 Aug-13
Rainfall total(mm) Average lake level
State: Water quality and ecosystem health
Environment Canterbury routinely monitors surface water quality at a number of sites in Te Waihora/Lake Ellesmere and its tributary streams (figure 5.4). Five lake sites are sampled monthly by boat, with additional shore sites monitored during periods of potentially toxic cyanobacteria blooms. Tributary streams, including a number of recreational water quality sites, are monitored monthly for water quality and aquatic ecosystem health. Groundwater quality is sampled annually as part of a region wide monitoring programme which includes approximately 50 wells in the Te Waihora catchment.
Figure 5.4. Routine surface water monitoring sites for Te Waihora/ Lake Ellesmere and its catchment.
Lake Trophic Status
The lake trophic status for Te Waihora/Lake Ellesmere is measured by the Trophic Level Index (TLI), and is an indicator of enrichment based on measurements of nutrients, algae and water clarity. Note, the trophic level index does not describe the water quality of the lake, rather the condition of the lake.
Te Waihora/Lake Ellesmere has consistently been in a hypertrophic state for the 20 years that it has been sampled. There has been a small decrease in TLI (figure 5.5) since the lake was identified as having the highest TLI in the country (Verburg et al., 2010). In the most recent year of monitoring, unusually low nutrient and chlorophyll a (a measure of algae/phytoplankton) concentrations, in response to prolonged periods of lake openings, have seen a shift in trophic state to supertrophic (figure 5.5). Prolonged periods of seawater intrusion may however have detrimental effects on lake and
Hypertrophic Supertrophic Eutrophic Mesotrophic Oligotrophic TLI
increasing nutrients and phytoplankton
decreasing clarity
Figure 5.5. Te Waihora/Lake Ellesmere trophic status.
2.0 3.0 4.0 5.0 6.0 7.0 8.0
2004-06
2007 2008 2009 2010 2011 2012 2013
Tropic level index
Inde
x l
ev
el
Water Quality of Tributary Streams
For tributary streams in the Te Waihora/Lake Ellesmere catchment parameters such as nutrients, clarity and bacteria are measured and used to calculate the water quality index.
In the Te Waihora/Lake Ellesmere catchment, tributary streams are generally of poor to fair water quality according to the water quality index, however, in recent years, the Waikekewai Creek site has improved to “Good” (figures 5.6a and 5.6b).
Figure 5.6a. Percentage of Water Quality index grades for streams within Te Waihora/Lake Ellesmere catchment.
0% 10% 20% 30% 40% 50% 60% 70% 80% 90% 100%
2009-11 2010-12 2011-13
Water Quality Index for Stream within the Catchment
Per
cent of gr
ade
s within ca
tchment Very Good
Good Fair Poor Very Poor
Figure 5.6b. Current Water Quality Index grades for streams within the Te Waihora/Lake Ellesmere catchment.
Aquatic Ecosystem Health of Tributary Streams
Aquatic ecosystem health is measured by habitat grades and
invertebrate grades. Invertebrates, which live in the stream year round, are a good indicator of stream health as they respond to changes in water quality and their physical habitat, e.g., increases in sediment or algae. Some species of invertebrates are more sensitive to water pollution and are therefore not present in abundance in streams of degraded water quality.
Aquatic ecosystem health is variable in tributary streams in the Te Waihora/Lake Ellesmere catchment. In the 2012 monitoring season, sites with poor or very poor invertebrate grades generally reflected sites with poor or very poor habitat grades (figure 5.7). However, in most recent years (2010-2012), there has been a trend of increasingly poor habitat grades throughout the catchment. Poor sites are dominated by pollution tolerant invertebrates typical of soft-bottomed sites, such as worms, snails and midges; sites of good or very good invertebrate quality typically have more generalist/pollution sensitive species.
Figure 5.7. Current aquatic ecosystem health for streams within the Te Waihora/Lake Ellesmere catchment (December 2012).
Causes of poor ecosystem health may include high sediment inputs to the basin streams as a result of stock access and run off, lack of intact riparian vegetation, excessive in-stream plant growth as a result of high nutrient inputs, and reduced or intermittent flows for significant portions of the year.
Recreational Water Quality
Recreational water quality is monitored over the summer months at popular bathing sites along the Waikirikiri/Selwyn River and for Te Waihora/Lake Ellesmere. Suitability for recreation grades are calculated from microbiological results (Escherichia coli) and a qualitative risk assessment (sanitary inspection category) for each site, describing the general recreational condition of a site. Sites graded ‘poor’ and ‘very poor’ are generally considered unsuitable for contact recreation. Suitability for recreation decreases moving downstream for the Waikirikiri/Selwyn River with the upper stream site graded good, and the two downstream sites both unsuitable for recreation with grades of poor and very poor (figure 5.8, Table 5.1).
17
Table 5.1: Suitability for recreation grades for Te Waihora/Lake Ellesmere and Waikirikiri/Selwyn River2003-04 2004-05 2005-06 2006-07 2007-08 2008-09 2009-10 2010-11 2011-12 2012-13
Te Waihora/Lake Ellesmere
Poor Fair Fair Fair Fair Good Good Good Good Fair
Waikirikiri/Selwyn River -
Chamberlains Ford Good* Good Good Good Good Fair Good Good Good Good
Waikirikiri/Selwyn River -
Coes Ford Poor* Fair* Poor Very poor Very Poor Very Poor Very Poor Poor Poor Poor
Waikirikiri/Selwyn River -
Upper Huts Poor Poor Poor Poor Poor Poor Poor Very Poor Very Poor Very Poor
17
Potentially Toxic Cyanobacteria
While recreational water quality in Te Waihora/Lake Ellesmere is graded fair or good when based on E. coli, there is potential for the lake to become unsuitable for recreation in the presence of harmful cyanobacteria blooms. Cyanobacteria blooms can pose a risk to human and animal health due to the production of cyanotoxins. In the presence of cyanobacteria blooms, a public health warning is issued for the lake. Potentially toxic cyanobacteria is monitored as part of the routine monitoring programme by boat in Te Waihora/Lake Ellesmere, with additional shore sites monitored in response to bloom warnings for the lake. Cyanobacteria blooms generally occur during the summer months in Te Waihora/Lake Ellesmere, especially at the Kaituna, Fishermans Point and Lakeside Domain sites. These three sites are monitored from the shore in response to a bloom status from routine sampling. In the summer of 2012–13, the lake was open to the sea for a prolonged period, resulting in an increased salinity of the lake which produced less favourable conditions for algal blooms to grow. The typical Anabaena or Nodularia blooms were not observed, however, concentrations of potentially toxic picocyanobacteria exceeded the threshold (figure 5.9), and hence the lake had a public health warning issued.
Figure 5.9: Potentially toxic cyanobacteria biovolumes for selected sites in Te Waihora/Lake Ellesmere.
0 5 10 15 20 25 30 35 40
18-Feb-09 18-Apr-09 18-Jun-09 18-Aug-09 18-Oct-09 18-Dec-09 18-Feb-10 18-Apr-10 18-Jun-10 18-Aug-10 18-Oct-10 18-Dec-10 18-Feb-11 18-Apr-11 18-Jun-11 18-Aug-11 18-Oct-11 18-Dec-11 18-Feb-12 18-Apr-12 18-Jun-12 18-Aug-12 18-Oct-12 18-Dec-12 18-Feb-13 18-Apr-13 18-Jun-13
Po
te
nt
ia
lly
T
ox
ic
C
ya
no
ba
ct
er
ia
B
io
vo
lu
m
e
(m
m
3/
L)
Mid Lake Off Selwyn River Mouth Sth of Timber Yard Pt
Kaituna Fishermans Point Lakeside Domain
Taumutu Toxicity Threshold
Groundwater quality
Groundwater is used extensively in the Te Waihora catchment for drinking water. Results from the Spring 2012 groundwater quality survey showed no wells where E. coli was detected. The majority of wells are less than 50m in depth.
The nitrate nitrogen concentrations shown in figure 5.10 indicate that near the lake the groundwater is at close to natural concentrations (less than 2.8 mg/l). Further up towards SH1 the nitrate nitrogen concentrations were higher.
No monitoring of groundwater fauna is undertaken at this time.
Figure 5.10: Nitrate nitrogen concentrations recorded in groundwater during Spring 2012.
State: Water quantity
Stream and river flows are measured continuously on five tributaries of the lake, and lake level is recorded at two sites (Taumutu and Kaituna).
Lowland stream flows
The current state of lowland streams in the Te Waihora catchment has been impacted by the long term effects of abstraction. Many of the streams which currently go dry are, anecdotally, reported as previously flowing year round. The streams have been affected to varying degrees depending on their location and the major source of flow. The flows in the L-2 and Harts Creek have higher baseflows than the Selwyn, Irwell and Halswell (Figure 5.11).