1
ROOT ZONE LOSSES ARE JUST THE BEGINNING
Roland Stenger1, Juliet Clague1, Simon Woodward1, Brian Moorhead1, Scott Wilson2, Ali Shokri1, Thomas Wöhling3, Hugh Canard2
Lincoln Agritech Ltd.
1
Private Bag 3062, Hamilton 3240, New Zealand
2
PO Box 69133, Lincoln, Christchurch 7640, New Zealand
3
Kepplerstrasse 17, 72974 Tübingen, Germany Email: [email protected]
Abstract
Minimising root zone losses has rightly been the main focus in recent years of measures to reduce agricultural land use impacts on freshwater quality. However, root zone losses are just the beginning, as far as managing to water quality limits is concerned. To be able to fully explore all potentially available management options, the entire ‘source transport/transformation impact’ chain needs to be understood.
Where, when, and to what extent the root zone losses impact on freshwater bodies depends on the transport and transformation processes occurring in the vadose zone – groundwater – surface water continuum. We will be elucidating these processes using a combination of New Zealand and European examples.
Understanding the ‘where’ requires investigation of the relative importance of the various subsurface flow paths (e.g. artificial drainage, interflow, shallow and deeper groundwater). Modelling of the subsurface hydrological system also helps to define the groundwater catchments that contribute water (and the nitrate it carries) to a monitoring site. These groundwater catchments do not necessarily match the topographically defined surface water catchments.
Regarding the ‘when’, it is essential to consider the lag times, both in the vadose zone and in the groundwater system. Depending on the relative importance of the various flow paths, not all nitrate lost from the root zone will reach a surface water body at the same time. The resulting distribution of transfer times further complicates establishing the link between an impact observed in a surface water body and the land use activity that has caused it.
As for the ‘extent’ to which root zone nitrate losses impact on freshwater bodies, it is critical to account for attenuation processes occurring along the flow paths. The two key nitrate attenuation processes are mixing/dilution and denitrification (occurring below the root zone).
2 Introduction
When considering diffuse pollution of our freshwater resources with nitrogen lost from agricultural production systems, there has traditionally been a strong focus on the root zone as the source of this pollution, while the ‘source transport/transformation impact’ chain has received much less attention. This is in agreement with the observation that ‘source control’ is usually the most effective means of limiting freshwater pollution and reflects that land use and land management decisions by individual land owners/managers determine the extent of these losses. Accordingly, various means have been developed to determine/estimate nitrogen losses from the root zone of a paddock, farm block, or farm. Lysimeters can provide local information, but their use is limited by the high spatial variation inherent in pastoral systems (Lilburne et al., 2012). Look-up tables have been compiled in an attempt to provide long-term average nitrate nitrogen rates for each relevant land use under different soil types and rainfall zones in an entire region (Lilburne et al., 2010). Most importantly, continued development of the nutrient budgeting model OVERSEER has extended its applicability to most land use types at the national scale (http://www.overseer.org.nz/).
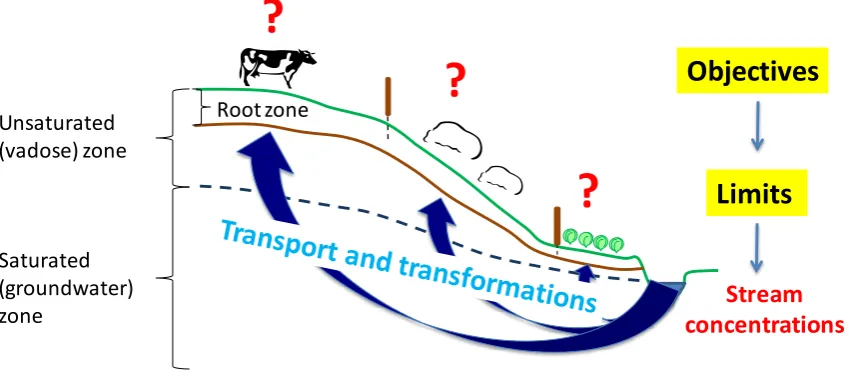
The start of the New Zealand Government’s freshwater management reform agenda in 2009 has highlighted the need to better understand the ‘source transport/transformation impact’ chain, as developing policy (e.g. the National Objectives Framework – NOF) is based on a ‘reverse hydrology approach’. Rather than starting with the source and estimating the impact, this approach first sets objectives and defines limits that apply to the impact end of the chain (e.g. nutrient concentrations in rivers, wetlands, lakes and estuaries) and then aims to back-calculate the tolerable level of losses from the source, i.e. the root zones of all pieces of land discharging nutrients to the impact site (Fig. 1).
Fig. 1: ‘Reverse hydrology approach’ employed by recent freshwater management reforms.
This back-calculation can only be carried out in a defensible manner if the transfer processes (i.e. transport and transformations) occurring between the source and impact zones are sufficiently understood, as these determine which parcels of land impact on a surface water body, when, and to what degree.
Unsaturated (vadose) zone
Saturated (groundwater) zone
Root zone
Limits
Stream concentrations
?
?
?
3
Fig. 1 also shows that, from a system-control point of view, we potentially have two options to control what is discharged into our surface waters. Firstly, we can control the nutrient source, which is usually the most effective approach and the one we have focused on to date. However, if we manage to improve our understanding of the transfer processes, then we may additionally be able in the future to exert some transfer control.
Transport processes
Research undertaken in the intensively studied Toenepi dairying catchment provides an instructive example on the importance of understanding the relative contribution of different flow paths and their associated lag times.
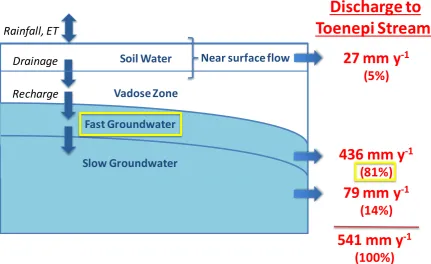
Long-term stream flow and stream nitrate nitrogen time series data (Wilcock et al., 2006) were used in an inverse modelling approach to parameterise the spatially aggregated (‘lumped’) catchment model StreamGEM (Woodward et al., 2013). This modelling suggests that near-surface flows (i.e. surface runoff, interflow) contribute only 5% of the annual stream flow, while fast (shallow) groundwater contributes 81%. Slow (deep) groundwater discharge is responsible for the remaining 14% (Fig. 2). Given that the fast groundwater reservoir dominates the stream flow in this catchment, it’s crucial to understand its chemistry and transfer time.
Fig. 2: Importance of different flow paths for stream flow generation in the Toenepi catchment (Woodward et al., 2013).
Fig. 3 shows schematically that the different flow paths contributing to stream flow differ in their typical transfer times (USGS, 1998). The converging flow lines near the stream highlight that stream water always comprises components of varying transfer times, it is never one uniform age. The term ‘Mean Transfer Time’ is therefore used to describe the average age of a water sample.
Vadose Zone
Fast Groundwater
Slow Groundwater
Discharge to
Toenepi Stream:
Soil Water Rainfall, ET
Drainage
Recharge
Near surface flow
27 mm y
-1(5%)
436 mm y
-1(81%)
79 mm y
-1(14%)
541 mm y
-14
Fig. 3: Typical transfer times associated with subsurface flow paths (USGS, 1998).
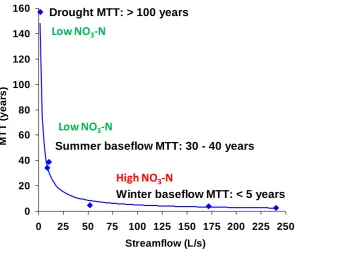
Mean transfer times (MTTs) in Toenepi Stream under baseflow conditions, i.e. when the stream was not affected by recent rainfall, were found to show a very strong seasonality (Morgenstern et al., 2010). Winter baseflow, which is dominated by discharge from the fast groundwater reservoir, had MTTs of less than 5 years. In contrast, the much lower summer baseflow, had 30-40 years MTT, reflecting the gradual depletion of the fast groundwater reservoir. The small trickle that was still flowing under drought conditions, and which is sustained by the slow groundwater reservoir, had a MTT of over 100 years (Fig. 4). These seasonally varying MTTs explain some of the seasonal variation of nitrate concentrations, but as discussed in the following section, a differing extent of attenuation along the different flow paths additionally influences the nitrate dynamics observed in the stream.
Fig. 4: Variation of mean transfer time (MTT) with stream flow rate under baseflow conditions (see Morgenstern et al., 2010).
0 20 40 60 80 100 120 140 160
0 25 50 75 100 125 150 175 200 225 250
Streamflow (L/s)
M
T
T
(
y
e
a
rs
)
Winter baseflow MTT: < 5 years Summer baseflow MTT: 30 - 40 years Drought MTT: > 100 years
High NO3-N
5 Transformation processes
A range of different transformation processes can potentially affect nitrate concentrations along the subsurface flow paths. Denitrification is the most critical of these, as it is a natural attenuation process that under suitable conditions can remove substantial amounts of nitrate before it discharges into surface water bodies. Oxygen-depleted (‘reduced’) groundwater, electron donors (e.g. organic carbon, pyrite), and microbes with the metabolic capacity for denitrification are prerequisites for denitrification to occur (Stenger et al., 2013).
Based on our field work and associated modelling, Fig. 5 shows how denitrification affects the groundwater nitrate fluxes in the Toenepi catchment. The strongly reduced slow groundwater reservoir does not transfer any nitrate to the stream. However, given that the flow through this reservoir is small, it also attenuates only a relatively small fraction of the leached nitrate. In contrast, the fast groundwater reservoir, which has a variable redox status, is responsible for most of the nitrate discharge into the stream, but it also attenuates approx. 36% of the nitrate lost from the root zone. The overall effect is that approx. 45% of the nitrate lost from the root zone is attenuated (Woodward et al., 2013).
Fig. 5: Importance of different flow paths for nitrate attenuation and transfer into Toenepi Stream (Woodward et al., 2013).
To date, little information is available in New Zealand specifically on denitrification in groundwater systems (see Clague et al., 2013, for an overview). Overall attenuation rates, which lump together all potentially occurring attenuation processes at multiple locations (vadose zone, groundwater zone, riparian zone, hyporheic zone, in-stream) have been reported in a few studies (e.g. Elliot and Stroud, 2001; Alexander et al., 2002; Clothier et al., 2007). The reported overall attenuation rates are generally high, ranging from 39 to 76%. However, it is conceivable that the effect of groundwater lag times was not always sufficiently taken into account when calculating these rates.
Vadose Zone
Fast Groundwater
(Variable redox status)
Slow Groundwater
(Strongly reduced)
Soil Water
Rainfall, ET
Drainage
Recharge
Near surface flow
3.9 mg L
-10.1 mg L
-17.4 mg L
-1Concentration
40 kg ha
-1y
-1(100%)
Leaching
22 kg ha
-1y
-1(55%)
2 kg ha
-1y
-120 kg ha
-1y
-10 kg ha
-1y
-1Yield
(5%)
(50%)
(0%)
0 kg ha
-1y
-1Attenuation
15 kg ha
-1y
-1(36%)
4 kg ha
-1y
-1(9%)
18 kg ha
-1y
-16
European examples for the significance for denitrification in groundwater systems In New Zealand, research into denitrification in groundwater systems is still in its infancy. However, there is a comprehensive body of literature on groundwater denitrification in many northern hemisphere countries. Within Europe, groundwater denitrification is particularly widespread in the north-west (e.g. Belgium, northern Germany, Denmark).
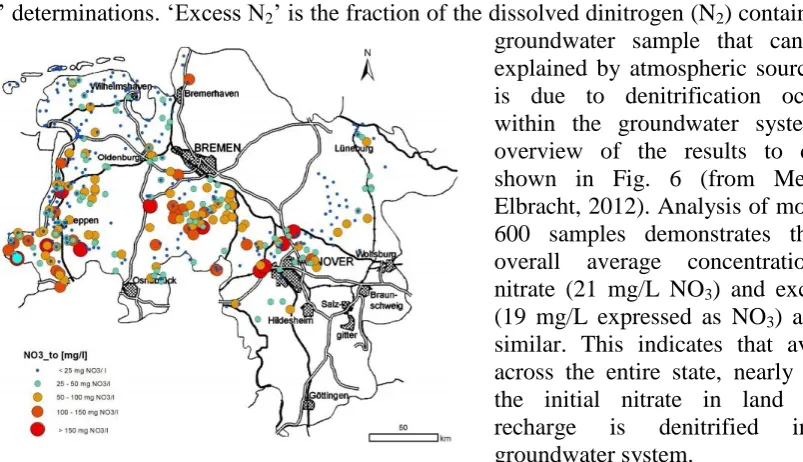
The northern German state of Lower Saxony, which has a size similar to Canterbury, complemented their routine groundwater monitoring programme in 2006 by adding ‘Excess N2’ determinations. ‘Excess N2’ is the fraction of the dissolved dinitrogen (N2) contained in a
groundwater sample that cannot be explained by atmospheric sources, but is due to denitrification occurring within the groundwater system. An overview of the results to date is shown in Fig. 6 (from Meyer & Elbracht, 2012). Analysis of more than 600 samples demonstrates that the overall average concentrations of nitrate (21 mg/L NO3) and excess N2
(19 mg/L expressed as NO3) are very
similar. This indicates that averaged across the entire state, nearly half of the initial nitrate in land surface recharge is denitrified in the groundwater system.
Fig. 6: Excess N2 concentrations (expressed as mg/L NO3) in groundwater samples from
Lower Saxony, Germany (from Meyer & Elbracht, 2012).
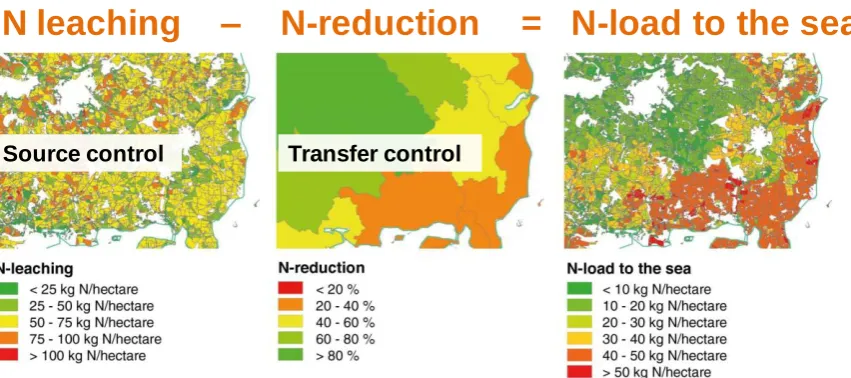
In Denmark, which is slightly smaller than Canterbury, there is a strong focus on understanding the N-load reduction between the root zone and the coastal waters surrounding the country. Accordingly, ‘N reduction maps’ like the one shown in Fig. 7 have been produced (from Kronvang et al., 2009).
Regarding environmental policy, Denmark has recognised that the goal of diminished N-loads to the sea can be achieved by two mechanisms: firstly, by reducing N leaching, and secondly, by exploiting the spatially varying N reduction between the root zone and the sea. That is what we call the ‘assimilative capacity’.
7
Fig. 8: ‘Source transport/transformation impact’ chain for the example of Denmark (modified from Blicher-Mathiesen et al., 2013).
Given that leaching losses were halved in Denmark between 1985 and 2003, achieving further reductions would be very costly for the country (Blicher-Mathiesen et al., 2013). Therefore, Denmark is currently working on new policy that aims to complement the ‘source control’ approach pursued to date with a ‘transfer control’ option. This option aims at making use of the spatially varying assimilative capacity along the transfer pathways to the sea. If nitrate losses from a given piece of land are presumed to be strongly attenuated before reaching the sea, then less stringent land use rules will be applied compared with those for pieces of land where little attenuation is to be expected during the transfer (Fig. 8). Rather than introducing new rules uniformly, this spatial differentiation is considered the most effective means to achieve further load reductions to the sea.
Conclusion
In New Zealand, there still remains substantial potential for further leaching loss reductions, i.e. source control. However, overseas experience and emerging NZ data suggests that explicitly taking account of attenuation processes occurring between the bottom of the root zone and the water body for which objectives are set could create some headroom in catchments constrained by limits. Intensifying research into the subsurface transport and transformation processes would ultimately enable us to add a transfer control option to our nutrient management tool kit.
Acknowledgments
We would like to thank the farmers in the Toenepi catchment for their co-operation and Bob Wilcock (NIWA) for the provision of stream data. This research was conducted under the “Groundwater Assimilative Capacity” Programme funded by MBIE.
References
Alexander, R.B., A.H. Elliott, U. Shankar, and G.B. McBride. 2002. Estimating the sources and transport of nutrients in the Waikato River Basin, New Zealand. Water Resour. Res. 38 1268:4-23.
N leaching –
N-reduction = N-load to the sea
8
Blicher-Mathiesen, G., H.E. Andersen, J. Windolf, and B. Kronvang. 2013. Can monitoring support targeting of measures to high N load catchments? International Interdisciplinary Conference on Land Use and Water Quality, Reducing Effects of Agriculture, The Hague, The Netherlands, 10-13 June 2013.
Clague, J.C., R. Stenger and T.J. Clough. 2013. The impact of relict organic materials on the denitrification capacity in the unsaturated–saturated zone continuum of three volcanic profiles. J. Environ. Qual. 42:145-154.
Clothier, B., A. Mackay, A. Carran, et al. 2007. Farm Strategies for Contaminant Management: A report by SLURI for Horizons Regional Council. AgResearch.
Elliot, A.H., and M.J. Stroud. 2001. Prediction of nutrient loads entering Lake Taupo under various land use scenarios. NIWA Client Report EVW01224. NIWA, Hamilton. Updated by Waikato Regional Council in January 2004.
Kronvang, B., J. Windolf, R. Grant, et al. 2009. Linking monitoring and modelling for river basin management: Danish experience with combating nutrient loadings to the aquatic environment from point and non-point sources. Sci China Ser E-Tech Sci. 52(11): 3335―3347, doi: 10.1007/s11431-009-0368-x
Lilburne, L., S. Carrick, T. Webb, and J. Moir. 2012. Computer-based evaluation of methods to sample nitrate leached from grazed pasture. Soil Use and Management 28(1): 19–26.
Lilburne, L., T. Webb, R. Ford, and V. Bidwell. 2010. Estimating nitrate-leaching rates under rural land uses in Canterbury. Environment Canterbury Regional Council Report No. R10/127, ISBN 978-1-927137-76-5.
Meyer, K. and J. Elbracht. 2012 Nitratabbau im Grundwasser - Kenntnisstand aus Messungen. Tagung Denitrifikation in Niedersachsen, 18.04.2012, Landesamt für Bergbau, Energie und Geologie, Hannover, Germany.
Morgenstern, U., M. K.Stewart, and R. Stenger. 2010. Dating of streamwater using tritium in a post nuclear bomb pulse world: continuous variation of mean transit time with streamflow. Hydrol. & Earth Syst. Sci. 14:2289-2301, doi:10.5194/hess-14-2289-2010.
Stenger R, J. Clague, S. Woodward, et al. 2013. Denitrification – The key component of a groundwater system’s assimilative capacity for nitrate. In: Accurate and efficient use of nutrients on farms. (Eds L.D. Currie and C L. Christensen). Occasional Report No. 26. Fertilizer and Lime Research Centre, Massey University, Palmerston North, New Zealand. 11 pages.
USGS (1998) Ground Water And Surface Water A Single Resource. U.S. Geological Survey Circular 1139
Wilcock, R.J. et al. 2006. Land-use impacts and water quality targets in the intensive dairying catchment of the Toenepi Stream, New Zealand. NZ Journal of Marine and Freshwater Research 40:123-140.