Longitudinal Growth of Hospitalized Very Low Birth Weight Infants
Richard A. Ehrenkranz, MD*; Naji Younes, PhD‡; James A. Lemons, MD§; Avroy A. Fanaroff, MB, BCh\; Edward F. Donovan, MD¶; Linda L. Wright, MD#; Vasilis Katsikiotis, PhD‡; Jon E. Tyson, MD, MPH**;
William Oh, MD‡‡; Seetha Shankaran, MD§§; Charles R. Bauer, MD\\; Sheldon B. Korones, MD¶¶; Barbara J. Stoll, MD##; David K. Stevenson, MD***; and Lu-Ann Papile, MD‡‡‡
ABSTRACT. Background. The interpretation of growth rates for very low birth weight infants is ob-scured by limited data, recent changes in perinatal care, and the uncertain effects of multiple therapies.
Objectives. To develop contemporary postnatal growth curves for very low birth weight preterm infants and to relate growth velocity to birth weight, nutritional practices, fetal growth status (small- or appropriate-for-gestational-age), and major neonatal morbidities (chronic lung disease, nosocomial infection or late-onset infec-tion, severe intraventricular hemorrhage, and necrotizing enterocolitis).
Design. Large, multicenter, prospective cohort study. Methods. Growth was prospectively assessed for 1660 infants with birth weights between 501 to 1500 g admit-ted by 24 hours of age to 1 of the 12 National Institute of Child Health and Human Development Neonatal Re-search Network centers between August 31, 1994 and August 9, 1995. Infants were included if they survived>7 days (168 hours) and were free of major congenital anom-alies. Anthropometric measures (body weight, length, head circumference, and midarm circumference) were performed from birth until discharge, transfer, death, age 120 days, or a body weight of 2000 g. To obtain represen-tative data, nutritional practices were not altered by the study protocol.
Results. Postnatal growth curves suitable for clinical and research use were constructed for body weight, length, head circumference, and midarm circumference. Once birth weight was regained, weight gain (14.4 –16.1 g/kg/d) approximated intrauterine rates. However, at hos-pital discharge, most infants born between 24 and 29 weeks of gestation had not achieved the median birth weight of the reference fetus at the same postmenstrual age. Gestational age, race, and gender had no effect on
growth within 100-g birth weight strata. Appropriate-for-gestational age infants who survived to hospital dis-charge without developing chronic lung disease, severe intraventricular hemorrhage, necrotizing enterocolitis, or late onset-sepsis gained weight faster than comparable infants with those morbidities. More rapid weight gain was also associated with a shorter duration of parenteral nutrition providing at least 75% of the total daily fluid volume, an earlier age at the initiation of enteral feed-ings, and an earlier age at achievement of full enteral feedings.
Conclusions. These growth curves may be used to better understand postnatal growth, to help identify in-fants developing illnesses affecting growth, and to aid in the design of future research. They should not be taken as optimal. Randomized clinical trials should be per-formed to evaluate whether different nutritional man-agement practices will permit birth weight to be regained earlier and result in more rapid growth, more appropriate body composition, and improved short- and long-term outcomes. Pediatrics 1999;104:280 –289; very low birth weight infant, growth curves, National Institute of Child Health and Human Development Neonatal Research Net-work.
ABBREVIATIONS. VLBW, very low birth weight; PN, parenteral nutrition; SGA, small-for-gestational age; AGA, appropriate-for-gestational age; CLD, chronic lung disease; NEC, necrotizing en-terocolitis; NICHD, National Institute of Child Health and Human Development; HC, head circumference; MAC, midarm circumfer-ence.
D
aily evaluation of body weight is a standard practice in the care of very low birth weight (VLBW) preterm infants, and changes in weight are used to adjust fluid and nutritional man-agement and to help identify infants with signs of illness. However, such management is often based on practice style rather than an understanding of the expected weight gain for infants who have different birth weights, gestational ages, postnatal ages, and clinical problems. Weight changes during the first week of life primarily reflect fluctuation of total body water, whereas changes beyond the second week of life seem to reflect growth in response to nutritional support.1In 1948, Dancis et al2 published growth curves derived from 100 preterm infants with birth weights ranging from 1000 to 2500 g; a curve for infants weighing 750 g at birth that was based on the obser-vations for only a few survivors was also included. Those curves are still widely used today, despite
From the *Yale University, New Haven, Connecticut; ‡The George Wash-ington University Biostatistics Center, Rockville, Maryland; the §Indiana University, Indianapolis, Indiana; the\Case Western Reserve University, Cleveland, Ohio; the ¶University of Cincinnati, Cincinnati, Ohio; the #Na-tional Institute of Child Health and Human Development, Bethesda, Mary-land; the **University of Texas Southwestern Medical Center, Dallas, Texas; the ‡‡Women and Infants Hospital, Providence, Rhode Island; the §§Wayne State University, Detroit, Michigan; the\\University of Miami, Miami, Flor-ida; the ¶¶University of Tennessee at Memphis, Memphis, Tennessee; the ##Emory University, Atlanta, Georgia; the ***Stanford University, Stanford, California; and the ‡‡‡University of New Mexico, Albuquerque, New Mexico.
Presented in part at the annual meeting of the Society for Pediatric Re-search; May 1996; Washington DC.
Received for publication Nov 4, 1998; accepted Mar 11, 1999.
major changes in many aspects of neonatal care, including nutritional support. However, “no attempt was made to achieve statistical accuracy in construct-ing these curves” and the curves “represent what the premature infant who develops without complica-tions will do when fed and handled in a certain arbitrary manner.”2 Dancis and his colleagues2 also stated that the “chief variable in determining the weight curve of such a premature infant is the feed-ing policy.”
More recent reports3– 8 have described postnatal weight changes in surviving preterm infants. The growth rates for VLBW infants exceeded those pre-dicted by the Dancis curves.2The authors suggested that the differences may reflect changes in nutritional management and cautioned that the observed growth rates may not be optimal. Although a greater number of extremely low birth weight infants were included in these studies, data for infants with birth weights ,750 g are still limited.
We have performed a multicenter, prospective co-hort study to define postnatal longitudinal growth for VLBW infants. Our specific objectives were: 1) to develop postnatal growth curves for VLBW preterm infants that would permit an assessment of growth velocity; 2) to relate growth velocity and nutritional practices (duration of parenteral nutrition [PN], age at first enteral feeding and age at full enteral feed-ing); 3) to compare growth velocity in infants who are small-for-gestational age (SGA) with infants who are appropriate-for-gestational age (AGA); and 4) to relate growth velocity to several common, major morbidities, including chronic lung disease (CLD), nosocomial infection (or late-onset infection) and ne-crotizing enterocolitis (NEC). These growth data may be useful in identifying preterm infants who are growing slowly despite current nutritional support and in designing and performing clinical trials of nutritional interventions.
PATIENTS AND METHODS OF DATA COLLECTION Data were collected on 1660 infants with birth weights between 501 to 1500 g who were inborn or admitted at 24 hours of age or less to 1 of the 12 National Institute of Child Health and Human Devel-opment (NICHD) Neonatal Research Network centers between Au-gust 31, 1994 and AuAu-gust 9, 1995, survived.7 days (168 hours) and were free of major congenital anomalies. Five hundred twelve addi-tional infants admitted to NICHD Neonatal Research Network cen-ters were excluded during the study period; 220 did not survive longer than 1 week, 133 were ineligible because they were admitted after 24 hours of age, had major congenital anomalies or a birth weight,501 g, and 160 for various other reasons, but primarily because study-specific data forms were not submitted. Growth mea-sures were performed from birth until a body weight of 2000 g was reached (n5898), until discharge (n5482), transfer (n5173), death (n584), or age 120 days (n523). To obtain representative data, nutritional practices and other aspects of neonatal care were not altered by the study protocol. The participating centers included: the University of Tennessee at Memphis (study population [n]5233), the University of Miami (n5171), the Rainbow Babies and Chil-dren’s Hospital at Case Western Reserve University (n5165), the Wayne State University School of Medicine (n5165), the University of Texas Southwestern Medical Center at Dallas (n5163), the Indi-ana University (n5147), the Women and Infants Hospital at Brown University (n5147), the Grady Memorial Hospital at Emory Uni-versity (n5124), the Yale-New Haven Children’s Hospital at Yale University (n5100), the Stanford University (n596), the University of Cincinnati (n584), and the University of New Mexico (n565). Data for each eligible infant were prospectively collected using
previously described definitions for data variables and clinical conditions.9 –11Gestational age in completed weeks was based on
best obstetrical estimate, if one existed, otherwise it was estimated from the last menstrual period, standard obstetrical observations, and ultrasonography.11Trained research nurses performed the
anthropometric measurements and abstracted study data from the infants’ charts. The research nurse from each participating center who was primarily responsible for performing the anthropometric measurements attended a training session before the start of the study; the measurement techniques were standardized at that training session. Morbidity and mortality data were analyzed for all infants until discharge, transfer, death, or 120 days after birth, which ever came first. SGA was defined as birth weight less than the 10th percentile for gender according to Arbuckle et al.12CLD
was defined by the administration of oxygen at 36 weeks of postmenstrual age. Late-onset sepsis was defined as a positive blood or cerebral spinal fluid culture obtained in the presence of compatible clinical signs of septicemia occurring after 72 hours of age or culture negative clinical infection after 72 hours of age for which the infant received antibiotics for 5 or more days. Infants were considered to have definite NEC if they met or exceeded the modified Bell’s staging criteria IIA.13Severe intraventricular
hem-orrhage was defined as a grade 3 or 4 hemhem-orrhage according to the grading scale described by Papile et al.14The information was
entered onto a local personal computer using a distributed data entry system developed by the George Washington University Biostatistics Coordinating Center. Data were electronically trans-ferred weekly to the coordinating center for editing, including checks for discrepancies and inconsistencies. Edit reports were sent to each center for clarification or corrections.
Anthropometric Measurements
Body weight was recorded daily for a minimum of 14 days or until birth weight was regained, whichever occurred later, and then weekly. Measurements were performed at a standard time each day with digital electronic scales (reading to at least the nearest 10 g). Before the start of the study and at 4 to 6 month intervals, the accuracy of the scales were verified using standard weights.
Recumbent length was measured weekly with a Premie Length Board (O’Leary, Ellard Instrumentation LTD, Seattle, WA). One examiner held the infant’s head in a vertical position with the top of the head touching the fixed headboard, while a second exam-iner extended the legs and firmly placed the movable footboard against the infant’s heels.15
Head circumference (HC) was measured weekly. It was deter-mined by applying a paper measurement tape firmly around the head above the supraorbital ridges, at the most prominent part of the frontal bulge anteriorly, and over the part of the occiput that gave the maximum circumference.16
Midarm circumference (MAC) was measured weekly. It was determined by applying a paper measurement tape firmly around the upper arm at the midpoint; the midpoint was located by measuring the distance between the acromion and the olecranon with the arm in a horizontal position.16If possible, the same arm
was used throughout the infant’s hospitalization.
Length, HC, and MAC measurements were each performed twice. An average of the two values was recorded. If the measure-ments differed by more than 5%, additional measuremeasure-ments were performed and the median value was recorded.
Statistical Methods
The infants were divided in 100-g birth weight intervals from 501 g to 1500 g, and separate curves were constructed for weight, length, HC, and MAC within each interval. To accommodate patient-to-patient variation, mixed-effects models were used.17
Be-cause the measurements (weight in particular) vary nonlinearly with time, quadratic regression splines18,19were used for the
sys-tematic part of the models. These models have the ability to fit arbitrary smooth nonlinear functions while using a small number of parameters. The model for body weight (W) on day of lifet, expressed as a piecewise quadratic curve is:
Wt5
u
BW1b1t1b2(T12t)21b3(T22t)21et for t#T1
BW1b1t1b3(T22t)21et for T1,t#T2
BW1b1t1et for t.T2
The model assumes that body weight (Wt) decreases from birth
inter-val betweenT1andT2, and then increases linearly beyondT2. The
error terms, et, are assumed to be independent and identically
distributed with a normal distribution. The parameters,b1,b2, and
b3, are patient specific random effects and are estimated by
max-imum likelihood, conditionally on the knot positions,T1andT2.
The fit is repeated with a grid search forT1andT2until
conver-gence. Similar models were used to construct curves for length, HC, and MAC.
A reference population of infants who were AGA and survived to discharge without developing severe intraventricular hemor-rhage, NEC, CLD, or late-onset sepsis was identified. This popu-lation was stratified by 200-g birth weight intervals to increase the number of reference infants within each birth weight interval below 1101 g. Curves comparing growth between infants in this reference population and the remaining infants with those mor-bidities were constructed, as described above, with the infants within each of the 200-g birth weight intervals from 501 to 1500 g. Additional curves prepared within these 200-g birth weight inter-vals compared growth between: 1) AGA and SGA infants; 2) infants with and without CLD; 3) infants who had and who had not experienced late-onset sepsis; 4) infants who received at least 75% of their total daily fluid volume as PN for the median dura-tion or less and infants who received that amount of PN for longer than the median duration; 5) infants who were started on enteral nutrition at the median age or earlier and infants who were started at greater than the median age; and 6) infants who achieved full enteral nutrition (.100 kcal/kg/d) at the median age or earlier and infants who were older than the median age.
The average daily increments for body weight (g/d and g/kg/d) and the average weekly increments for length, HC, and MAC were computed for the period between the time that the infant regained birth weight and discharge, transfer, death, age 120 days, or until a body weight of 2000 g was reached. Seventeen infants who never regained birth weight were excluded from these calculations.
The velocity of growth for an individual infant was character-ized by the average daily weight gain after birth weight was regained, and by the weekly average gains in length, HC, and MAC. Pearson correlations were obtained among these four mea-sures, and between the measures of gestational age, race (black versus not black), and gender. In addition, Pearson correlations were obtained between the age at first enteral feeding and the age at which full enteral feedings were achieved.
RESULTS
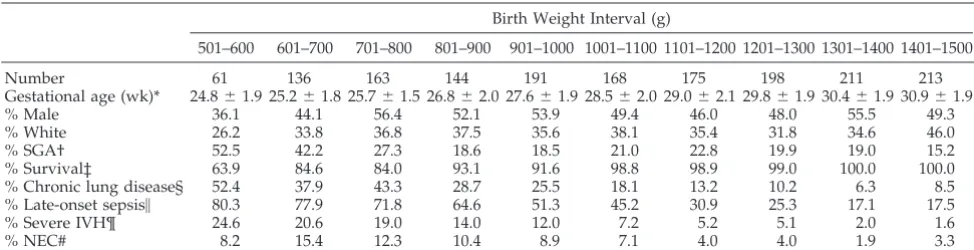
Characteristics of the entire study population strat-ified by 100-g birth weight intervals are displayed in Tables 1 and 2. Each 100-g birth weight interval between 501 and 1500 g, except for the 501 to 600 g strata, contained more than 100 infants who survived for.7 days (168 hours). Although the percentages of
males, whites, SGA infants, and infants who experi-enced morbidities are similar to those previously reported by the NICHD Neonatal Research Net-work,9 –11males and whites are underrepresented and SGA infants are overrepresented in study infants with birth weights,701 g. As expected, the number of days that PN provided at least 75% of the total daily fluid volume, the age in days when enteral feedings were initiated and the age in days when full enteral feedings were achieved tended to decrease progressively as birth weight increased.
Growth velocity by 100-g birth weight intervals is listed in Table 3. All available anthropometric mea-surements were used from all infants, regardless of their nutritional status or clinical course. Statistically significant, positive correlations between the veloci-ties of weight, length, HC, and MAC gains were demonstrated, indicating that infants who tended to grow fast in one measure tended to grow fast in the others. Within each 100-g birth weight interval, ges-tational age, race, and gender had no effect on the growth rate. Average daily weight gain (g/kg body weight/d) after regaining birth weight was similar across 100-g birth weight intervals, ranging between 14.4 and 16.1 g/kg/d (1.44%/d to 1.61%/d). Simi-larly, weekly growth in length, HC, and MAC was similar across 100-g birth weight intervals, averaging
;0.9 cm/wk, 0.9 cm/wk, and 0.35 cm/wk, respec-tively.
Curves plotting body weight, length, HC, and MAC versus postnatal age for each 100-g birth weight stratum in this population are shown in Figs 1, 2, 3, and 4, respectively. Similar to the data used for Table 3, Figs 1 to 4 are based on anthropometric measurements from all infants, regardless of their nutritional status or clinical course.
The characteristics of the reference population are shown in Table 4. Growth curves constructed from models which estimated growth within each 200-g birth weight interval for the reference population and for the remaining infants with morbidities are shown in Fig 5. The curves for both groups of infants with birth weights 501 to 700 g are similar for the first
TABLE 1. Infant Characteristics
Birth Weight Interval (g)
501–600 601–700 701–800 801–900 901–1000 1001–1100 1101–1200 1201–1300 1301–1400 1401–1500
Number 61 136 163 144 191 168 175 198 211 213
Gestational age (wk)* 24.861.9 25.261.8 25.761.5 26.862.0 27.661.9 28.562.0 29.062.1 29.861.9 30.461.9 30.961.9
% Male 36.1 44.1 56.4 52.1 53.9 49.4 46.0 48.0 55.5 49.3
% White 26.2 33.8 36.8 37.5 35.6 38.1 35.4 31.8 34.6 46.0
% SGA† 52.5 42.2 27.3 18.6 18.5 21.0 22.8 19.9 19.0 15.2
% Survival‡ 63.9 84.6 84.0 93.1 91.6 98.8 98.9 99.0 100.0 100.0
% Chronic lung disease§ 52.4 37.9 43.3 28.7 25.5 18.1 13.2 10.2 6.3 8.5
% Late-onset sepsis\ 80.3 77.9 71.8 64.6 51.3 45.2 30.9 25.3 17.1 17.5
% Severe IVH¶ 24.6 20.6 19.0 14.0 12.0 7.2 5.2 5.1 2.0 1.6
% NEC# 8.2 15.4 12.3 10.4 8.9 7.1 4.0 4.0 1.9 3.3
Abbreviations: SGA, small-for-gestational age; IVH, intraventricular hemorrhage; NEC, necrotizing enterocolitis. * Best obstetrical estimate (mean6SD).
† Birth weight,10 percentile according to Arbuckle et al.12
‡ Survival of infants meeting inclusion criteria (ie, survival.168 hours). § Oxygen dependence at 36 weeks postmenstrual age.
\Sepsis occurring after 72 hours of age with proven culture and/or treated with antibiotics for.5 days. ¶ Grade 3– 4 IVH.14
42 days; afterward the curves separate with a differ-ence of;175 g present at 84 days of age. However, because only 4% of the infants with birth weights 501 to 700 g were included in the reference population, the validity of that curve is questionable. A compar-ison of the curves for infants with birth weights.700
g demonstrated that infants in the reference popula-tion tended to regain birth weight sooner, weighed 20 to 40 g more at 28 days of age, and weighed at least 100 g more at 56 days of age than infants of comparable birth weight with morbidities.
The growth of infants with and without CLD and
TABLE 2. Nutritional Characteristics Birth Weight
Interval (g)
Duration PN$75%*
(Days)
Age at First Enteral Feeding
(Days)
Age at Full Enteral Feeding
(Days)
Age to Regain Birth Weight†
(Days)
501–600 20.8615.8‡ 9.265.5 33.8615.6 15.2612.2
601–700 20.7615.0 9.569.5 34.0619.3 16.7612.6
701–800 15.6611.3 8.066.6 27.3615.2 17.2612.3
801–900 14.0611.2 6.265.6 23.0613.8 15.5610.1
901–1000 12.269.9 5.765.1 20.8612.5 14.469.7
1001–1100 10.369.2 4.863.6 18.3612.1 12.867.5
1101–1200 7.466.8 3.963.7 14.269.5 13.268.5
1201–1300 5.765.0 3.162.6 12.168.0 11.567.6
1301–1400 4.865.6 2.962.9 10.767.6 12.067.3
1401–1500 4.965.2 2.862.7 10.767.7 11.666.6
Abbreviation: PN, parenteral nutrition.
* Duration of PN providing at least 75% of the total daily fluid volume. † Birth weight regained and maintained for 2 days.
‡ Mean6SD.
TABLE 3. Growth Velocity by Birth Weight Interval* Birth Weight
Interval, g (n)
Weight Gain Length
(cm/wk)
Head Circumference
(cm/wk)
Midarm Circumference
(cm/wk)
(g/d) (g/kg/d)
501–600 (53) 15.27 13.99 0.99 0.90 0.42
601–700 (128) 16.81 13.46 0.95 0.89 0.39
701–800 (155) 18.60 13.96 1.01 0.94 0.42
801–900 (139) 20.06 14.46 1.02 0.94 0.42
901–1000 (184) 21.04 14.63 1.02 0.97 0.42
1001–1100 (163) 22.83 15.22 1.00 0.94 0.42
1101–1200 (171) 24.73 15.98 1.00 0.95 0.43
1201–1300 (187) 26.34 16.28 0.99 1.00 0.48
1301–1400 (200) 27.15 16.17 0.96 0.89 0.45
1401–1500 (203) 27.77 16.00 0.86 0.74 0.25
* The average daily increments for body weights (g/d and g/kg/d) and the average weekly increment for length, head circumference, and midarm circumference were computed for the period between the time that birth weight was regained and discharge, transfer, death, age 120 days, or until a body weight of 2000 g was reached.
of infants who experienced and who did not experi-ence late-onset sepsis was also compared. These analyses revealed curves similar to those comparing the reference population to the infants with morbid-ities in Fig 5. Although the growth curves of infants with birth weights 501 to 700 g were not affected by the development of CLD, the curves for the other infants with CLD and the curves for the infants with late-onset sepsis were slower than those for infants without CLD or late-onset sepsis; specifically, a body weight of 2000 g was reached ;1 to 2 weeks later than the comparable birth weight cohort without those morbidities. During the study period;22% of the infants with birth weights 501 to 1500 g (center range, 10%–34%) received corticosteroids for
treat-ment of CLD; such treattreat-ment has been associated with slower growth.20,21
A comparison of the growth of SGA and AGA infants is shown in Fig 6. Within each 200-g birth weight interval the SGA infants returned to birth weight 3 to 5 days sooner, gained weight faster, and reached a body weight of 2000 g;3 to 7 days earlier than did their comparable AGA birth weight cohort. Comparisons of the growth curves of infants within 200-g birth weight intervals revealed that in-fants who received at least 75% of their total daily fluid volume as PN for a shorter time period (median duration or less) gained weight faster; that infants who were started on enteral nutrition earlier (median age or younger) gained weight faster; and that in-Fig 2. Average weekly length versus
postnatal age in weeks for infants stratified by 100-g birth weight inter-vals.
fants who achieved full enteral nutrition sooner (me-dian age or younger) gained weight faster. Similar sets of growth curves were obtained with each com-parison. However, within each 200-g birth weight cohort, no correlation was found between the age at the first enteral feeding and the age at which full enteral feedings was achieved.
To further examine differences between normal intrauterine growth and our observed rates of post-natal growth, growth curves for study infants with gestational ages 24 to 25 weeks (n 5 218), 26 to 27 weeks (n5 364), and 28 to 29 weeks (n5474) were compared with reference intrauterine growth curves (Fig 7) that were plotted using the smoothed 10th and 50th percentile birth weight-gestational age data recently reported by Alexander et al.22 Although growth data were collected on infants with birth weights up to 1500 g, curves for infants with a ges-tational age of 30 weeks or more (n5547) were not included because a high percentage of them weigh
.1500 g at birth, making such curves from our data unrepresentative. As displayed in Fig 7, each
post-natal growth curve is shifted to the right of the reference intrauterine growth curves. Furthermore, although the birth weights of the study infants are similar to the birth weights of the infants shown on the reference intrauterine growth curve, most of the infants born between 24 to 29 weeks gestation would not have achieved the median birth weight of the reference fetus of the same postmenstrual age, and many would be less than the 10th percentile at hos-pital discharge.
DISCUSSION
The clinical interpretation of the growth rate for individual VLBW infants is hindered by the multiple factors which may influence growth, the limited number of VLBW infants assessed in previous stud-ies, and the marked changes in perinatal medicine during the past 5 to 10 years. These changes include the widespread use of surfactant replacement ther-apy, antenatal steroids for pulmonary maturation and central nervous system protection, postnatal ste-roids for CLD, and percutaneously-inserted central Fig 4. Average weekly midarm
cir-cumference versus postnatal age in weeks for infants stratified by 100-g birth weight intervals.
TABLE 4. Reference Population Characteristics
Birth Weight Interval
501–700 g (n5197)
701–900 g (n5307)
901–1100 g (n5359)
1101–1300 g (n5373)
1301–1500 g (n5424)
Reference population* 8 (4.1) 32 (10.4) 80 (22.8) 139 (37.3) 219 (51.7) Gestational age, wk 24.361.0† 26.462.0 27.761.2 29.161.6 30.361.6 Male,n(%) 2 (25.0) 18 (56.3) 27 (33.8) 58 (41.7) 94 (42.9) White,n(%) 5 (62.5) 7 (21.9) 24 (30.0) 39 (28.1) 85 (38.8) Duration (d) PN$75% 12.567.0 9.165.6 6.965.3 4.463.7 3.763.7 Age (d) at first enteral feed 6.063.0 5.564.2 3.862.3 2.862.1 2.561.8 Age (d) at full enteral feed 24.9610.4 18.167.2 13.666.4 10.265.6 9.064.7 Age (d) to regain birth weight‡ 18.663.6 17.569.6 13.566.9 12.566.7 12.065.9
Abbreviations: PN, parenteral nutrition.
* The reference population [n(%)] was defined as infants who were appropriate-for-gestational age and survived to discharge without developing chronic lung disease, severe intraventricular hemorrhage, necrotizing enterocolitis, or late-onset sepsis.
† Mean6SD.
venous catheters for parenteral nutritional support. We therefore chose to prospectively evaluate a large heterogeneous population of VLBW infants in an effort to determine postnatal growth in response to current nutritional practices and as a first step in designing clinical trials in neonatal nutrition aimed at improving postnatal growth and nutritional sta-tus.
The goal of nutritional management of VLBW in-fants that has been favored by the American Acad-emy of Pediatrics Committee on Nutrition23,24is the achievement of postnatal growth at a rate approxi-mating that of the third trimester of intrauterine life. Although the birth weights of infants who deliver prematurely may differ from the weights of undeliv-ered fetuses of the same gestational age, reference
intrauterine growth rates have usually been derived from the 50th percentile curve displayed in pub-lished reports of intrauterine growth.12,22,25–27 As in our study, gestational age in these reports was usu-ally expressed in completed weeks based on the in-terval between the date of the last normal menses and the date of live birth.
Since the report by Dancis et al2in 1948, a number of growth curves3– 8have been published. Depending on the characteristics of the population studied, in-fants were usually found to regain birth weight more quickly and to exhibit larger average daily weight gains than those reported by Dancis et al.2 The au-thors of these studies suggested that improvements in preterm formulas and an increased use of total PN supported more rapid growth and that their curves Fig 5. Growth curves of infants with
major morbidities (dashed line) and of reference infants without major mor-bidities (solid line) plotted by postna-tal age in days. The infants are strati-fied by 200-g birth weight intervals. Reference infants without major mor-bidities were appropriate-for-gesta-tional age and survived to discharge without developing chronic lung dis-ease, severe intraventricular hemor-rhage, necrotizing entercolitis, or late-onset sepsis.
were a reflection of changes in hospital nutritional management.
With current NICHD Neonatal Research Network Center nutritional practices, we found that once VLBW infants regain birth weight, their average daily weight gain ranged between 14.4 and 16.1 g/kg body weight/d (Table 3), a rate similar to the re-ported intrauterine weight gain of ;1.5%/d or 15 g/kg/d.4,25,28,29 In addition, their average weekly in-crements in length (0.9 cm/wk) and HC (0.9 cm/wk) are similar to the rates of intrauterine length and HC increase reported by Lubchenco et al30 between 26 and 36 weeks of gestation (1.1 cm/wk and 0.7 cm/ wk, respectively). Also, their average weekly incre-ment in MAC (0.35 cm/wk) is similar to the average weekly intrauterine MAC increase reported by Sasanow et al16for infants between 25 and 36 weeks of gestation (0.34 cm/wk); the MAC reflects deposi-tion of fat and muscle stores. We noted statistically significant, positive correlations between body weight, length, HC, and MAC increments.
Nonetheless, although the rate of weight gain that we observed after birth weight was regained was similar to the reported intrauterine rate, as seen in Fig 7, most of the infants born between 24 and 29 weeks of gestation would not have achieved the median birth weight of the reference fetus of the same postmenstrual age at hospital discharge. In fact, because many VLBW infants are discharged when they reach 35 completed weeks and a body weight of ;2000 g, they are less than the 10th per-centile birth weight (2159 g) for 35 completed weeks of gestation according to the intrauterine growth data reported by Alexander et al.22 This observation has been previously described.4,31 Furthermore, be-cause infants who experience common neonatal mor-bidities regained birth weight later and gained body weight more slowly than infants without neonatal morbidities (Fig 5), the body weight at 35 weeks postmenstrual age for infants with morbidities
would be even further below the median birth weight of a reference infant of similar postmenstrual age. The magnitude of this deficit reflects the in-creased time to regain birth weight and to achieve full enteral feedings. Since Hack et al32reported that subnormal HC at 8 months corrected age is associ-ated with poor cognitive function at school age, an additional concern for these infants would be persis-tently slow postnatal head growth.
Although our study did not specify nutritional practices, we found several associations that should be examined further. Infants who were started on enteral nutrition at or before the median age gained weight faster than if feedings were started after the median age. This finding is consistent with several studies33–36 suggesting that early minimal enteral feedings decreases the time required to reach full enteral nutrition. However, within each 200-g birth weight interval, we found no correlation between the age at the first enteral feeding and the age at which full enteral feedings was achieved. We also observed that infants gained weight faster if they achieved full enteral nutrition earlier or if they received 75% or more of their total daily fluid volume as PN for a shorter duration. Unfortunately, such associations may be confounded by management decisions to initiate enteral feedings earlier in healthier infants and later in sicker infants. Similar observations were made by Wright et al.6
We also noted that infants with major morbidities gained weight more slowly than infants without morbidities (Fig 5). Poorly nourished infants who are gaining weight slowly might be more prone to de-velop CLD and late-onset sepsis.37 However, the in-cidence of morbidities might be decreased by iden-tifying infants in whom the average time to regain birth weight or to reach full enteral nutrition is de-layed (Table 2), and then changing their nutritional management, such as increasing the dietary protein/ energy ratio. This is a testable hypothesis. Recent Fig 7. Average body weight versus
observations comparing nutritional practices and weight gain by VLBW infants cared for at seven regional neonatal intensive care units demonstrated that the presence of a neonatal nutritionist on the health care team was associated with significantly greater weight-adjusted growth.38
The strength of our data lie in the large, heteroge-neous population of VLBW infants studied. It is lim-ited by the lack of data describing daily caloric and nutritional intake. Therefore, growth could not be correlated with nutritional intake. Nonetheless, the infants’ management reflects current nutritional practices because the mean ages at which full enteral feeding were achieved and at which birth weights were regained for infants with birth weights#1000 g (Table 2) were similar to the recent report by Pauls et al.8
CONCLUSIONS
In summary, we have prospectively collected lon-gitudinal data on a large population of infants with birth weights 501 to 1500 g who have been managed with current nutritional practices. Postnatal growth curves were constructed from anthropometric mea-sures (Figs 1 to 4). Most VLBW infants did not achieve catch-up growth during the neonatal inten-sive care unit hospitalization when compared with the median birth weight of a reference fetus of the same postmenstrual age (Fig 7). Infants with morbid-ities gained weight more slowly than infants without morbidities (Fig 5). The rate of weight gain was also associated with the duration that infants received at least 75% of their total daily fluid volume as PN, the age at which enteral feedings were initiated and the age at which full enteral feedings were achieved. These growth curves (Figs 1 to 4) should not be taken as optimal. They may be used to better understand postnatal growth, to identify infants developing ill-nesses that affect growth, and to aid in designing future research. Randomized clinical trials should be performed to evaluate whether different nutritional management practices will permit birth weight to be regained earlier and result in more rapid weight gain, more appropriate body composition, and im-proved short and long-term outcomes.
ACKNOWLEDGMENTS
Members of the NICHD Neonatal Research Network are: Ro-nald L. Poland, MD, Chairman, Pennsylvania State University College of Medicine; Avroy A. Fanaroff, MB, BCh (principal in-vestigator), Maureen Hack, MB, ChB, Nancy Newman, RN, Case Western Reserve University (U10 HD21364); Edward F. Donovan, MD (principal investigator), Marcia Mersmann, RN, University of Cincinnati (U10 HD27853; M01 RR 08084); Barbara J. Stoll, MD (principal investigator), Rebecca Burrow, RN, Emory University (U10 HD27851); Joel Verter, PhD (principal investigator), Barbara Stenzel, MBA, Rita Hellman- Waters, BS, George Washington University, The Biostatistics Center (U01 HD19897); James A. Lemons, MD (principal investigator), Scott C. Denne, MD, Diana Appel, RN, Indiana University (U10 HD27856; M01 RR 00750); Charles R. Bauer, MD (principal investigator), Ronald N. Gold-berg, MD, Amy Mur Worth, RN, MSN, University of Miami (U10 HD21397); Linda L. Wright, MD (principal investigator), Sumner J. Yaffe, MD, National Institute of Child Health and Human De-velopment; Lu-Ann Papile, MD (principal investigator), Conra Backstrom, RN, University of New Mexico (U10 HD27881; M01 RR 00997); David K. Stevenson, MD (principal investigator), M.
Bethany Ball, BS, Stanford University (U10 HD27880; M01 RR 00070); Sheldon B. Korones, MD (principal investigator), Henrietta Bada, MD, Tina Hudson, RN, University of Tennessee at Memphis (U10 HD21415); Jon E. Tyson, MD (principal investigator), Kath-leen Kennedy, MD, Susie Madison, RN, University of Texas Southwestern Medical Center (U10 HD21373); Seetha Shankaran, MD (principal investigator), G. Ganesh Konduri, MD, Geraldine Muran, RN, Wayne State University (U10 HD21385); William Oh, MD (principal investigator), Barbara Stonestreet, MD, Angelita Hensman, RN, Women and Infants Hospital (U10 HD27904); Rich-ard A. Ehrenkranz, MD (principal investigator), Patricia Gettner, RN, Elaine Sherwonit, RN, Yale University (U10 HD27871; M01 RR 06022).
REFERENCES
1. Bauer K, Bovermann G, Roithmaier A, Gotz M, Proiss A, Versmold H. Body composition, nutrition, and fluid balance during the first two weeks of life in preterm neonates weighing less than 1500 grams. J Pediatr. 1991;118:615– 620
2. Dancis J, O’Connell JR, Holt LE Jr. A grid for recording the weight of premature infants.J Pediatr. 1948;33:570 –572
3. Brosius KK, Ritter DA, Kenny JD. Postnatal growth curve of the infant with extremely low birth weight who was fed enterally.Pediatrics. 1984;74:778 –782
4. Gill A, Yu VYH, Bajuk B, Astbury J. Postnatal growth in infants born before 30 weeks’ gestation.Arch Dis Child. 1986;61:549 –553
5. Shaffer SG, Quimiro CL, Anderson JV, Hall RT. Postnatal weight changes in low birth weight infants.Pediatrics. 1987;79:702–705 6. Wright K, Dawson JP, Fallis D, Vogt E, Lorch V. New postnatal growth
grids for very low birth weight infants.Pediatrics. 1993;91:922–926 7. Berry MA, Conrod H, Usher RH. Growth of very premature infants fed
intravenous hyperalimentation and calcium-supplemented formula. Pe-diatrics. 1997;100:647– 653
8. Pauls J, Bauer K, Versmold H. Postnatal body weight curves for infants below 1000 g birth weight receiving early enteral and parenteral nutri-tion.Eur J Pediatr. 1998;157:416 – 421
9. Hack M, Horbar JD, Malloy MH, Tyson JE, Wright E, Wright L. Very low birth weight outcomes of the National Institutes of Child Health and Human Development Neonatal Network. Pediatrics. 1991;87: 587–597
10. Hack M, Wright LL, Shankaran S, et al. Very-low-birth weight outcomes of the National Institutes of Child Health and Human Development Neonatal Network, November 1989 to October 1990.Am J Obstet Gy-necol. 1995;172:457– 464
11. Fanaroff AA, Wright LL, Stevenson DK, et al. Very-low-birth-weight outcomes of the National Institutes of Child Health and Human Devel-opment Neonatal Research Network, May 1991 through December 1992.Am J Obstet Gynecol. 1995;173:1423–1431
12. Arbuckle TE, Wilkins R, Sherman GJ. Birth weight percentiles by ges-tational age in Canada.Obstet Gynecol. 1993;81:39 – 48
13. Walsh MC, Kleigman RM. Necrotizing enterocolitis: treatment based staging criteria.Pediatr Clin North Am. 1986;33:179 –201
14. Papile L-A, Burstein J, Burstein R, Koffler H. Incidence and evolution of subependymal and intraventricular hemorrhage: a study of infants with birth weights less than 1,500 gm.J Pediatr. 1978;92:529 –534
15. Fomon SJ, Nelson SE. Size and growth. In: Fomon SJ, ed.Nutrition of
Normal Infants. St. Louis, MO: Mosby-Year Book, Inc, 1993:36 – 84
16. Sasanow SR, Georgieff MK, Pereira GR. Mid-arm circumference and mid-arm/head circumference ratios: standard curves for anthropomet-ric assessment of neonatal nutritional status.J Pediatr. 1986;109:311–315 17. Laird NM, Ware JH. Random-effects models for longitudinal data.
Biometrics. 1982;38:963–974
18. Smith PL. Splines as a useful convenient statistical tool.American Stat-istician. 1979;33:57– 62
19. Littell R, Milliken G, Stroup WW, Wolfinger R.SAS System for Mixed
Models. Cary, NC: SAS Institute Inc; 1996
20. Ng PC. The effectiveness and side effects of dexamethasone in preterm infants with bronchopulmonary dysplasia. Arch Dis Child. 1993;68: 330 –336
21. Papile L-A, Tyson JE, Stoll BJ, et al. A multicenter trial of two dexa-methasone regimens in ventilator-dependent premature infants.N Engl
J Med. 1998;338:1112–1118
22. Alexander GR, Himes JH, Kaufman RB, Mor J, Kogan M. A United States national reference for fetal growth.Obstet Gynecol. 1996;87: 163–168
24. American Academy of Pediatrics, Committee on Nutrition. Nutritional needs of low-birth-weight infants.Pediatrics. 1985;75:976 –986 25. Lubchenco LO, Hansman C, Dressler M, Boyd E. Intrauterine growth as
estimated from liveborn birth weight data at 24 to 42 weeks of gestation. J Pediatr. 1963;32:793– 800
26. Usher R, McLean F. Intrauterine growth of live-born Caucasian infants at sea level: standards obtained from measurements in 7 dimensions of infants born between 25 and 44 weeks of gestation.J Pediatr. 1969;74: 901–910
27. Brenner WE, Edelman DA, Hendricks CH. A standard of fetal growth for the United States of America.Am J Obstet Gynecol. 1976;126:555–564 28. Sparks JW. Human intrauterine growth and nutrient accretion.Semin
Perinatol. 1984;8:74 –93
29. Jackson AA, Shaw JCL, Barber A, Golden MHN. Nitrogen metabolism in preterm infants fed human donor breast milk: the possible essenti-ality of glycine.Pediatr Res. 1981;15:1454 –1461
30. Lubchenco LO, Hansman C, Boyd E. Intrauterine growth in length and head circumference as estimated from live births at gestational ages from 26 to 42 weeks.Pediatrics. 1966;37:403– 408
31. Lucas A, Gore SM, Cole TJ, et al. Multicentre trial on feeding low birthweight infants: effects of diet on early growth.Arch Dis Child. 1984;59:722–730
32. Hack M, Breslau N, Weissman B, Aram D, Klein N, Borawski E. Effect of very low birth weight and subnormal head size on cognitive abilities at school age.N Engl J Med. 1991;325:231–237
33. Dunn L, Hulman S, Weiner J, Kleigman R. Beneficial effects of early hypocaloric enteral feeding on neonatal gastrointestinal function: pre-liminary report of a randomized trial.J Pediatr. 1988;112:622– 629 34. Slagle TA, Gross SJ. Effect of early low-volume enteral substrate on
subsequent feeding tolerance in very low birth weight infants.J Pediatr. 1988;113:526 –531
35. Berseth CL. Minimal enteral feedings.Clin Perinatol. 1995;22:195–205 36. Tyson JE, Kennedy KA. Minimal enteral nutrition in parenterally fed
neonates. In: Sinclair J, Bracken M, Soll RF, Hobar JD, eds.Neonatal
Module of the Cochrane Database of Systematic Reviews. Update Software.
Oxford, London, England: BMJ Publishing Group; The Cochrane Col-laboration, Issue No. 1, 1998
37. Frank L, Sosenko IRS. Undernutrition as a major contributing factor in the pathogenesis of bronchopulmonary dysplasia.Am Rev Respir Dis. 1988;138:725–729
38. Rubin LP, Richardson DK, Bednarek FJ, Olsen I, McCormick MC, SNAP-II Study Group. Longitudinal growth in hospitalized VLBW infants: identification of patient characteristics and inter-NICU differ-ences.Pediatr Res. 1997;41:239A.
THE HAND LEARNS TO SPEAK
The final proof that sign is a “natural language” comes from the work of Laura Ann Petitto at McGill University in Montreal. In a groundbreaking series of observations and experiments, she has shown that deaf children acquire sign in the same graduated manner, and on precisely the same timetable, as hearing children acquire speech. Furthermore, among bilingual deaf children who are unimodal (two different languages, both in sign) and bimodal (one language signed, the other spoken), the developmental profiles for the two languages are identical. Finally, Petitto found that in the extremely rare instances in whichhearingchildren raised by deaf parents are taught sign as a native language, the processes and milestones parallel those observed in both deaf and hearing children.
Petitto L. On the autonomy of language and gesture: evidence from the acquisition of personal pronouns in American sign language.Cognition.1987;1:1– 62
Wilson FR.The Hand.New York, NY: Pantheon; 1998
DOI: 10.1542/peds.104.2.280
1999;104;280
Pediatrics
Stevenson and Lu-Ann Papile
Shankaran, Charles R. Bauer, Sheldon B. Korones, Barbara J. Stoll, David K.
F. Donovan, Linda L. Wright, Vasilis Katsikiotis, Jon E. Tyson, William Oh, Seetha
Richard A. Ehrenkranz, Naji Younes, James A. Lemons, Avroy A. Fanaroff, Edward
Longitudinal Growth of Hospitalized Very Low Birth Weight Infants
Services
Updated Information &
http://pediatrics.aappublications.org/content/104/2/280
including high resolution figures, can be found at:
References
http://pediatrics.aappublications.org/content/104/2/280#BIBL
This article cites 35 articles, 11 of which you can access for free at:
Subspecialty Collections
sub
http://www.aappublications.org/cgi/collection/fetus:newborn_infant_
Fetus/Newborn Infant
milestones_sub
http://www.aappublications.org/cgi/collection/growth:development_
Growth/Development Milestones
http://www.aappublications.org/cgi/collection/agency_abcs
Agency ABC's
following collection(s):
This article, along with others on similar topics, appears in the
Permissions & Licensing
http://www.aappublications.org/site/misc/Permissions.xhtml
in its entirety can be found online at:
Information about reproducing this article in parts (figures, tables) or
Reprints
http://www.aappublications.org/site/misc/reprints.xhtml
DOI: 10.1542/peds.104.2.280
1999;104;280
Pediatrics
Stevenson and Lu-Ann Papile
Shankaran, Charles R. Bauer, Sheldon B. Korones, Barbara J. Stoll, David K.
F. Donovan, Linda L. Wright, Vasilis Katsikiotis, Jon E. Tyson, William Oh, Seetha
Richard A. Ehrenkranz, Naji Younes, James A. Lemons, Avroy A. Fanaroff, Edward
Longitudinal Growth of Hospitalized Very Low Birth Weight Infants
http://pediatrics.aappublications.org/content/104/2/280
located on the World Wide Web at:
The online version of this article, along with updated information and services, is
by the American Academy of Pediatrics. All rights reserved. Print ISSN: 1073-0397.