Medicaid Participation by Private and Safety Net Pediatricians,
1993 and 2000
Suk-fong S. Tang, PhD; Beth K. Yudkowsky, MPH; and Jean C. Davis, MPP
ABSTRACT. Background. Eligibility expansions and managed care growth were 2 major forces shaping the Medicaid program during the 1990s. Although Medicaid managed care was introduced to contain rising costs of growing enrollment and expenditures, it also offered states an opportunity to improve enrollees’ access to mainstream health care providers. By enrolling in com-mercial managed care plans, they could gain access to private office-based physicians, thus eliminating a 2-tiered health care system.
Objectives. To investigate changes in private and safety net pediatricians’ participation in Medicaid be-tween 1993 and 2000, a period noted for eligibility expan-sion for children and rapid managed care growth.
Design. Survey data collected from private and safety net pediatricians in 1993 and 2000 were analyzed to in-vestigate how pediatricians’ Medicaid caseloads were af-fected by 1) their practice setting, and 2) whether they accepted all Medicaid patients.
Results. Pediatricians’ Medicaid caseloads increased significantly between 1993 and 2000, with those in pri-vate practice settings reporting greater increases. More pediatricians accepted all Medicaid patients in 2000, but Medicaid caseloads remained twice as high for safety net pediatricians. Medicaid caseloads increased dramatically for those accepting all Medicaid patients, except in safety net settings, where pediatricians who were turning away some Medicaid patients had heavier Medicaid caseloads than those who accepted all Medicaid patients.
Conclusions. Although Medicaid children were still disproportionately served in the safety net in 2000, their access to private pediatricians had improved since 1993. But a ceiling in the safety net’s capacity to absorb more Medicaid patients was suggested by the finding that safety net pediatricians turned away Medicaid patients as their Medicaid caseloads increased. Combined with decreasing participation by commercial plans in the Medicaid managed care market, increasing hospital emergency department overloads, and growing Title XXI Medicaid enrollments, interventions may be needed to avert a looming pediatric provider shortage for publicly insured low-income children.Pediatrics 2003;112:368 –372;
pediatrician, participation, Medicaid, safety net, main-stream.
ABBREVIATIONS. ED, emergency department; AAP American Academy of Pediatrics; MMC, Medicaid managed care.
E
ligibility expansions through Title XIX and Ti-tle XXI1,2had significantly increased Medicaid enrollment since the early 1990s. By 2000, Med-icaid covered almost 3 of 10 children and young adults under age 21, and 4 of 10 children under age 6.3,4But coverage did not translate readily into access to care for all Medicaid patients. Despite the law (42 USCA § 1396a(a)(30)(A)) requiring that Medicaid re-cipients have the same access to care that the general population does in the same geographic area, the chronic lack of access to health care from mainstream providers (ie, providers with a large, private, patient base) has helped create a 2-tiered system of care, driving a disproportionate share of Medicaid pa-tients to seek care in emergency departments (EDs) and hospitals.5Difficulties in accessing care in main-stream settings despite coverage was often attributed to private providers’ unwillingness to participate in the Medicaid program due to low Medicaid pay-ments and other reimbursement and administrative issues.6In 1993, a survey conducted by the American Academy of Pediatrics (AAP) of its members found that less than half of pediatricians accepted all Med-icaid patients who contacted them, although 7 of 10 were accepting all non-Medicaid patients.7Then came the opportunity for states to provide Medicaid enrollees better access to mainstream health care providers through the implementation of Medicaid managed care (MMC).8 Although MMC was initially designed to contain Medicaid costs in a period of accelerated health care spending growth, federal legislation regulating MMC did, until 1997, require state plans enrolling Medicaid clients to in-clude at least 25% of their membership from non-Medicaid sources.9By enrolling Medicaid recipients into commercial managed care plans, Medicaid cli-ents could gain reliable access to mainstream pri-mary care providers and thus be able to enjoy access to and quality of care like the privately insured.10
By the late 1990s, however, the exit of commercial plans from the Medicaid market11,12 gave way to uncertainties over the prospect of retaining Medicaid patients in mainstream care settings. At the same time, the nation’s safety net providers faced increas-ing demand for free care from the uninsured13and came under increasing financial pressure, raising questions about their viability in some communi-ties.14 At the same time when more Medicaid
pa-From the American Academy of Pediatrics, Department of Practice and Research, Elk Grove Village, Illinois.
Received for publication Aug 26, 2002; accepted Nov 12, 2002.
The views expressed reflect those of the authors and not those of the American Academy of Pediatrics.
Address correspondence to Suk-fong S. Tang, PhD, American Academy of Pediatrics, Department of Practice and Research, 141 Northwest Point Blvd, Elk Grove Village, IL 60009. E-mail: stang@aap.org
tients were assigned to a rising number of Medicaid-only or Medicaid-dominated plans owned and operated mainly by hospitals and academic health centers,15 an increasing number of hospital EDs started to experience capacity overloads.16 A recent survey17 of the nation’s hospitals showed that one third of US hospitals, 47% of urban hospitals, and 48% of teaching hospitals rated their EDs as operat-ing over capacity, where the average wait time for treatment exceeded an hour. One third of all hospi-tals and more than half of urban hospihospi-tals experi-enced ED diversion when their EDs could no longer accept all patients by ambulance.
With these recent developments threatening to di-minish a usual source of care in the safety net for Medicaid patients, and uncertainties of access to pri-vate providers looming as commercial plans exit the Medicaid market, data on how mainstream and safety net providers served Medicaid-insured chil-dren is needed to inform public policy efforts. With-out such efforts, the Medicaid program risks losing the participation of mainstream pediatric providers gained over the last decade, at a time when the provider capacity is being stretched by millions more new Medicaid and State Children’s Health Insurance Program enrollees.18
Because pediatricians provide more health visits to children than all other medical specialties com-bined,19their willingness to accept Medicaid patients is pivotal to the program’s capacity to deliver care to
⬎20 million child enrollees. Changes in pediatri-cians’ Medicaid caseloads during a decade of eligi-bility expansions and MMC growth is the subject of investigation of this study. Based on 2 AAP surveys, one conducted in 19937and the other in 2000,20this study investigates pediatrician participation in the Medicaid program in private and safety net settings. Changes in pediatricians’ Medicaid caseloads at the 2 points in time will be examined in relation to 1) practice setting (ie, safety net hospitals and clinics versus private office settings) and 2) whether the respondent accepted all Medicaid patients who con-tacted them.
METHODS
Based on survey data collected in 19937and in 200020from a random sample of pediatrician members of the AAP, the current study investigates how the following 2 factors affected the extent to which pediatricians served Medicaid insured children. These factors are: 1) practicing in the safety net (defined as medical schools, public clinics and nonfederal hospitals) versus private settings (defined as solo, 2-physician, group practices, and health maintenance organizations), and 2) accepting all Medicaid pa-tients, versus only some or none. Respondents to the 1993 and 2000 surveys were asked a series of questions on an 8-page survey, which included questions about the respondent’s patient caseload by source of payment, acceptance of patients insured by Medicaid and non-Medicaid plans, practice setting, and respondent demo-graphics.
Using univariate and multivariate procedures available in the Statistical Package for the Social Sciences (SPSS),21 the current study compares 1) Medicaid caseloads among pediatricians prac-ticing in private office and safety net settings, and 2) the propor-tion of pediatricians reporting that they accepted all Medicaid patients in 1993 and in 2000. A multiple regression was then used to examine the relative contribution of these factors to the propor-tion of patients covered by Medicaid in the respondent’s practice in 2000, as compared with 1993. Respondent characteristics in-cluding age, gender, employee status, resident status, and location of medical school (US vs international medical graduate) were entered as control variables. Only significant predictor variables were included in the final model.
RESULTS Survey Sample and Response
The 1993 survey included a sample of 15 454 fel-lows of the AAP. A final response rate of 68% was obtained after 5 mailings. The 2000 survey included a sample of 13 212 fellows of the AAP. A final re-sponse rate of 67% was obtained after a postcard reminder and 4 additional mailings to contact non-responders.
Characteristics of Survey Respondents in 1993 and in 2000
Respondent demographics and practice character-istics reported in the 1993 and 2000 surveys are shown in Table 1. Respondents were younger, more likely to be female, more likely to work as employ-ees, more likely to practice in group practices than in solo or 2-physician practices, and more likely to be
TABLE 1. Characteristics of Respondents and their Practices in the 1993 and 2000 Surveys
1993 2000
Percent (n) Percent (n)
Primary practice setting
Percentage practicing in private settings, defined as: 71.1% (6050) 67.6% (4540)
Solo practice 18.1% (1542) 11.1% (745)
2-physician practice 8.4% (717) 6.8% (459)
Pediatric group practice 28.5% (2424) 31.8% (2138)
Multispecialty group practice 9.6% (820) 14.3% (959)
Health maintenance organization 6.4% (547) 3.6% (239)
Percentage practicing in safety net settings, defined as: 22.0% (1874) 24.9% (1674) Medical schools/university hospitals 9.7% (826) 12.9% (867)
Non-government hospital 7.4% (632) 7.2% (483)
City/county/state government hospital/clinic 4.9% (416) 4.8% (324)
% Other 6.8% (579) 7.5% (502)
% Time spent in general pediatrics 69.8% (8560) 72.1% (6800) % Employee (defined as respondents reporting⬎50%
of direct patient care time spent in employed settings)
41.2% (3780) 50.0% (3531)
% Residents 3.4% (292) 7.8% (530)
Mean age 45.3 (8805) 44.6 (6695)
Gender (% female) 35.1% (3000) 46.3% (3194)
international medical graduates in 2000 than in 1993. These trends are consistent with changes in pediatri-cian demographics and characteristics according to the American Medical Association Physician Master-file.22–24 As the average pediatrician age decreased, they were more likely to be residents, more likely to practice general pediatrics, and more likely to prac-tice in medical school/university hospital settings in 2000 than in 1993.
Participation in Medicaid by Private and Safety Net Pediatricians, 1993 and 2000
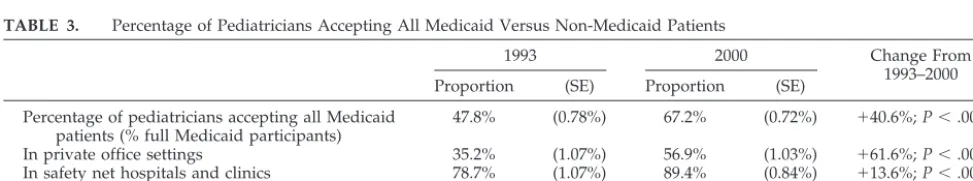
Pediatrician participation in Medicaid as mea-sured by 1) the proportion of Medicaid caseloads in the practice, and 2) proportion of physicians accept-ing all Medicaid patients contactaccept-ing them, increased significantly from 1993–2000 (Table 2). The percent-age of Medicaid patients in a pediatrician’s practice rose by 23.9% from 1993–2000. Although a seemingly dramatic increase, this change is consistent with pa-tient visit data based on 1992–1993 and 1999 –2000 National Ambulatory Medical Care Surveys,19which collect data from a stratified random sample of prac-tices, physicians and patient visits in the US. Consis-tent with the reported increase in Medicaid caseloads by AAP Survey respondents in the current study, the National Ambulatory Medical Care Surveys data showed a 19.0% increase in the proportion of Med-icaid-paid visits provided by pediatricians and pedi-atric subsepcialists from 1992–1993 to 1999 –2000. Concurrent with this increase was a 40.6% increase in the proportion of pediatricians reporting that they accepted all Medicaid patients who contacted them. As shown in Table 3, although pediatricians were still more open to non-Medicaid than Medicaid pa-tients in 2000, two thirds of pediatricians indicated that they accepted all Medicaid patients in 2000, compared with under half in 1993. Medicaid partic-ipation by pediatricians in private office settings in-creased at a faster rate than their counterparts in safety net hospitals and clinics between 1993 and 2000. Nonetheless, safety net pediatricians continued
to disproportionately serve Medicaid children. In 2000, safety net pediatricians reported that half of their patients were insured by Medicaid, while pri-vate pediatricians reported ⬍25% of their patients with the same coverage. Also, 89% of safety net pediatricians reported accepting all Medicaid pa-tients in 2000, compared with 57% of private pedia-tricians.
Factors Affecting Medicaid Caseloads—Results of a Multiple Regression
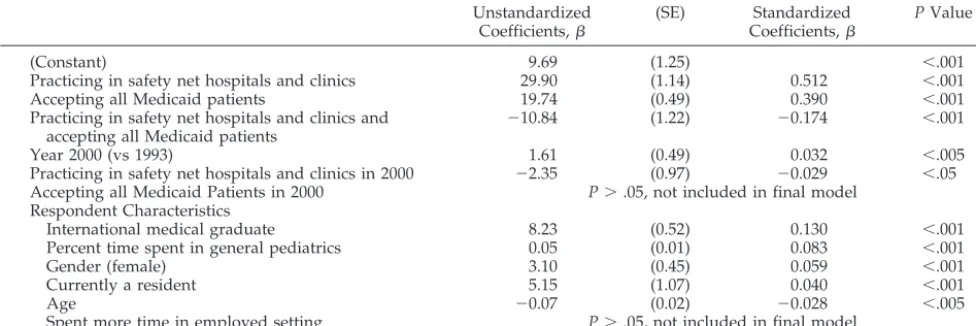
Medicaid caseloads were analyzed using multiple regression with year of survey, respondent-reported acceptance of all Medicaid patients, and primary practice setting (private vs safety net) as regressors. Two-way interactions among primary practice set-ting, acceptance of all Medicaid patients, and survey year were included in the model, as were respondent characteristics including age, gender, employee sta-tus, resident stasta-tus, and location of medical school (US vs international medical graduate).
The regression was a moderate fit (adjustedR2⫽ 34.8%) and the overall relationship was significant (F10,10039⫽535.9;P⬍.001). Practicing in a safety net setting, accepting all Medicaid patients, and survey year (ie, in 2000 vs 1993) were all highly significant (P ⬍ .001) and positively associated with higher Medicaid caseloads, although survey year had a rel-atively small effect. Two of 3 interaction effects were also significant. Practicing in a safety net setting and accepting all Medicaid patients was highly signifi-cant (P ⬍ .001) and had a large negative effect on Medicaid caseloads. Practicing in safety net settings in 2000 was also significant (P⬍.05) and negatively associated with Medicaid caseloads, although it had a smaller effect. Accepting all Medicaid patients in 2000 was not significant and left out of the final model. With the exception of time spent in employed settings, all respondent characteristics were also sig-nificantly associated with Medicaid caseloads. Re-sults of the regression are shown in Table 4. An examination of the coefficients of the regression
sug-TABLE 2. Proportion of Patients Covered by Medicaid, 1993 and 2000
1993 2000 Change From
1993–2000
Mean (SE) Mean (SE)
In private office settings 18.14% (.28%) 23.75% (.36%) ⫹30.9%;P⬍.001 In safety net hospitals and clinics 46.88% (.69%) 49.85% (.72%) ⫹6.3%;P⬍.010 In both settings 24.29% (.30%) 29.93% (.36%) ⫹23.2%;P⬍.001 SE indicates standard error.
TABLE 3. Percentage of Pediatricians Accepting All Medicaid Versus Non-Medicaid Patients
1993 2000 Change From
1993–2000 Proportion (SE) Proportion (SE)
Percentage of pediatricians accepting all Medicaid patients (% full Medicaid participants)
47.8% (0.78%) 67.2% (0.72%) ⫹40.6%;P⬍.001
In private office settings 35.2% (1.07%) 56.9% (1.03%) ⫹61.6%;P⬍.001
In safety net hospitals and clinics 78.7% (1.07%) 89.4% (0.84%) ⫹13.6%;P⬍.001 Percentage of pediatricians accepting all
non-Medicaid patients
69.1% (0.58%) 76.5% (0.60%) ⫹10.7%;P⬍.001
gests that practice setting remains the most impor-tant predictor of Medicaid caseloads in 1993 and in 2000. The model estimated that with other variables held constant, Medicaid caseload was 29.9 percent-age points higher for those practicing in safety net hospitals and clinics. Full Medicaid participation (ac-ceptance of all Medicaid patients) was the second most important predictor, accounting for an esti-mated 19.7-percentage point increase in Medicaid caseloads. The next most important predictor was the interaction between practice setting and full par-ticipation, which estimated that pediatricians prac-ticing in safety net hospitals and clinics who did not accept all Medicaid patients had 10.8 percentage points more Medicaid patients than those who did. Survey year had a smaller though significant effect when other variables were controlled for, accounting for a 1.6-percentage point increase in Medicaid case-loads between 1993 and 2000. A significant interac-tion between practice setting and survey year sug-gests some narrowing, by 2.3%, of a large gap (29.9%) in Medicaid caseloads attributed to practice setting.
With the exception of time spent in employed set-tings, all respondent characteristic variables signifi-cantly affected Medicaid caseloads. By far, location of the respondent’s graduate school (US vs interna-tional medical graduates) was the most important factor. International medical graduates were pre-dicted to have 8.2% more Medicaid patients than US medical graduates. Higher shares of Medicaid pa-tients were also associated with 1) pediatricians spending more time in general pediatrics, 2) female pediatricians, 3) residents, and 4) younger pediatri-cians.
DISCUSSION
Results of this study show that Medicaid caseloads increased for private and safety net pediatricians between 1993 and 2000. Although the average Med-icaid caseload went up at a faster rate for private pediatricians than it did for safety net pediatricians, the proportion of Medicaid patients served by the former remained less than half of the latter in 2000,
and below the level of Medicaid enrollees as a pro-portion of the child population.3,4
Results also indicate a dramatic increase in the proportion of pediatricians accepting all Medicaid patients, and a substantial increase in Medicaid ca-seloads for pediatricians who accepted all Medicaid patients seeking care from them. The only exception was observed in safety net practices, where pediatri-cians who were turning away some Medicaid pa-tients had heavier Medicaid caseloads than those who accepted all Medicaid patients.
Demographic and other changes in the pediatric workforce also seem to be related to the observed increase in Medicaid caseloads from 1993–2000. The increase in the proportion of Medicaid patients in pediatric practices may in part be explained by the increase in the proportion of young pediatricians (who were also more likely to be residents and prac-tice in medical school/university hospital settings), female pediatricians, general pediatricians, and in-ternational medical graduates in the pediatrician workforce.
In 1993, private pediatricians reported an average Medicaid caseload of 18.1% at a time when annual Medicaid enrollment was 28.4% of children under age 21 and 44.2% of infants and children under age 6.3,4 The average Medicaid caseload for private pe-diatricians rose to 23.8% in 2000, compared with an annual Medicaid enrollment of 29.2% for children under age 21 and 40.3% for infants and children under age 6.3,4
Whether as a result of MMC, or of Title XXI-funded Medicaid expansions enrolling children from higher-income families, Medicaid children’s access to private pediatricians’ care had improved between 1993 and 2000 overall. Nonetheless, the concentra-tion of Medicaid patients in safety net care settings was still prominent in 2000. With Medicaid caseloads in safety net practices twice as high as in private practices and Medicaid children still seeking routine care from hospitals and EDs,25 it would be prema-ture to conclude that the gap in a 2-tiered health care system had been closed.
TABLE 4. Coefficients and Significance of Variables Included in the Final Regression Model With Proportion of Medicaid-Insured Patients in the Respondent’s Practice as Dependent Variable
Unstandardized
Coefficients, (SE) Coefficients,Standardized PValue
(Constant) 9.69 (1.25) ⬍.001
Practicing in safety net hospitals and clinics 29.90 (1.14) 0.512 ⬍.001
Accepting all Medicaid patients 19.74 (0.49) 0.390 ⬍.001
Practicing in safety net hospitals and clinics and
accepting all Medicaid patients ⫺
10.84 (1.22) ⫺0.174 ⬍.001
Year 2000 (vs 1993) 1.61 (0.49) 0.032 ⬍.005
Practicing in safety net hospitals and clinics in 2000 ⫺2.35 (0.97) ⫺0.029 ⬍.05 Accepting all Medicaid Patients in 2000 P⬎.05, not included in final model
Respondent Characteristics
International medical graduate 8.23 (0.52) 0.130 ⬍.001
Percent time spent in general pediatrics 0.05 (0.01) 0.083 ⬍.001
Gender (female) 3.10 (0.45) 0.059 ⬍.001
Currently a resident 5.15 (1.07) 0.040 ⬍.001
Age ⫺0.07 (0.02) ⫺0.028 ⬍.005
CONCLUSIONS
Along with the good news on improved access to private pediatric practices for Medicaid children, this study showed a more worrisome pattern with safety net pediatricians turning away Medicaid patients as their Medicaid caseloads increased. This pattern sug-gests a ceiling in the safety net pediatricians’ capacity to absorb more Medicaid patients. Combined with increasing hospital ED overloads, it may cause more hardship for Medicaid-insured children who lack access to nonsafety net providers. Compounding the problem is an estimated 6 million unenrolled Med-icaid and State Children’s Health Insurance Pro-gram-eligible children26who, as a result of Title XXI program outreach and enrollment, are joining the programs at the rate of⬎1 million a year.27 Unless additional capacity can be developed in mainstream settings to relieve the overcrowding of the ED and provide care for new and potential enrollees, Medic-aid coverage will not translate into medical care for the low-income children it serves.
If MMC had been instrumental and successful to a degree in bringing Medicaid patients into private pediatric practices, it is crucial that the enabling con-ditions, such as participation by commercial man-aged care plans, be sustained to protect access to care in mainstream settings by Medicaid children. No matter how willing private pediatricians may be to accept all Medicaid children, substitution of com-mercial managed care plans by Medicaid-only or Medicaid-dominated plans run by hospitals and ac-ademic health centers will severely limit access to private pediatric practices by Medicaid children. With Medicaid reimbursement substantially lower than commercial payment, and Medicaid rate in-creases lagging behind the general rate of inflation,28 Medicaid participation by private providers cannot be safeguarded without interventions. To retain com-mercial plans in the Medicaid market, states can use the newly created option29 that allows them to set actuarially sound capitation rates for MMC and adopt judicious reporting requirements8to lower op-erating costs for participating plans. To avert a loom-ing crisis of a pediatric provider shortage for the Medicaid program, policy makers must now reexam-ine barriers to participation by commercial plans and private pediatric providers and weigh cost contain-ment concerns against the availability of medical care to low-income children.
ACKNOWLEDGMENTS
This study was supported by the American Academy of Pedi-atrics Friends of Children Fund.
We thank Drs Benard Dreyer, Lew Margolis, Matthew Gillman, and Donald Orr for their input. We also thank Steven Pedlow of NORC at the University of Chicago for his advice on statistical procedures.
REFERENCES
1.State Medicaid Coverage of Pregnant Women and Children. MCH Update.
Washington, DC: National Governors’ Association; 1997
2. The Henry J. Kaiser Family Foundation. CHIP program type 2002, state health facts. Available at: http://www.statehealthfacts.kff.org 3. US Bureau of Census. National Population Projections II. Detailed files.
Middle Series (A).Available at: http://www.census.gov/population/ www/ projections/natdet-D1A.html
4. Center for Medicare and Medicaid Services. Medicaid Program statis-tics, fiscal year 1993 and fiscal year 2000. Available at: http:// cms.hhs.gov/medicaid/msis/mstats.asp
5. Perloff JD, Kletke PR, Fossett JW, Banks S. Medicaid participation among urban primary care physicians.Med Care.1997;35:142–157 6. Perloff JD, Kletke P, Fossett J. Which physicians limit their Medicaid
participation, and why.Health Serv Res.1995;30:7–26
7. American Academy of Pediatrics, Department of Research.Pediatrician Participation in Medicaid: A Survey of AAP Members.Elk Grove Village, IL: American Academy of Pediatrics, Department of Research; 1994 8. Coughlin TA, Long SK, Holahan J, et al. Commercial health plan
par-ticipation in Medicaid managed care: an examination of six markets [issue paper]. Available at: http://www.kff.org/content/2001/2219/ 2219.pdf
9. Requirement of 25% non-Medicare/Medicaid enrollment. State Medic-aid Manual, Part 2, 2086.8. HCFA Publ. No. 45-2. Available at: http:// www.keln.org/hcfa_docs/smm2.html
10. Fossett JW, Thompson FJ. Back-off, not backlash in Medicaid managed care.J Health Polit Policy Law.1999;24:1159 –1172
11. Commercial insurers shun Medicaid market. State health watch. Avail-able at: http://www.ahcpub.com/ahc_root_html/hot/archive/ shw1198.html
12. Felt-Lisk S, Yang S. Changes in health plans serving Medicaid, 1993–1996.Health Aff.1997;16:125–133
13. Norton SA, Lipson DJ. Portraits of the safety net: the market, policy environment, and safety net response [occasional paper no. 19]. Avail-able at: http://newfederalism.urban.org/pdf/occ19.pdf
14. Lewin ME, Altman S, eds.America’s Health Care Safety Net: Intact but Endangered. Committee on the Changing Market, Managed Care, and the Future Viability of Safety Net Providers.Washington, DC: National Acad-emy Press, Institute of Medicine; 2000
15. Felt-Lisk S, Dodge R, McHugh M. Trends in health plans serving Medicaid—2000 data update. Available at: http://www.kff.org/ content/2001/4009/4009.pdf
16. A sign of the times. State health notes. National Conference of State Legislatures. March 26, 2001;22:(345)1
17. The Lewin Group.Emergency Department Overload: A Growing Crisis.
Chicago, IL: American Hospital Association; 2002. Available at: http:// www.msha.com/press/pdf_files/MSHA_ED_Presentation.pdf 18. Broaddus M, Ku L. Nearly 95% of low-income uninsured children now
are eligible for Medicaid or SCHIP. Available at: http:// www.cbpp.org/12– 6-00schip.pdf
19. Tang S-fS, Olson LM, Cull WL, Yudkowsky BK. From infants to teens: Pediatricians provided primary care for more children, 1991–2000. Pre-sented at: Pediatric Academic Societies Meeting; May 2003; Seattle, WA 20. American Academy of Pediatrics. Pediatrician participation in Medicaid/SCHIP: survey of fellows of the American Academy of Pe-diatrics. Available at: http://www.aap.org/statelegislation/med-schip/introduction.pdf
21. SPSS.SPSS for Windows, Version 9.0.Chicago, IL: SPSS; 1998 22. American Medical Association Press.Physician Characteristics and
Dis-tribution in the U. S., 1993 Edition. Chicago, IL: American Medical As-sociation Press; 1993
23. American Medical Association, Center for Health Policy Research. Phy-sician Socioeconomic Statistics, 1999 –2000 Edition.Chicago, IL: American Medical Association, Center for Health Policy Research; 1999 24. American Medical Association, Center for Health Policy Research.
Phy-sician Characteristics and Distribution in the US, 2001–2002 Edition. Chi-cago, IL: American Medical Association, Center for Health Policy Research; 2001
25. Turner GM. The uninsured and affordable health care coverage. Pre-pared witness testimony to the Committee on Energy and Commerce, Subcommittee on Health. Available at: http://energycommerce.house. gov/107/hearings/02282002hearing499/turner842.htm
26. Medicaid/state program eligibility of uninsured children, by state, 2000. In: State report 2000: children’s health insurance status, Medicaid/ SCHIP eligibility and enrollment. Available at: http://www.aap.org/ advocacy/chiper2000.pdf
27. The State Children’s Health Insurance Program annual enrollment re-port, federal fiscal year 2001. Available at: http://www.cms.hhs.gov/ schip/schip01.pdf
28. Norton S. Recent trends in Medicaid fees, 1993–1998. Available at: http://newfederalism.urban.org/pdf/discussion99 –12.pdf
DOI: 10.1542/peds.112.2.368
2003;112;368
Pediatrics
Suk-fong S. Tang, Beth K. Yudkowsky and Jean C. Davis
Medicaid Participation by Private and Safety Net Pediatricians, 1993 and 2000
Services
Updated Information &
http://pediatrics.aappublications.org/content/112/2/368
including high resolution figures, can be found at:
References
http://pediatrics.aappublications.org/content/112/2/368#BIBL
This article cites 4 articles, 2 of which you can access for free at:
Subspecialty Collections
_management_sub
http://www.aappublications.org/cgi/collection/administration:practice
Administration/Practice Management
following collection(s):
This article, along with others on similar topics, appears in the
Permissions & Licensing
http://www.aappublications.org/site/misc/Permissions.xhtml
in its entirety can be found online at:
Information about reproducing this article in parts (figures, tables) or
Reprints
http://www.aappublications.org/site/misc/reprints.xhtml
DOI: 10.1542/peds.112.2.368
2003;112;368
Pediatrics
Suk-fong S. Tang, Beth K. Yudkowsky and Jean C. Davis
Medicaid Participation by Private and Safety Net Pediatricians, 1993 and 2000
http://pediatrics.aappublications.org/content/112/2/368
located on the World Wide Web at:
The online version of this article, along with updated information and services, is
by the American Academy of Pediatrics. All rights reserved. Print ISSN: 1073-0397.