Doctoral Dissertations Student Scholarship
Fall 2016
Navigating Barriers at Work: Exploring the
Perceptions of Employees with Disabilities
Kimberly G. Phillips
University of New Hampshire - Main Campus, [email protected]
Follow this and additional works at:https://scholars.unh.edu/dissertation
This Dissertation is brought to you for free and open access by the Student Scholarship at University of New Hampshire Scholars' Repository. It has been accepted for inclusion in Doctoral Dissertations by an authorized administrator of University of New Hampshire Scholars' Repository. For more information, please [email protected].
Recommended Citation
Phillips, Kimberly G., "Navigating Barriers at Work: Exploring the Perceptions of Employees with Disabilities" (2016).Doctoral Dissertations. 2382.
NAVIGATING BARRIERS AT WORK: EXPLORING THE PERCEPTIONS OF
EMPLOYEES WITH DISABILITIES
BY
KIMBERLY G. PHILLIPS
BA, University of New Hampshire, 1990
MA, University of New Hampshire, 2008
DISSERTATION
Submitted to the University of New Hampshire
in Partial Fulfillment of
the Requirements for the Degree of
Doctor of Philosophy
in
Psychology
This dissertation has been examined and approved in partial fulfillment of the requirements
for the degree of Doctor of Philosophy in Psychology by:
Dissertation Director, John D. Mayer, PhD, Professor of Psychology
Andrew J. Houtenville, PhD, Professor of Economics
Rebecca M. Warner, PhD, Professor of Psychology
Vidya Sundar, PhD, Associate Professor of Occupational Therapy
Debra L. Brucker, PhD, Research Assistant Professor, Institute on Disability
On August 8, 2016
Original approval signatures are on file with the University of New Hampshire Graduate
DEDICATION
ACKNOWLEDGEMENTS
John D. “Jack” Mayer. I am amazed by the amount of time you dedicated to me, the faith you showed in my ability, and your unfailing willingness to work with me despite several obstacles along the way. You taught me so much - more than you realize - and I am incredibly grateful and proud to have been your student.
Andrew Houtenville. Your generosity, support, and instruction have been instrumental to my success at work and with this dissertation. I feel very fortunate to be part of your team and look forward to continuing the research that you inspired me to begin.
Rebecca Warner, Debra Brucker, and Vidya Sundar. Esteemed committee members, you each brought a unique and expert perspective to my work. It was an honor to receive your insights, feedback, and guidance. Many, many thanks.
My family. Mom, as always, you were a constant source of both intellectual and emotional support. From psyc-GRE prep to vetting dissertation topics, you saw me through every phase and helped me believe I could do it. Jon, having you at the defense was
unspeakably awesome. Seeing Pearl Jam together two nights before also didn’t suck.
Jesse Gushee & Madelyn Gushee. What can I say? You were 2 and 4 years old when I started. Especially during this last stretch, you were incredibly helpful. You pieced me together whenever I fell apart; you listened to and read aloud sections of my work to help me “hear” it. You came to meetings, picked up slack at home when I worked too hard or too long. You cheered me on. This is for you, with all of my love. Please tell your dad this is definitive proof: I am officially smarter than he is.
Kari Lynn Danielson Grimes. Your JD and my PhD. Since we were 6, we’ve been in an awesome 3-legged race; this ends the latest heat. I guess I’ve slowed a little in our middle years, but I’ll see what I can do to pick up the pace! Charly, Monkey Do sat on my computer throughout the whole defense – thank you.
Finally, Sissy & her alternating siblings (Delila Jones, Midder, & Nookie Crew). For better or worse, you were (literally) right by my side every step of the way these last several years.
Funding for this research was provided by grant number 90RT5037-01-00 from the National Institutes for Disability, Independent Living, and Rehabilitation Research.
TABLE OF CONTENTS
DEDICATION... iii
ACKNOWLEDGEMENTS... iv
LIST OF TABLES... x
LIST OF FIGURES... xii
ABSTRACT ... xiii
CHAPTER PAGE I. INTRODUCTION TO THE STUDIES ... 1
Navigating Barriers at Work ... 1
Personal Barriers ... 1
Interpersonal Barriers ... 2
Individual Differences in the Successful Navigation of Attitudinal Barriers ... 2
Purpose of the Present Studies ………... 3
II. EMPLOYEES’ WITH DISABILITIES PERCEIVED POTENTIAL AT WORK …… 5
Perception of Work-Self Competence ... 5
Occupational Self-Efficacy ... 6
Coping Style ... 7
Perception of Supervisor Support ………... 10
Person-Focused Support ... 11
Task-Focused Support ... 11
Conceptual Model of Perceived Potential at Work ... 12
Examination of the Conceptual Model Using Self-Judgments ……… 13
Examination of the Conceptual Model Using Lifespace Data ……… 14
Expected Work Outcomes ……….…....….. 15
The Present Studies’ Contribution to the Literature ………. 16
III. STUDY 1: DEVELOPMENT AND TESTING OF TWO MEASUREMENT MODELS OF PERCIEVED POTENTIAL AT WORK AMONG EMPLOYEES WITH DISABILITIES ... 17
Hypotheses ... 17
Methods ……… 18
Participants ……….. 18
Measures ……….. 19
Occupational Self-Efficacy ………. 19
Coping Style ………. 19
Person-Focused Supervisor Support ……… 20
Task-Focused Supervisor Support ……… 20
Independent Variables in the Lifespace Model ……….. 20
Work-Self Competence ………. 21
Supervisor Attitudes ……… 21
Criterion Variables Relevant to Both Models ………. 21
Perceived Attitudinal Barriers at Work ……… 21
Disclosure of Disability ……….. 22
Expected Work Outcomes ……… 22
Demographic Variables ………. 22
Disability Type ……… 22
Other Demographics ………. 22
IV. RESULTS: MEASUREMENT MODEL ANALYSES ... 25
Analytic Strategy ……….. 26
The Self-Judgment Model: Testing Hypothesis 1 ... 26
Step 1: Bifactor Confirmatory Factor Analysis ……… 26
Step 2: Exploratory Factor Analysis ………. 26
Step 3: Simple Structure CFA ……… 28
Step 4: Replication on the Even Sample ………. 30
The Lifespace Model: Testing Hypothesis 2 ……… 30
Step 1: Bifactor CFA on Lifespace Items ………. 30
Step 2: EFA on Lifespace Items ……… 30
Step 3: Simple Structure CFA on Lifespace Items ………. 31
Step 4: Replication of Lifespace Model on Even Sample ………. 33
Construction of New Self-Judgment and Lifespace Scales .………. 33
Assertive Engagement ……… 34
Constructive Engagement ……….. 34
Relation Between the Two Models: Testing Hypothesis 3 ……… 34
V. RESULTS: DISCLOSURE OF DISABLITY, ATTITUDINAL BARRIERS, AND EXPECTED WORK OUTCOMES ... 36
Data Screening ………. 36
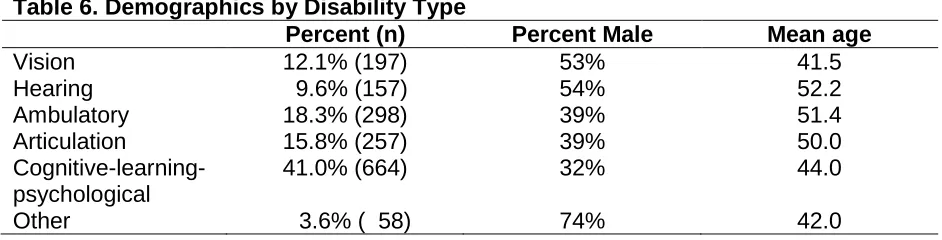
Demographic Control Variables ... 36
Analytic Strategy ……….. 37
Disability Disclosure: Testing Hypothesis 4 ……… 37
Descriptive Statistics ……….. 37
Regression Analyses ………. 38
Attitudinal Barriers at Work: Testing Hypothesis 5 ………. 39
Descriptive Statistics ……….. 39
Regression Analyses ……….. 41
Facing Attitudinal Barriers ………..…………... 41
Proportion of Barriers Attributed to Disability ………. 42
Expected Work Outcomes: Testing Hypothesis 6 ……….. 43
Descriptive Statistics ………... 43
Regression Analyses ………... 43
Interaction of Self-Judgment and Lifespace Scales with Attitudinal Barriers On Expected Work Outcomes ……….…… 44
Job Satisfaction ………. 45
Perceived Opportunities for Promotion …..……… 45
VI. STUDY 2: THE INFLUENCE OF PERSONAL INTELLIGENCE ON PERCEIVED POTENTIAL AT WORK AND EXPECTED WORK OUTCOMES (USING THE ARCHIVAL DATA FROM STUDY 1) ………..……….... 48
Research Questions ………. 49
Participants ……… 49
Measures ……… 50
Personal Intelligence ……… 50
Results ……… 50
RQ1: Personal Intelligence and Disability Type ……….. 50
RQ2: Personal Intelligence and Perceived Potential at Work ..……… 51
RQ4: Personal Intelligence, Attitudinal Barriers, and Expected Work
Outcomes ………..………. 52
Main Effects of Personal Intelligence on Expected Work Outcomes ………. 52
Interaction Effects of Personal Intelligence on the Association of Attitudinal Barriers and Expected Work Outcomes ……… 54
VII. GENERAL DISCUSSION ……… 55
Measuring Employee Perceptions ……… 55
Self-Judgment Scales ………. 55
Lifespace Scales ……….. 56
Understanding and Improving Workplace Experiences of Employees with Disabilities ………. 58
Disclosure of Disability ……… 58
Attitudinal Barriers ………... 59
Limitations ……… 60
Conclusion ………... 61
LIST OF REFERENCES... 63
APPENDICES ... 70
APPENDIX A: UNH INSTITUTIONAL REVIEW BOARD APPROVAL... 70
APPENDIX B: NATIONAL DISABILITY AND EMPLOYMENT SURVEY ………..…. 72
LIST OF TABLES
Table 1. Summary Statistics of the Original Scales (Full Sample) ………... 25
Table 2. Testing Models of the Self-Judgment Items: Iterations & Conclusion …... 27
Table 3. Testing Models of the Lifespace Items: Iterations & Conclusion ………….. 31
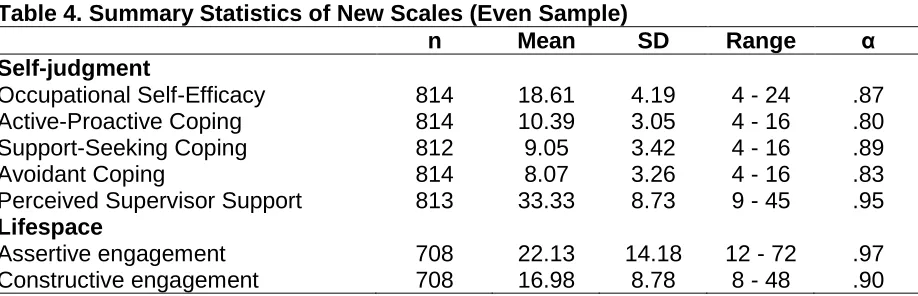
Table 4. Summary Statistics of New Scales (Even Sample) ……….…………. 33
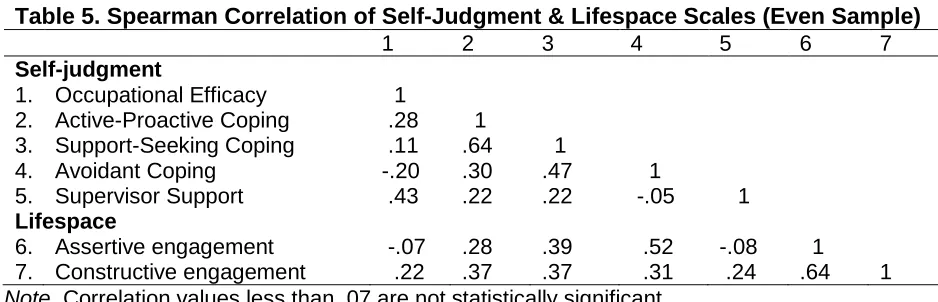
Table 5. Spearman Correlation of Self-Judgment & Lifespace Scales (Even Sample) 35
Table 6. Demographics by Disability Type ... 36
Table 7. Spearman Correlation of Disability Disclosure with Expected Work
Outcomes …….……….. 38
Table 8. Logistic Regression of Self-Judgment & Lifespace Scales on Disclosure of
Disability ……….. 38
Table 9. Attitudinal Barriers Faced at Work ………...……… 40
Table 10. Spearman Correlation of Barriers at Work with Self-Judgment & Lifespace
Scales ……….. 41
Table 11. OLS Regression of Self-Judgment & Lifespace Scales on Attitudinal Barriers
at Work ………. 42
Table 12. Spearmen Correlation of Expected Work Outcomes with Attitudinal
Barriers ……….………… 43
Table 13. OLS Regression of Self-Judgment & Lifespace Scales on Disability-related
Attitudinal Barriers and Expected Work Outcomes .……….……… 44
Table 14. OLS Regression of Self-Judgment & Lifespace Scales on Attitudinal Barriers
and Expected Work Outcomes ……….………...………… 46
Table 16. Spearman Correlation of Personal Intelligence with Self-Judgment & Lifespace
Scales ……….…… 51
Table 17. Logistic Regression of Personal Intelligence, Self-Judgment & Lifespace Scales
on Disclosure of Disability ……… 52
Table 18. OLS Regression of Personal Intelligence, Self-Judgment & Lifespace Scales
with Attitudinal Barriers on Expected Work Outcomes ……… 53
LIST OF FIGURES
Figure 1. Conceptual Model of Perceived Potential at Work among Employees with
Disabilities ………..…... 13
Figure 2. Self-Judgment Model of Perceived Potential at Work Using a Bifactor
Approach ………... 23
Figure 3. Lifespace Model of Perceived Potential at Work Using a Bifactor Approach 24
Figure 4. Final Self-Judgment Model: Simple Structure with Five Factors ………….. 29
Figure 5. Final Lifespace Model: Simple Structure with Two Factors ………... 32
Figure 6. Example Interactions of Self-Judgment & Lifespace Scales with Attitudinal
ABSTRACT
NAVIGATING BARRIERS AT WORK: EXPLORING THE PERCEPTIONS OF
EMPLOYEES WITH DISABILITIES
by
Kimberly G. Phillips
University of New Hampshire, September, 2016
To maintain successful employment, people with disabilities must often navigate
attitudinal barriers that result in bias, conflict, and discriminatory treatment on the part of
their supervisors and coworkers. Two studies were designed to investigate the idea that
employees’ perceptions of and response to these types of barriers depend, in part, on their
beliefs about their own self-competence, ability to cope with problems, and estimations of
their relationships with others, particularly supervisors, in the workplace. Two models were
developed and tested to assess how employees’ perceived potential at work, as measured
by both self-judgment and lifespace data, as well as an ability-based measure of personal
intelligence, related to their experience of attitudinal barriers. Survey respondents were
1,631 adults aged 18 to 64 who were currently or recently employed and who experienced
one or more disabilities or disabling health conditions. Results showed that occupational
self-efficacy, coping style, personal intelligence, and perceptions of person-focused and
task-focused supervisor support were all useful in understanding employees’ with
disabilities perceived potential at work and its associations with attitudinal barriers,
decisions whether or not to disclose disability at work, and subjective work success.
Conclusions address issues related to measurement and application to workplace policy
CHAPTER I
Introduction to the Studies
Despite experiencing barriers and obstacles to employment, people with disabilities
are striving to work (Kessler Foundation, 2015). Recent gains in the employment rate and
labor force participation of people with disabilities suggest that barriers to working are not
always insurmountable (National Trends in Disability Employment, 2016). Continued
research on the types of barriers that people with disabilities face, as well as the facilitators
that help overcome barriers, is needed to ensure people with disabilities can fully participate
in the workforce.
Navigating Barriers at Work
Research has documented many types of barriers to employment that people with
disabilities face and often strive to overcome. Systems-level barriers include those related
to legal, economic, or structural concerns. For example, people with disabilities may find it
difficult to work if earning a wage means they could lose much-needed federal assistance
(Kessler Foundation, 2015; Bureau of Labor Statistics, 2013). Or, as an example of a
structural concern, an individual who uses a wheelchair could more easily obtain a desired
position at the local town hall if the building had an accessible entrance and a working
elevator. However, if the town lacked the infrastructure (e.g., no sidewalks and no bus
system), the person could not make it to the job without an independent means of
transportation. Person-level barriers, on the other hand, arise as the individual perceives,
acts, and interacts in the social environment of the workplace, and they may be either
personal or interpersonal in nature.
Personal barriers. Personal barriers refer to an individual’s own functional
tendencies and abilities, personal barriers include challenges, such as the experience of
chronic pain or high anxiety, which an individual must manage in order to maintain
employment. Facilitators to overcoming these types of barriers can also be physical (e.g.,
fitness, health) or psychological (e.g., conscientiousness, emotional intelligence).
Interpersonal barriers. Interpersonal barriers occur when employees face stigma,
stereotypes, bullying, or discrimination as a result of their interactions with others, including
supervisors, coworkers, and customer, in the workplace. These are among the most
commonly reported obstacles encountered by employees with disabilities at work. The
existence of workplace discrimination against people with different types of disabilities has
been well-documented in the research literature (Chan, 2005; Johnson, 2015; Kruse &
Schur, 2003; Schur, Kruse, Blasi, & Blanck, 2009; Snyder, et al., 2010; Stone & Colella,
1996), and as many as one-third of employees perceive negative supervisor attitudes as a
barrier to employment (Bruyere, Erickson, & Ferrentino, 2002-2003; Bureau of Labor
Statistics, 2013; Erickson, von Schrader, Bruyere, VanLooy, 2014; Fassinger, 2008; Kessler
Foundation, 2015; Stone & Colella, 1996). This finding is significant because employees
(and consequently, employers) enjoy favorable outcomes, including increased job
satisfaction and productivity, decreased turnover intention, and greater affective
commitment to the organization when they believe their workplaces are fair, supportive and
care about them (Eisenberger & Rhoades, 2002; Ng & Sorensen, 2008). Among people
with disabilities, additional benefits to employment include improved efficacy to manage
difficulties in other areas of their lives (Soeker, 2011), increased community participation
and the avoidance of social isolation (Vornholt, Uitdewilligen, & Nijhuis, 2013).
Individual Differences in the Successful Navigation of Attitudinal Barriers
Imagine visiting with a friend who remarks that a manager he works with has a
may respond to this news with sympathy if you suppose it makes your friend sad, or
concern if you think his job might be in jeopardy, or anger if you imagine he is being
mistreated. While your friend's comment conveys important information (i.e., that
something at work is not good), it also leaves quite a bit unsaid. Perhaps you could draw
more informed conclusions or offer more meaningful advice if you knew the kinds of
treatment or behaviors he was facing.
As you frame your response, you will likely also take into account what you know
about your friend’s personality. If your friend tends to see the problematic side of things or
often attributes negative motivations to others, you may wonder whether she is interpreting
things less favorably than is warranted. Many psychological studies on mood-congruent
judgment, for example, indicate that people with neurotic styles and negative moods
perceive interpersonal relationships more adversely than others (Forgas & Bower, 1987).
Or, your friend may be caught in a vicious cycle, in which her tendency to see the down side
of things makes others start to avoid or even mistreat her.
Identifying personal and interpersonal factors related to the perception of attitudinal
barriers can help to ensure equal and just employment opportunities for people with
disabilities (Kruse & Schur, 2003) and facilitate their chances to avoid or overcome
interpersonal obstacles at work. For instance, what makes one employee with a disability
more or less likely than another, in the same situation, to perceive a barrier? Further, what
makes one employee more likely to believe that she can successfully address and even
overcome such interpersonal barriers at work? The present research seeks to answer
these questions.
Purpose of the Present Studies
The goal of the two studies described in these chapters is to identify personal and
to employment for individuals with disabilities. To this end, the first aim of the studies is to
identify personality characteristics of employees that influence the way they view and
interpret their competencies, actions, and interactions in the workplace. The second aim is
to concretize the broad range of thoughts and behaviors that employees with disabilities
could mean when they refer to negative attitudes on the part of their supervisors. The third
aim is to understand how certain personality characteristics relate to employees’ decision to
disclose their disabilities to others in the workplace. Finally, the fourth aim is to investigate
the impact of perceived attitudinal barriers on employee’s expected work outcomes. To
achieve these aims, two measurement models will be developed, tested, and compared in
order to answer the questions what is being perceived, and who is perceiving it.
Subsequent chapters describe two studies of employees’ with disabilities perceived
potential at work. Chapter II briefly reviews the research literature that informed the present
studies, especially focusing on the personality qualities and beliefs of employees. Chapter
III describes an empirical study in this realm. Research subjects include people with
disabilities who responded to a survey that included measures related to their personal
beliefs and experiences at work. Models were tested to fit the survey instrument and its
facets. Chapters IV and V present results of the survey data analyses, and Chapter VI
describes a second study, using the same data, to assess whether personal intelligence
globally influences the relation of certain personality characteristics to expected work
outcomes or the decision whether or not to disclose disability to a supervisor. Chapter VII
CHAPTER II
Employees’ with Disabilities Perceived Potential at Work
Individual differences among employees abound in any workplace. Some people
work harder than others, some collaborate more willingly, some complain more vehemently.
Each employee’s unique set of expectations, beliefs, strengths, and limitations both shape
and are shaped by their personal experiences, as well as their interactions with others
(Freitas & Downey, 1998; Shoda, LeeTiernan, & Mischel, 2002). Such individual
differences contribute to the varying ways that employees respond to challenges and
opportunities, the goals they set, and the particular filters through which they view and
evaluate themselves and one another (Mischel, 2004; Mischel & Shoda, 1995).
Social cognitive theories of personality concern this interaction between individuals’
self-understanding and need for self-direction, on the one hand, and the social environment
in which people function and from which they constantly learn, on the other (Bandura, 1986;
Lent, Brown, & Hackett, 2002; Mischel & Shoda, 1995). In this view, individuals develop a
sense of their own competencies, which in turn inform their expectations about their present
and future circumstances and abilities (Pervin, Cervone & John, 2005). According to
Mischel and Shoda (1995), individuals’ beliefs and experiences contribute to self-concepts
that differ according to the situation or setting in which they find themselves but also are
somewhat stable across similar types of situations or circumstances. Here, the focus of the
self-concepts will refer specifically to the self-at-work, or the “work-self.”
Perception of Work-Self Competence
Social cognitive career theory posits that “people help construct their own career
outcomes; that their beliefs (for example, about themselves, their environments, and
possible career paths) play key roles in this process; that we are not merely beneficiaries
effectiveness and competence in a setting, a stable self-in-situation concept emerges
(Mischel & Shoda, 1995). As such, social learning opportunities presented via the social
environment and one’s own personal background and experience translate into a greater or
lesser degree of self-efficacy (Betz, 2007; Lent, Brown, & Hackett, 2002).
Self-efficacy can be defined as a person’s belief in his capability to succeed at a
given undertaking (Bandura, 2006; Judge & Bono, 2001). According to Bandura (1995,
1997, as cited in Bandura, 2006):
“Perceived efficacy plays a key role in human functioning because it affects behavior
not only directly, but by its impact on other determinants such as goals and
aspirations, outcome expectations, affective proclivities, and perception of
impediments and opportunities in the social environment” (p. 309).
For example, if I see myself as a very competent student, I may be calm and self-assured in
any academic setting, whether presenting in class, taking an exam, or discussing a
homework assignment. My self-assuredness also influences my expectations about my
general ability to succeed in the class and the final grade I will earn.
Although widely applicable to research on personality and individual differences
across a variety of domains, self-efficacy is most usefully examined when applied to a
specific context rather than being assessed in a global manner (Bandura, 2006; Lent &
Brown, 2006). The present study’s purpose is to understand employees’ perception of
interpersonal barriers in the workplace, so occupational self-efficacy will be used.
Occupational self-efficacy. Occupational self-efficacy concerns individuals’ views
of their competence to successfully perform their jobs (Rigotti, Schyns, & Mohr, 2008). It
affects employees’ willingness to engage in certain tasks as well as their persistence when
faced with challenges (Fassinger, 2008). It also has been shown to relate to both job
colleagues (2007) found that self-efficacy’s relation to job performance persists with
moderate effect sizes even when controlling for other personality traits. Further, efficacy
can ameliorate the effects of stressors both in and out of the workplace (Grau, Salanova, &
Peiro, 2002; Soeker, 2011). Fassinger (2008) pointed to the construct as particularly useful
to the work domain and highlighted its conceptual utility for studying effects related to
diversity, or in this case, disability. Similarly, Bandura (2009) noted that “unless people
believe that they can produce desired effects and forestall undesired ones by their actions,
they have little incentive to act or to persevere in the face of difficulties” (p. 179).
In addition to being a critical component of work-self conceptualization, self-efficacy
improves coping ability, which psychologists have identified as important to understanding
employees’ workplace perceptions and expectancies (Jex, Bliese, Buzzell, & Primeau,
2001; Judge & Bono, 2001; Stanojevic, Krstic, Jaredic, & Dimitrijevic, 2014). In fact, Jex
and colleagues (2001) suggest that “what is needed to more accurately model the impact of
self-efficacy on stressor-strain relations is to account for employees’ use of different coping
styles” (p. 402).
Coping style. Coping is defined as “efforts to prevent or diminish threat, harm, and
loss, or to reduce associated distress” (Carver & Connor-Smith, 2010). Individuals cope
with challenges, obstacles, and difficulties, in part, according to their beliefs about
themselves and their capacity to manage or respond effectively to situations and people
(Stanojevic, Krstic, Jaredic, & Dimitrijevic, 2014). For example, people whose core
self-evaluations are positive (Kammeyer-Mueller, Judge, & Scott, 2009) and who are generally
optimistic (Carver & Connor-Smith, 2010) tend to view difficult situations as challenges
rather than threats (Greenglass, Schwarzer, Jakubiec, Fiksenbaum, & Taubert, 1999;
Searle & Lee, 2015). Such individuals engage actively, seeking solutions to problems and
Primeau, 2001). They are “more likely to take the initiative to select, create, and influence
work situations and environments that are more likely to provide opportunities…” (Seibert et
al., 1999, as cited in Ng, Eby, Sorensen, & Feldman, 2005, p. 374). On the other hand,
more disengaged, defensive, or avoidant coping styles are associated with poorer
outcomes and greater strain in the long run (Kammeyer-Mueller, Judge, & Scott, 2009;
McGonagle & Hamblin, 2014) because nothing has been done to remove or alter the barrier
or stressor that is being perceived (Carver & Connor-Smith, 2010). For examples of the
numerous coping styles individuals employ, most of us need only to look to our own
colleagues or acquaintances.
To illustrate, imagine an organization at which a much-anticipated new project is
about to be launched. The four employees assigned to lead it, Kim, Jim, Tim, and Susan,
are very excited to begin. Their boss calls them all to a meeting and announces that she
has decided to replace them with a new team that had more experience in leading projects
such as this. The four of them will instead remain on their current projects. The boss
explains how this will be best for the organization and tries to convince the team members
that it is in their best interest, as well. The meeting adjourns, and the employees each
respond to the news in their own way. Susan stays behind in the boss’s office and, with a
raised voice, expresses her anger and outrage at the unfairness of the decision. Tim
confides his disappointment to his family and allows them to cheer him up over dinner, while
Jim requests a transfer to another department. Finally, Kim schedules a follow-up meeting
with her boss, for which she will prepare a brief PowerPoint presentation highlighting her
recent accomplishments in order to persuade the boss to reconsider and assign her to the
new project.
Each of these responses illustrates a particular coping style. Susan’s choice is
disengages (Carver, 1997). Moreover, each of these responses is likely to produce
different results. For example, some coping styles help individuals act in such a way as to
avoid barriers that they would otherwise have encountered (Greenglass & Fiskenbaum,
2009; Jex, Bliese, Buzzell, & Primeau, 2001; Stanojevic, Krstic, Jaredic, & Dimitrijevic,
2014).
These “proactive” copers, in particular, tend to view difficult situations as challenges
rather than threats (Greenglass, Schwarzer, Jakubiec, Fiksenbaum, & Taubert, 1999;
Searle & Lee, 2015) and orient toward them more positively than do those whose coping
mechanisms may be characterized as more passive or defensive (McGonagle & Hamblin,
2014). Moreover, active and proactive employees are “more likely to take the initiative to
select, create, and influence work situations and environment that are more likely to provide
opportunities…” (Seibert et al., 1999, as cited in Ng, Eby, Sorensen, & Feldman, 2005, p.
374). Perhaps most important to the current investigations, perceived workplace barriers
may not be as detrimental to individuals who possess strong coping efficacy (Luzzo &
McWhirter, 2001).
In sum, self-efficacy and coping refer to two inner strengths an employee may bring
to the workplace. Employees also perceive relational strengths (and weaknesses) at work.
Returning to an example used previously, while a student with high academic self-efficacy
enjoys a sense of competency in the classroom, it is important to note that the student’s
view of the professor also affects her perceived potential to succeed in the class and the
final grade she expects. If she sees her professor as fair, amicable toward her, and clearly
able to explain class goals and content, she might expect a better outcome than if the
professor seemed to take pleasure in seeing her fail or regularly provided her with
unfavorable feedback about her performance. The same concept applies to employees in
perceptions of themselves and their perceptions of others. Here, the “others” of interest are
the employees’ supervisors.
Perception of Supervisor Support
An employee is not alone in the workplace but rather has relationships with other
people, and a supervisor is key among them. Employees may perceive their supervisors as
helpful or detrimental to their progress. When an employee with a disability encounters a
negative “attitude” on the part of a supervisor, that employee is perceiving, by definition, a
“psychological tendency [of the supervisor] that is expressed by evaluating a particular
entity [the employee] with some degree of favor or disfavor” (Eagly & Chaiken, 2007). Such
an attitude can be conveyed by the supervisor directly through verbal or nonverbal means,
or it could be inferred by the employee through more indirect means: perceived thoughts,
overheard words, or deeds on the part of the other individual. In other words, a supervisor’s
negative attitude could be construed by the employee as either conveying something
undesirable, such as discriminatory treatment, or failing to convey something desirable,
such as support.
Supervisor support, or “personal support,” is one of three domains of organizational
citizenship behavior (Borman, Penner, Allen, & Motowidlo, 2001), which was defined by
Organ (1988) as pertaining to discretionary workplace behaviors not included in formal
rewards systems and not enforceable as part of in-job requirements (as cited in Podsakoff,
MacKenzie, Paine, & Bachrach, 2000). Its subdimensions include helping and cooperating
with others, showing courtesy, consideration and tact in dealing with others, and motivating
others by encouraging them and assisting them to overcome obstacles in order to succeed
(Borman, Penner, Allen, & Motowidlo, 2001, p. 55). Many organizational citizenship
behaviors occur “within the confines of interpersonal relationships…[and] involve
interest to the present studies are these specifically interpersonal citizenship behaviors,
which can be person-focused or focused. Here, the person-focused and the
task-focused domains of interpersonal citizenship behaviors will be used to gauge employee
perceptions of supervisor support and, at the other end of the spectrum, mistreatment.
Person-focused support. Expressions of empathy, trust, and support of a personal
nature are examples of person-focused citizenship behaviors (Settoon & Mossholder,
2002). Employees perceiving this type of support take the general view that their
supervisors care about them as individuals (Eisenberger, Stinglhamber, Vandenberghe,
Sucharski, & Rhoades, 2002; Kottke & Sharafinski, 1988, as cited in Maertz, Griffeth,
Campbell, & Allen, 2007). Such perceptions have been shown to positively influence
organizational commitment, job satisfaction, job tenure, and to decrease turnover intention
among employees with and without disabilities (Rhoades & Eisenberger, 2002; Maertz,
Griffeth, Campbell, & Allen, 2007; Ng & Sorensen, 2008; Vornholt, Uitdewilligen, & Nijhuis,
2013).
Person-focused mistreatment occurs when supervisors direct hostile acts and
judgments against the personal attributes of an employee. Examples include jokes at the
employee’s expense, incivility, or avoidance (Van Laer & Janssens, 2011). Stone and
Colella (1996, p. 355) suggest that stereotypes form the basis for unfavorable supervisor
and coworker expectancies about employees with disabilities, including that they are unable
to do the work, disruptive, or threatening. These expectancies, in turn, can engender
negative affective reactions such as revulsion, discomfort, and resentment toward
employees with disabilities (Stone & Colella, 1996).
Task-focused support. Task-focused supervisor support centers on job-related
assistance, problem-solving, and work-role exchanges: things that make the work easier.
of the job, training, and sharing needed information (Borman, Penner, Allen, & Motowidlo,
2001), as well as providing flexible schedules and other modifications or accommodations
(Erickson, von Schrader, Bruyere, & VanLooy, 2013; Kaye, Jans, & Jones, 2011).
Employees perceiving this type of support take the general view that their supervisors value
their contributions to the workplace (Eisenberger, Stinglhamber, Vandenberghe, Sucharski,
& Rhoades, 2002; Kottke & Sharafinski, 1988, as cited in Maertz, Griffeth, Campbell, &
Allen, 2007), and as a result, they are more likely to continue their employment (Hill,
Maestas, & Mullen, 2015).
Task-focused mistreatment of employees with disabilities may be either subtle or
overt (Jones, Peddle, Gilrane, King, & Gray, 2013; Snyder, Carmichael, Blackwell,
Cleveland, & Thornton, 2010). While overt forms of discrimination are typically recognizable
as inappropriate and sometimes in violation of the law (e.g., ADA, 1990), subtler
discrimination may appear on the surface (albeit falsely) as less detrimental (Snyder, et al.,
2010). Researchers have documented many examples of unjust task-focused practices
leveled at employees with disabilities, including undue or disproportionate scrutiny of their
performance, being passed over for promotion, and having desirable or satisfying tasks
withheld or reassigned (McGonagle & Hamblin, 2014). Clearly, such experiences are likely
to impact employees’ anticipated job performance and work outcomes.
Conceptual Model of Perceived Potential at Work
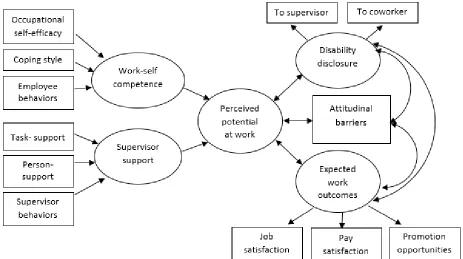
Figure 1 shows this study’s conceptual model. Starting at the left, occupational
self-efficacy, coping style and employee behaviors in the workplace comprise employees’
perceived work-self competence. Perceived person-focused supervisor support, perceived
task-focused support, and supervisor behaviors in the workplace comprise employees’
perceptions of overall supervisor support. Work-self competence and perceived supervisor
individuals’ estimations of their potential to perform and be successful at their jobs. On the
right side of Figure 1, perceived potential at work is posited to relate to employees’ decision
to disclose disability to supervisors and coworkers, the experience of attitudinal barriers,
and expected work outcomes, operationalized as satisfaction with the job in general,
satisfaction with pay, and perceived opportunities for promotion.
Figure 1. Conceptual Model of Perceived Potential at Work among Employees with Disabilities
Examination of the conceptual model using self-judgments. The conceptual
model depicted in Figure 1 will be tested by drawing on small groups of survey items
available in or modified from existing self-judgement scales that have demonstrated
reliability and validity in measuring their intended outcomes. New items are generated for
this study, as well. Self-judgement styles of data collection are commonly used in the social
include uncertainty over construct validity and the possibility that respondents lack accurate
self-knowledge or are susceptible to self-deception or fictionalization (Chan, 2009; Farmer,
2007).
Examination of the conceptual model using lifespace data. Biographical or
lifespace data is a form of self-report that asks people to describe discrete, observable
historical and present-day aspects of their behaviors and events in their lives (Brackett,
Mayer, & Warner, 2004; Breaugh, 2009; Mayer, 2016). Researchers regard it as a distinct
form of data because the questions are externally observable, and (in theory) verifiable
(Mayer, 2004; 2016). It may work, in part, because past behavior may be the best predictor
of future behavior (Mael, 1991; Owens & Schoenfeldt, 1979, as cited in Allworth & Hesketh,
1999). Even when lifespace data concerns contemporary reports, the form of the items
differs from self-judgment items, in that they are identifiable and discrete (Brackett, Mayer,
& Warner, 2004). Generation of lifespace items can be achieved in several ways (for a
discussion, see Breaugh, 2009). Here, item development was informed by recent
qualitative research findings, and input from an expert panel of psychologists and disability
researchers was used to construct rational scales (Allworth & Hesketh, 1999; Kessler
Foundation, 2015).
The lifespace items will be divided into self- and supervisor-oriented: Two groups of
items rather than four will be modeled because life space items tend to be less reliable and
involve multiple sources of variance relative to simpler self-judgment items. At the same
time they may possess greater validity (see Breaugh, 2009; Mael, 1991; Mayer, 2004; 2016;
Mayer, Carlsmith & Chabot, 1998).
Disclosure of Disability
The decision whether or not to disclose a disability at work, in the event that it is not
barriers and other obstacles in this setting (Hill, Maestas, & Mullen, 2015; Kessler
Foundation, 2015). Concealing or downplaying behaviors may appeal to some individuals,
especially those who have experienced past discrimination (Lyons, et al., 2016; McGonagle
& Hamblin, 2014), as a proactive way of avoiding negative attitudes, unfair treatment, or
supervisor and coworker assumptions (Madera, King, & Hebl, 2012; Schur, Kruse, &
Blanck, 2005, von Schrader, Malzer, & Bruyere, 2014). The choice whether to conceal or
claim disability has implications for employee work outcomes, including job satisfaction and
turnover intentions, such that suppressing a disability identity is positively associated with
perceived discrimination and negatively associated with job satisfaction (Madera, King, &
Hebl, 2012). At the same time, advocates for equal opportunity suggest that disclosure of
disability should be encouraged among employees given the fact that it can lead to greater
access to helpful accommodations and enhanced opportunities for supervisor and coworker
support (von Schrader, Malzer, & Bruyere, 2014). What is currently missing from the
conversation, and what this study adds to existing knowledge, is an understanding of the
individual differences that influence successful disclosure of disability among employees at
work.
Expected Work Outcomes
This study proposes that employees’ perceptions of their work-self competencies
and their supervisors’ support or mistreatment ultimately influence their expected work
outcomes. While work outcomes may refer to either objective or subjective estimations,
here employees’ subjective appraisals will be assessed. Prior research has shown that
subjective perceptions of work success, such as job or career satisfaction, are only
moderately correlated with more objective measures like actual salary or number of
promotions (Ng, Eby, Sorensen, & Feldman, 2005). Also, individual differences of the kind
sociodemographic factors such as age and education that are more associated with
objective employment outcomes (Ng, Eby, Sorensen, & Feldman, 2005). The three
subjective work outcomes that will be considered in the present study are job satisfaction,
satisfaction with pay, and perceived promotion opportunities.
The Present Studies’ Contribution to the Literature
The studies described here add to existing knowledge in several ways. First, they
reveal individual differences that help or hinder people with disabilities as they strive to
overcome personal and interpersonal barriers in the workplace. Second, they clarify the
types of behaviors and expectancies people with disabilities have in mind when they report
certain interpersonal barriers at work. Third, in addition to better understanding obstacles
that must be overcome and the best ways employees with disabilities can surmount them,
they identify personal and interpersonal factors most associated with successful
CHAPTER III
Study 1: Development and Testing of Two Measurement Models of Perceived
Potential at Work among Employees with Disabilities
The purpose of this study is to understand individual differences in the perception of
interpersonal barriers to employment among employees with disabilities. A model of four
distinct but related qualities was proposed to explain employees’ perceived potential at work
(see Figure 1). In the model, perceived potential is made up of employee perceptions of (a)
their occupational self-efficacy and (b) coping style, as well as both (c) person-focused and
(d) task-focused supervisor support. Confirmatory factor analysis will be used to separately
model the two measurement approaches utilized here: the self-judgment scales and the
self-reported lifespace information. The study hypotheses are presented next.
Hypotheses
Hypothesis 1 proposes a that a model of four factors (occupational self-efficacy,
coping style, perceived person-focused supervisor support, and perceived task-focused
supervisor support) will be useful in representing employees’ perceived potential at work.
Hypothesis 2 posits that a second, lifespace data model can be represented in two
factors related to employees’ perceived work-self competency and supervisor support. The
second model is still more exploratory than the first, owing to the complexities of working
with lifespace data, but various factor representations will be tested.
Subjective experience bears some resemblance to specific, cued recall of work
events as represented in lifespace data (Farmer, 2007). For that reason, Hypothesis 3
suggests that the two models will relate to one another.
Three additional hypotheses are proposed. Hypothesis 4 posits that perceived
potential at work, as measured by the two models, will be associated with the decision to
the employees’ disability is evident without needing to be disclosed, perceived potential at
work will relate to employees’ comfort discussing their disability with supervisors and/or
colleagues. Hypothesis 5 suggests that perceived potential at work will also be associated
with employees’ experience of attitudinal barriers at work and (Hypothesis 6) will influence
the relation between attitudinal barriers and expected work outcomes, operationalized as
job satisfaction, satisfaction with pay, and perceived promotion opportunities.
Methods
Participants. Participants were members of a voluntary panel maintained by
Qualtrics online survey software and its partner organizations. The sample was purchased
with grant funds from the National Institutes of Disability, Independent Living, and
Rehabilitation Research. Respondents were recruited by Qualtrics and its partner
organizations using a variety of methods, including web intercept, targeted email lists, panel
member referral, and social media. Incentives for respondents included cash payments,
free downloads, and/or membership points; all incentives were decided and allocated by
Qualtrics and its partners. Informed consent to participate was obtained in accordance with
requirements of the University of New Hampshire Institutional Review Board, and
respondents were verified by Qualtrics through a double opt-in process.
Inclusion criteria for survey respondents was adults between the ages of 18 and 64
with one or more disabilities or chronic health conditions. Electronic consent to participate,
in accordance with protocols of the University of New Hampshire Institutional Review Board,
was granted by 11,045 individuals. Of those, 4,259 were precluded from taking the survey
because they indicated no disability or health condition, and 3,181 were not admitted to the
survey for being over age 64. Another 583 were dropped for inattentive responding, which
means that respondents incorrectly answered at least one Likert-type item designed to
the survey was 13 minutes. As there were several different tracks through the survey, and
some were very short, no participants were excluded based on time to complete the survey.
Instead, responses with very short duration times were reviewed individually to verify that
they belonged to the shortest survey track. This resulted in no further exclusions.
The analytic sample for this study comprised the subset of the remaining 3,022
participants who reported that they were (a) currently employed, or (b) previously employed
within the last two years but not currently working. This resulted in a total of 1,631
individuals. Of these, 1,418 were currently employed.
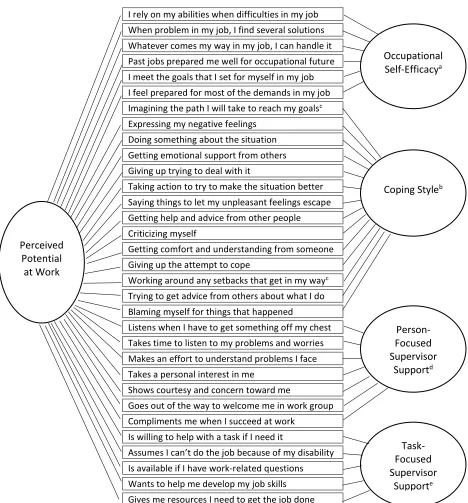
Measures. A copy of the survey instrument is provided in Appendix A. In addition,
all predictor items used in the self-judgement model are presented in Figure 2, and items
specific to the lifespace model are shown in Figure 3. These are described next, followed
by explanations of the outcome and demographic measures that are common to both
models. In some instances items were generated for this study instead of selecting
pre-existing scales because of the time limitation inherent in the survey. Means and standard
deviations for all measures, prior to being factor analyzed, are provided in Table 1.
Occupational self-efficacy. Occupational self-efficacy was measured with a
six-item scale (Rigotti, Schyns, & Mohr, 2008). Respondents were instructed to “indicate how
true or untrue it is of you” using a 6-point, Likert-type response key (not at all true to
completely true) for each of the items that appear in the top right box of Figure 3.
Coping style. Coping style was measured with 12 items from the Brief COPE
(Carver, 1997), including the following styles six of coping (two items each): (a) active, (b)
emotional support-seeking, (c) instrumental support-seeking, (d) venting, (e) behavioral
disengagement, and (f) self-blame. Two additional items were created and added to reflect
asked to indicate on a 4-point, Likert-type scale (not at all to a lot) how often they have been
using each of the listed strategies to cope with problems or difficulties at work.
Person-focused supervisor support. Six items from the person-focused
dimension of a scale of Interpersonal Citizenship Behaviors (Settoon & Mossholder, 2002)
were adapted for use in this study. Whereas the original scale measured supervisor
ratings of employees, the present research did the reverse and asked employees to rate
their current supervisors. The adaptation was achieved by substituting a personal pronoun
for the word “coworker” in each of the items. For example, an original item says, takes time
to listen to coworkers’ problems and worries; the new item says, takes time to listen to my
problems and worries. Respondents used a 5-point, Likert-type scale (strongly disagree to
strongly agree) to characterize their supervisors.
Task-focused supervisor support. A new six-item scale was written for this study
to measure task-focused supervisor support. While the distinction between person-focused
and task-focused came from Settoon and Mossholder (2002), the specific task-focused
items on their scale did not lend themselves to an adaptation of employee reports of
supervisor behaviors. As such, the new items were instead informed by descriptions of the
subdimensions of organizational citizenship behavior in the taxonomy presented by Borman
and colleagues (2001). For example, the description of the “helping” subdimension
includes, “Helping others by offering suggestions about their work” (Borman, Penner, Allen,
& Motowidlo, 2001, p. 55), which informed the following items: is available if I have a
work-related question or problem; is willing to help with a task if I need it. All items are shown in
Figure 2. Respondents used a 5-point, Likert-type scale (strongly disagree to strongly
agree) to characterize their supervisors.
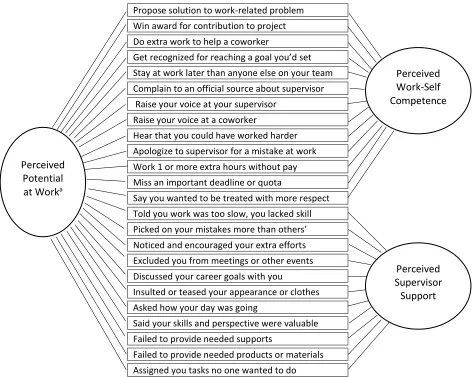
Independent variables in the lifespace model. Life space items representing the
supervisor attitudes (see Figure 3) were generated for this study using a rational-deductive
approach based on findings from the literature reviewed in Chapter II.
Work-self competence. Work-self competence was determined with 13 items
generated for this study and answered on a 7-point, Likert-type scale in which respondents
indicated “how often” or “how frequently” in the last 30 days they had done or experienced
specific work behaviors. Items were designed to reflect both organizational (e.g., proposing
solutions to work-related problems, working extra hours in a day) and interpersonal (e.g.,
raising voices in anger, asking to be treated with more respect) types of competencies.
Supervisor attitudes. Eleven lifespace items indexing supervisor attitudes were
created for this study. Research informing the composition of the items came from findings
related to person-focused and task-focused citizenship behaviors (Borman, Penner, Allen, &
Motowidlo, 2001; Settoon & Mossholder, 2002), perceived workplace discrimination
(McGonagle & Hamblin, 2014), and employment experiences of people with disabilities
(Kessler Foundation, 2015; Schur, Kruse, Blasi, & Blanck, 2009). Respondents were asked
to indicate on a 7-point, Likert-type scale “how often in the last 30 days…” supervisors had
done each of the eleven listed behaviors (e.g., exclude you from meetings, pick on your
mistakes, discuss your career goals). All items are shown in Figure 3.
Criterion variables relevant to both models.
Perceived attitudinal barriers at work. A checklist of seven items containing potential
problems employees might face at work because of their disability (Kessler Foundation,
2015) were included to measure perceptions of personal and interpersonal barriers. These
included “negative attitudes on the part of supervisor,” “receiving less pay than others in a
similar job as you,” and “supervisor assumes you can’t do the job because of your
disability.” Respondents were asked to check off items they had experienced and to
Disclosure of disability. Disability disclosure was assessed using a three-question
series. First, respondents were asked whether their disability was visible or apparent to
others. Those who answered “no” were then asked (yes or no) whether they had disclosed
their disability to their supervisor. Then, a four-point multiple choice item assessed whether
they had disclosed their disability to coworkers (no one to everyone). This procedure was
adapted from Ragins, Syngh, and Cornwell (2007), who used similar methods to study
disclosure of sexual orientation among employees at work. Finally, all employees whose
disability was known (whether or not by choice) indicated how comfortable they felt
discussing their disability at work, according to a 5-point Likert-type scale (not at all
comfortable to completely comfortable).
Expected work outcomes. Expected work outcomes were measured with three of
the five facets of the Job Descriptive Index: job satisfaction (Job in General), satisfaction
with pay (Pay), and Opportunities for Promotion (Lake, Gopalkrishnan, Sliter, & Withrow,
n.d.). Each scale contains a list of six to eight words or short phrases that respondents
answer with either “yes,” “no,” or “I don’t know.” Items are shown in Appendix A.
Demographic variables.
Disability type. Disability screeners, shown in Appendix A, were adopted from the
Kessler Foundation National Employment and Disability Survey (2015). The nine items
used were based on questions found on multipole national instruments such as the
American Community Survey, the Survey of Income & Program Participation, and the
Canadian Survey on Disability, plus four additional prompts (Kessler Foundation, 2015).
Other demographics. Respondents indicated their gender, age, race, ethnicity, level
a6 items from Riggoti, Schyns, & Mohr (2007); b12 items from Carver (1997), c2 items new for this study; d7 items adapted from Settoon & Mossholder (2002); e5 items new for this study
Note. All items may be paraphrased for brevity.
Figure 2. Self-Judgment Model of Perceived Potential at Work Using a Bifactor Approach
I rely on my abilities when difficulties in my job When problem in my job, I find several solutions Whatever comes my way in my job, I can handle it Past jobs prepared me well for occupational future I meet the goals that I set for myself in my job I feel prepared for most of the demands in my job Imagining the path I will take to reach my goalsc Expressing my negative feelings
Doing something about the situation Getting emotional support from others Giving up trying to deal with it
Taking action to try to make the situation better Saying things to let my unpleasant feelings escape Getting help and advice from other people Criticizing myself
Getting comfort and understanding from someone Giving up the attempt to cope
Working around any setbacks that get in my wayc Trying to get advice from others about what I do Blaming myself for things that happened
Listens when I have to get something off my chest Takes time to listen to my problems and worries Makes an effort to understand problems I face Takes a personal interest in me
Shows courtesy and concern toward me
Goes out of the way to welcome me in work group Compliments me when I succeed at work
Is willing to help with a task if I need it
Assumes I can’t do the job because of my disability Is available if I have work-related questions Wants to help me develop my job skills Gives me resources I need to get the job done
Perceived Potential at Work
Occupational
Self-Efficacya
Coping Styleb
aAll items new for this study
Note. Items may be paraphrased for brevity.
Figure 3. Lifespace Model of Perceived Potential at Work Using a Bifactor Approach Propose solution to work-related problem
Win award for contribution to project Do extra work to help a coworker
Get recognized for reaching a goal you’d set Stay at work later than anyone else on your team Complain to an official source about supervisor Raise your voice at your supervisor
Raise your voice at a coworker
Hear that you could have worked harder Apologize to supervisor for a mistake at work Work 1 or more extra hours without pay Miss an important deadline or quota
Say you wanted to be treated with more respect Told you work was too slow, you lacked skill Picked on your mistakes more than others’ Noticed and encouraged your extra efforts Excluded you from meetings or other events Discussed your career goals with you
Insulted or teased your appearance or clothes Asked how your day was going
Said your skills and perspective were valuable Failed to provide needed supports
Failed to provide needed products or materials Assigned you tasks no one wanted to do
Perceived Potential
at Worka
Perceived Work-Self Competence
Perceived Supervisor
CHAPTER IV
Results: Measurement Model Analyses
Data Screening
Data were reviewed by examining frequencies, histograms and box plots to detect
extreme outliers and violations of the assumption that variable distributions were normal.
Missing values within a response were coded as such and managed on an individual or
pairwise basis by MPlus 7.4 and Stata 12.1 during computation. Items from the
self-judgement variables did not exhibit extreme outliers or substantial violations of the
assumption of normalcy.
Frequencies and histograms of the lifespace data showed a pattern of positive skew,
and a few items of work-self competence and supervisor support (in the lifespace model)
also showed floor effects. Categorical factor analysis was used with the lifespace items in
order to better manage the skewness of the items. No outliers were removed from the
analyses. As with the self-judgment variables, missing values were excluded on an
individual or pairwise basis by the analytic software.
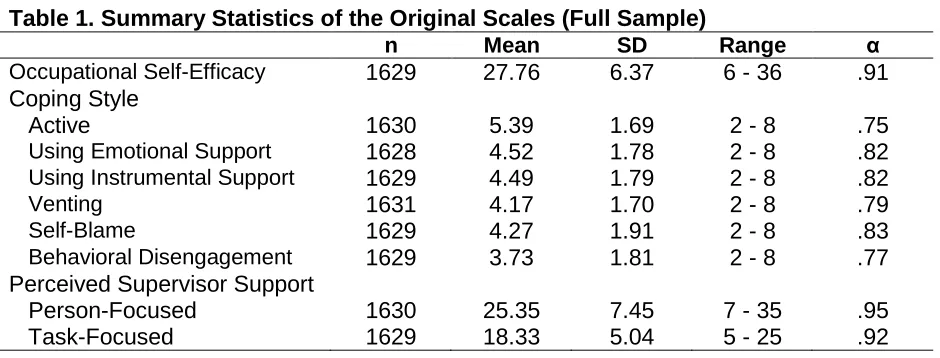
Table 1. Summary Statistics of the Original Scales (Full Sample)
n Mean SD Range α
Occupational Self-Efficacy 1629 27.76 6.37 6 - 36 .91
Coping Style
Active 1630 5.39 1.69 2 - 8 .75
Using Emotional Support 1628 4.52 1.78 2 - 8 .82
Using Instrumental Support 1629 4.49 1.79 2 - 8 .82
Venting 1631 4.17 1.70 2 - 8 .79
Self-Blame 1629 4.27 1.91 2 - 8 .83
Behavioral Disengagement 1629 3.73 1.81 2 - 8 .77
Perceived Supervisor Support
Person-Focused 1630 25.35 7.45 7 - 35 .95
Task-Focused 1629 18.33 5.04 5 - 25 .92
Table 1 shows the means, standard deviations, and reliabilities of the original scales.
confidence to the adequacy of the sample collected and the screening procedures. For
example, the reliability of the short version of Rigotti, Schyns, and Mohr’s (2008)
occupational self-efficacy scale was .85 to .90, while in the current sample it was .91.
Analytic Strategy
In order to first test and then confirm fit for the measurement models described in
Chapter III, the sample was divided in two by odd- and even-numbered participants. The
models were tested, revised, and modified as needed using the odd sample and verified
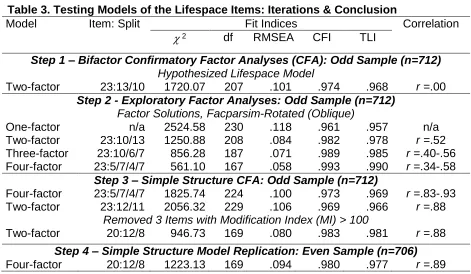
using the even. Table 2 summarizes analyses of the self-judgment model, and the
lifespace model analyses are presented in Table 3.
The Self-Judgment Model: Testing Hypothesis 1
Step 1: Bifactor confirmatory factor analysis. The study’s first hypothesis
suggested that occupational self-efficacy, coping style, person-focused and task-focused
supervisor support could be combined into an overall variable of perceived potential at
work. A bifactor confirmatory factor analysis (CFA) was used to test the fit (Table 2, Step
1). Fit indices for the hypothesized model ( 2
432 = 3756.68, p<.001; RMSEA =.097; CFI =
.822; TLI = .795) were somewhat below established targets. Statistically significant Chi
square tests ( 2), values below .08 for root mean square error of approximation (RMSEA),
and values near .95 for Comparative Fit Index (CFI) and Tucker-Lewis Index (TLI) are
considered statistical evidence of adequate fit (Widaman & Grimm, 2016). Exploratory
factor analysis (EFA) was undertaken to clarify the major dimensions of perceived potential
at work.
Step 2: Exploratory factor analysis. Exploratory factor analysis for one through
six factors was conducted with a maximum likelihood extraction for continuous data, geomin
Table 2, Step 2. The fit for one and two factors was poor, so discussion in the next
paragraphs focuses on possible solutions with three or more factors.
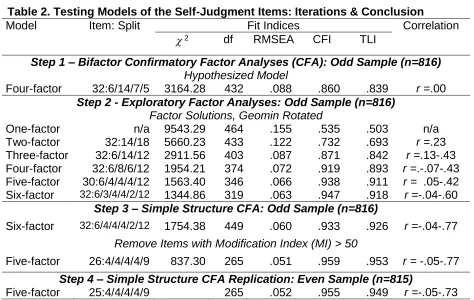
Table 2. Testing Models of the Self-Judgment Items: Iterations & Conclusion
Model Item: Split Fit Indices Correlation
2 df RMSEA CFI TLI
Step 1 – Bifactor Confirmatory Factor Analyses (CFA): Odd Sample (n=816) Hypothesized Model
Four-factor 32:6/14/7/5 3164.28 432 .088 .860 .839 r =.00
Step 2 - Exploratory Factor Analyses: Odd Sample (n=816) Factor Solutions, Geomin Rotated
One-factor n/a 9543.29 464 .155 .535 .503 n/a
Two-factor 32:14/18 5660.23 433 .122 .732 .693 r =.23
Three-factor 32:6/14/12 2911.56 403 .087 .871 .842 r =.13-.43
Four-factor 32:6/8/6/12 1954.21 374 .072 .919 .893 r =.-.07-.43
Five-factor 30:6/4/4/4/12 1563.40 346 .066 .938 .911 r = .05-.42
Six-factor 32:6/3/4/4/2/12 1344.86 319 .063 .947 .918 r =-.04-.60
Step 3 – Simple Structure CFA: Odd Sample (n=816)
Six-factor 32:6/4/4/4/2/12 1754.38 449 .060 .933 .926 r =-.04-.77
Remove Items with Modification Index (MI) > 50
Five-factor 26:4/4/4/4/9 837.30 265 .051 .959 .953 r = -.05-.77
Step 4 – Simple Structure CFA Replication: Even Sample (n=815)
Five-factor 25:4/4/4/4/9 265 .052 .955 .949 r =-.05-.73
All items related to supervisor support (both perceived person-focused and
task-focused) loaded strongly on a single factor; loadings ranged from .67 to .88, and items from
the occupational efficacy scale continued to load on their single factor. The coping items
began to split apart as the number of factors increased. This is not surprising, given that
the 14 coping items originated from 7 separate 2-item scales of different coping styles.
At four factors, the coping items loaded onto two separate dimensions, and at five
factors they loaded onto three. In the five-factor solution, two coping items, representing
self-blame, did not load significantly on any factors and were dropped. At six factors, all
six-factor solution (4 coping, 1 supervisor support and 1 self-efficacy) was next tested using
simple structure CFA with all 32 items.
Step 3: Simple structure CFA. Although all items loaded in the range of .83 to .88
on their respective factors, the revised six-factor simple structure model with all 32 items did
not meet the target values: 2
449 = 1754.38 (p<.001), RMSEA=.060, CFI=.933, TLI=.926
(Table 2, Step 3). Examination of the modification indices (MI) revealed poor model fit
among some item pairs and for that reason, two occupational efficacy items and three items
of perceived supervisor support were dropped. In addition, two coping items were removed,
which resulted in two of the coping factors having only two items each. As the two-item
factors were highly correlated with one another (r = .83), they were combined into a single
four-item factor. Fit of the resulting five-factor model with the remaining 26 items was good
( 2
265 = 837.30 (p<.001), RMSEA=.051, CFI=.959, TLI=.953). Correlations among the
self-judgment factors ranged from r = -.05 to .77.
Next, the five-factor model with 25 items was retested with a bifactor structure as a
way to confirm dimensionality (O’Connor-Quinn, 2014; Reise, Morizot, & Hays, 2007; Reise,
Scheines, Widaman, & Haviland, 2013). Fit statistics were not as good as the simple
structure ( 2
251 = 1171.27 (p<.001), RMSEA=.067, CFI=.934, TLI=.921). Four of nine items
from the supervisor support factor loaded less than .25 on the overall factor, and three of
four items from the second coping factor loaded less than .25 on their group factor.
Explained common variance (ECV) was also computed to assess the proportion of
variance on the specific factors attributable to the overall factor. While judgments about
appropriate values for ECV depend on both the number of items and the number of factors
in a model, typically, lower ECV suggests less relation to an overall factor and a greater
Haviland, 2013). ECV values for the five-factor bifactor structure ranged from very low (9%
for the supervisor support factor) to low (33% for one of the coping factors; 35% for
occupational efficacy) to moderate (68% and 79% for the remaining two coping factors).
This indicates that none of the five factors can be reliably represented by combining them
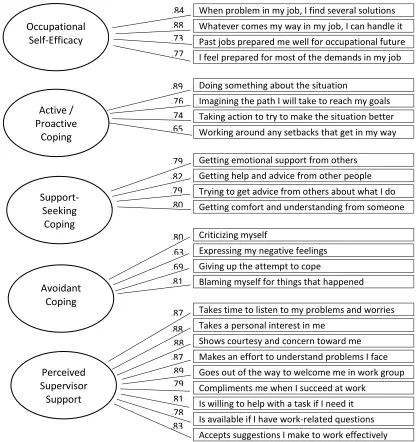
into an overall construct. Although the factors intercorrelate, they are best considered When problem in my job, I find several solutions Whatever comes my way in my job, I can handle it Past jobs prepared me well for occupational future I feel prepared for most of the demands in my job
Doing something about the situation
Imagining the path I will take to reach my goals Taking action to try to make the situation better Working around any setbacks that get in my way
Getting emotional support from others Getting help and advice from other people Trying to get advice from others about what I do Getting comfort and understanding from someone
Criticizing myself
Expressing my negative feelings Giving up the attempt to cope
Blaming myself for things that happened
Takes time to listen to my problems and worries Takes a personal interest in me
Shows courtesy and concern toward me Makes an effort to understand problems I face Goes out of the way to welcome me in work group Compliments me when I succeed at work
Is willing to help with a task if I need it Is available if I have work-related questions Accepts suggestions I make to work effectively .84 .88 .73 .77 .89 .76 .74 .65 .79 .82 .79 .80 .63 .69 .80 .81 .87 .88 .88 .87 .89 .79 .81 .78 .83
Figure 4. Final Self-Judgment Model: Simple Structure with Five Factors