ARTICLE
Evaluation of the Accuracy of Different Methods
Used to Estimate Weights in the Pediatric Population
Tsz-Yin So, PharmD, BCPSa, Elizabeth Farrington, PharmD, FCCP, FCCM, BCPSa, Randall K. Absher, PharmD, BCPSb
aDepartment of Pharmacy, University of North Carolina Children’s Hospital, Chapel Hill, North Carolina;bDepartment of Pharmacy, Moses Cone Health System,
Greensboro, North Carolina
The authors have indicated they have no financial relationships relevant to this article to disclose.
What’s Known on This Subject
Visual estimation of patients’ weight is often inaccurate. The Broselow tape is considered the gold standard. The Leffler formula is similar to the equations used in Pediatric Ad-vanced Life Support, and the Theron formula may be a better method for overweight children.
What This Study Adds
No studies exist in the United States that compare the Broselow tape, the Leffler formula, and the Theron formula. This study shows the differences in accuracy among these methods, predictors of weight estimation, and alternative weight-estimation models.
ABSTRACT
OBJECTIVES.The purpose of this study was to compare the predictive accuracy of 3 methods (Broselow tape, Leffler formula, and Theron formula) for pediatric weight estimation to identify factors that can influence weight estimation, and to derive alternative models for such estimation if indicated.
METHODS.This was a prospective, nonblinded observational study. Every patient in the cohort wasⱕ10 years of age. The patients’ age and height were used to estimate their weight by using the 3 previously mentioned methods. These estimated weights were compared with the patients’ actual weight by using the modified Bland-Altman method.
RESULTS.One thousand eleven subjects were included. Percent differences between predicted and actual weight were significantly less using the Broselow tape compared with other methods for patients weighing⬍10 or 10 to 25 kg and for the Theron formula compared with other methods for patients weighing⬎40 kg. For patients weighing 25.1 to 40 kg, performance of the Broselow tape and Leffler method were similar, and both were superior to the Theron formula. Three weight predictors (age, gender, and ethnicity) were identified, and 2 new weight-estimation models were derived from the cohort.
CONCLUSIONS.The Broselow tape is accurate for weight estimation in childrenⱕ25 kg, but the Theron formula performs better with patients weighing ⬎40 kg. The Broselow tape was not statistically superior to the Leffler formula in subjects weighing 25.1 to 40 kg. A separate cohort is needed to evaluate the validity of the alternative predictive formulae.Pediatrics2009;123:e1045–e1051
A
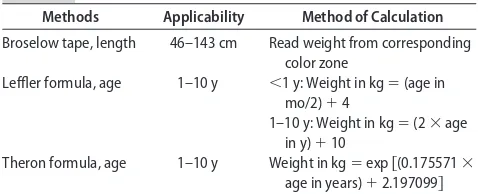
CCURATE WEIGHT ESTIMATIONis critical for calculating appropriate medication dosages, determining rates of fluid replacement, and selecting correct equipment sizes in pediatric patients undergoing resuscitation.1 Unfortu-nately, patients’ exact weight is often not known by the medical team during resuscitation. Moreover, as pointed out by Anglemyer and colleagues,2 visual estimation of patients’ weight is often inaccurate and unreliable. Various methods (eg, the Broselow tape, the Leffler formula, and the Theron formula) exist to estimate weights in the pediatric population (Table 1), but no published studies in the United States have compared the predictive accuracy of these 3 methods.The Broselow tape, which is usually stored in pediatric crash carts, can be used for weight estimation by positioning the patient supine and placing one end of the tape at the head and the other at the feet. The tape is divided into different color zones, each representing different weight range estimates. The Broselow tape, however, can only be used in pediatric patients with a height between 46 and 143 cm.
The Leffler formula is similar to the equations used in Pediatric Advanced Life Support.3This formula is divided into 2 mathematical equations according to the patients’ age (Table 1). This method is not used for patients⬎10 years of age, because rapid growth spurts and large variability in patients’ weight limit its accuracy in this group.
The other predictive method is the Theron formula (Table 1). This formula was developed in an Australian cohort by Theron and colleagues,4who hypothesized that it may provide superior estimation for overweight children.
The objectives of our study, which focused on patients 0 to 10 years of age, were to compare the predictive
www.pediatrics.org/cgi/doi/10.1542/ peds.2008-1968
doi:10.1542/peds.2008-1968
Key Words
pediatrics, body weight, estimation, Broselow, Theron, Leffler
Abbreviation
UNC—University of North Carolina
Accepted for publication Feb 12, 2009
Address correspondence to Tsz-Yin So, PharmD, BCPS, UNC Hospitals, Department of Pharmacy, 101 Manning Dr, CB 7600, Chapel Hill, NC 27514. E-mail: [email protected]
accuracy of these 3 weight-estimation methods, to iden-tify factors influencing weight-estimation accuracy, and to derive potential alternative models for weight estima-tion.
METHODS
Patients and Study Design
This was a prospective, nonblinded observational study. All subjects were inpatients at the University of North Carolina (UNC) Children’s Hospital from August 30, 2007, to June 2, 2008. Subjects aged 1 day to 10 years were included in the study.
Subjects were excluded if they had any medical con-dition that would substantially affect their weight and/or height: amputation or dwarfism; dehydration, volume overload, or edema; growth hormone deficiency; severe joint contractures; or neurologic defects (eg, cerebral palsy) that can affect growth. Patients in the NICU were also excluded.
The primary objective of this study was to evaluate the predictive accuracy of the 3 previously mentioned weight-estimation methods. The influence of selected covariates on predictive accuracy was also assessed.
The study was approved by the Committee for Hu-man Research Protection (institutional review board) at UNC Health Care, and full waiver of informed consent was granted.
Data Collection
All data were obtained from electronic and hard-copy medical charts at UNC Health Care. Once inclusion cri-teria were met, data elements, including demographic information, were abstracted from each subject’s medi-cal chart. Subjects’ ethnicity was coded on the basis of demographic information recorded in the WebCIS data-base (the UNC Health Care electronic medical chart). UNC Children’s Hospital policy requires measurement and documentation of height and weight for all admitted patients.
After obtaining this information, the subjects’ age or height was used to estimate their weight by using the Broselow tape, the Leffler formula, and the Theron for-mula. These estimated weights were then compared with subjects’ actual weight by plotting the data on modified Bland-Altman graphs. This comparison was made on the day of admission or the day after.
Statistical Analysis
On the basis of previous work by Black and colleagues,1 a sample size of 500 subjects with 120 subjects in each weight stratum was required to detect a difference in predictive accuracy between the 3 models.
Analysis of variance was performed on the percentage difference between predicted and actual weight values to assess the performance of the 3 weight-estimation meth-ods within predefined weight strata (⬍10, 10 to 25, 25.1– 40, and ⬎40 kg) and BMI strata (underweight, normal weight, and overweight). Significant findings within strata were further investigated with pairwise analyses by using the Tukey method to control for mul-tiple comparisons.
Generalized linear modeling was used to identify pa-tient factors influencing weight estimation. Generalized linear modeling using backward elimination was em-ployed to derive alternative multivariate weight-estima-tion models in the cohort. Modeling included assessment of potential 2-way covariate interactions.
All statistical tests were 2-sided. Computations were performed by using Stata 10.0 (Stata Corp, College Sta-tion, TX).
RESULTS
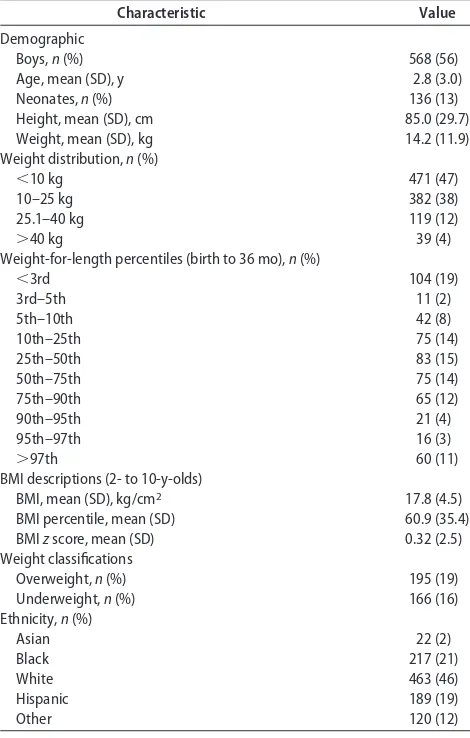
One thousand five hundred fifty-seven subjects were screened, and 1011 were included in the study. Demo-graphics of the cohort are listed in Tables 2 and 3.
Predicted Accuracy of Weight-Estimation Methods
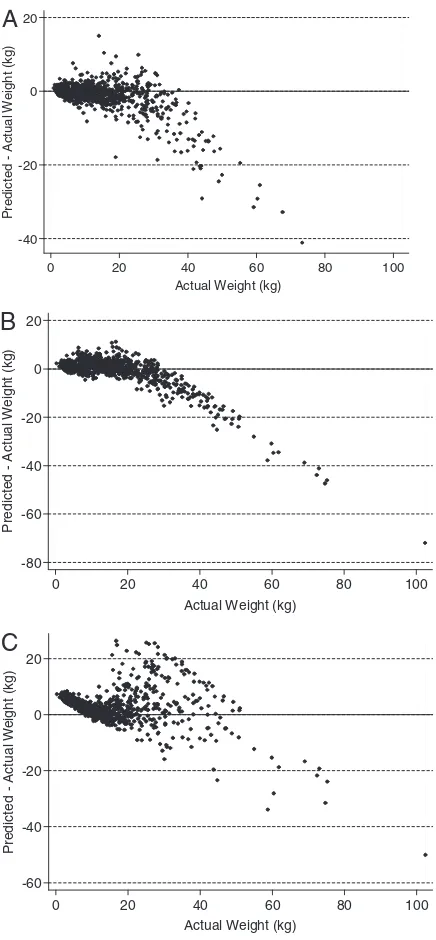
The percentage difference between predicted and actual weight was minimized by using the Broselow tape for patients within weight strata of⬍10, 10 to 25, or 25.1 to 40 kg. This difference in predictive accuracy was statis-tically significant in the first 2 strata; in the third, per-formances of the Broselow tape and Leffler formula were not statistically different, but both were superior to the Theron formula. In contrast, the Theron for-mula performed better for patients weighing ⬎40 kg (Table 4, Fig 1).
In a separate analysis, the cohort was divided into 3 weight classification strata: underweight (⬍5th weight-for-length percentile in subjects⬍2 years of age or BMI zscore of less than⫺1.65 in subjects ⱖ2 years of age),
normal weight, and overweight (⬎95th
weight-for-length percentile in subjects ⬍2 years of age or BMI z score of⬎1.65 in subjectsⱖ2 years of age). Under this method of stratification, predictive accuracy was supe-rior for the Broselow tape in normal weight subjects and the Leffler formula in overweight subjects. In under-weight subjects the Broselow tape was superior to the Theron formula but not significantly better than the Leffler formula. (Table 5).
Predictors of Weight Estimation and Proposed Alternative Estimation Models
In this cohort, 3 potential linear predictors of pediatric weight estimation were identified: age, gender, and eth-nicity. These predictors were identified during the de-TABLE 1 Weight-Estimation Methods in the Pediatric Population
Methods Applicability Method of Calculation
Broselow tape, length 46–143 cm Read weight from corresponding color zone
Leffler formula, age 1–10 y ⬍1 y: Weight in kg⫽(age in mo/2)⫹4
1–10 y: Weight in kg⫽(2⫻age in y)⫹10
velopment of 2 different statistical models based on the study data.
Linear Model
In this model the mean weight was expressed as a mul-tivariate linear function of predictive factors. As ex-pected, the model demonstrated that weight increased with age (P ⬍ .001), but visual inspection of an age versus weight plot demonstrated a nonlinear relation-ship unless infants and children were analyzed sepa-rately. The linear coefficient for age as a predictor of weight was 6.93 in infants and 3.1 to 3.48 in children.
Gender was also a predictor of weight. Boys weighed significantly more than girls in both age subgroups. After adjustment for other covariates, mean weight in infants was 0.24 kg larger for boys than girls (P⫽.006) and in children was 0.65 kg larger for boys than girls (P⫽.01) (Fig 2).
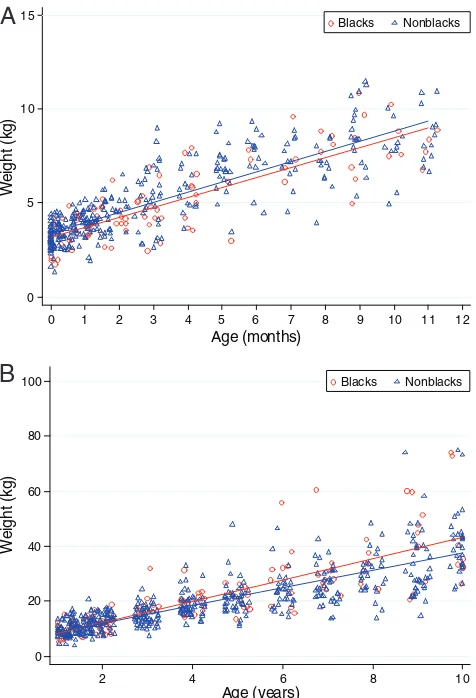
Another identified predictor of weight was ethnicity. Importantly, however, substantial differences in this cor-relation were observed for subjects of different ages. These observed differences reflected changes not only in magnitude of the correlation, but also in direction. After adjustment for other covariates, mean weight in black
infants was 0.22 kg less than for infants of other ethnici-ties (P⫽.047). In children, the opposite relationship was observed and the nature of the correlation was more complex. Specifically, for every 1-year increase in age, mean weight for black children was 0.38 kg larger than for nonblack children (P ⫽ .013). This interaction be-tween the age and ethnicity covariates corresponds to the nonparallel nature of the weight versus age regres-sion lines observed for black versus nonblack children (Fig 3).
The full version of this proposed linear model, with separate equations for infants and children to account for the nonlinearity of the weight-age correlation across the 2 subgroups (analogous to the Leffler approach), is provided in Table 6.
Log-Linear Model
An alternative log-linear model was also developed that allows use of the same predictive equation for both TABLE 2 Baseline Characteristics of Study Population (Nⴝ1011)
Characteristic Value
Demographic
Boys,n(%) 568 (56)
Age, mean (SD), y 2.8 (3.0)
Neonates,n(%) 136 (13)
Height, mean (SD), cm 85.0 (29.7)
Weight, mean (SD), kg 14.2 (11.9)
Weight distribution,n(%)
⬍10 kg 471 (47)
10–25 kg 382 (38)
25.1–40 kg 119 (12)
⬎40 kg 39 (4)
Weight-for-length percentiles (birth to 36 mo),n(%)
⬍3rd 104 (19)
3rd–5th 11 (2)
5th–10th 42 (8)
10th–25th 75 (14)
25th–50th 83 (15)
50th–75th 75 (14)
75th–90th 65 (12)
90th–95th 21 (4)
95th–97th 16 (3)
⬎97th 60 (11)
BMI descriptions (2- to 10-y-olds)
BMI, mean (SD), kg/cm2 17.8 (4.5)
BMI percentile, mean (SD) 60.9 (35.4)
BMIzscore, mean (SD) 0.32 (2.5)
Weight classifications
Overweight,n(%) 195 (19)
Underweight,n(%) 166 (16)
Ethnicity,n(%)
Asian 22 (2)
Black 217 (21)
White 463 (46)
Hispanic 189 (19)
Other 120 (12)
TABLE 3 Clinical Condition of Study Population (Nⴝ1011)
Comorbid Disease States n(%)
Bleeding 19 (2)
Burn 15 (1)
Cancers 52 (1)
Congenital heart disease 69 (7)
Congestive heart failure 1 (0.1)
Cystic fibrosis 29 (3)
Diabetes mellitus 15 (1)
Endocrine disorders 13 (1)
Failure to thrive 31 (3)
Gastrointestinal disorders 218 (22)
Genetic disorders 22 (2)
Hematological disorders 33 (3)
Hepatic dysfunction 38 (4)
Hypertension 15 (1)
Infections 246 (24)
Neurologic disorders 82 (8)
Other pulmonary diseases 148 (15)
Orthopedic-related problems 49 (5)
Psychiatric disorders 15 (1)
Pulmonary hypertension 4 (0.4)
Renal dysfunction 23 (2)
Trauma 13 (1)
Thyroid dysfunction 9 (1)
Others 18 (2)
TABLE 4 Performance Comparison of Weight-Prediction Methods According to Weight Stratum Patient
Weight, kg
n Percent Differenceain Predicted and
Actual Weight, Mean (SD)
P
Broselow Tape
Leffler Formula
Theron Formula
⬍10 471 0.2 (24) 24 (33) 106 (85) ⬍.001b
10–25 382 ⫺3.7 (16) 9.0 (17) 12 (26) ⬍.001c
25.1–40 119 ⫺12 (17) ⫺16 (14) 20 (34) ⬍.001d
⬎40 39 ⫺38 (12) ⫺44 (12) ⫺10 (23) ⬍.001d aCalculated as 100⫻(predicted weight⫺actual weight)/actual weight.
infants and children. In this method the logarithm of the mean weight was modeled as a multivariate linear func-tion of the predictive factors. This approach is equivalent to modeling the mean weight as a multivariate exponen-tial function of the covariates.
The same 3 factors, age, gender, and ethnicity, were identified as significant predictors of weight in this alter-native model. Because of its mathematical construct, however, the log-linear model demonstrated different quantitative relationships between the variables than the linear model.
As expected, age and weight were positively
corre-lated. Boys also demonstrated a positive correlation with weight. After adjustment for other variables, the mean weight in boys was 5.1% larger than in girls (P⫽.02). Black race and weight were also correlated, but again the nature of the relationship was complex and reflected statistical interaction between these 2 variables. Specifi-cally, mean weight increased by 25.6% for every 1-year increase in age for black patients, whereas the incremen-tal increase per year of age was 27.6% for nonblack patients (P⫽.03).
-40 -20 0 20 P red icted A c tua l W e ig ht ( k g)
0 20 40 60 80 100
Actual Weight (kg)
-80 -60 -40 -20 0 20 P redi c ted A c tual W e ig ht (k g)
0 20 40 60 80 100
Actual Weight (kg)
-60 -40 -20 0 20 P redi c ted A c tual W e ig ht (k g)
0 20 40 60 80 100
Actual Weight (kg)
A
B
C
FIGURE 1
Modified Bland-Altman plots for predictive accuracy of 3 weight-estimation methods: A, Broselow tape; B, Leffler formula; C, Theron formula. Analysis of predictive accuracy ac-cording to weight subgroups demonstrated validity of the Broselow tape in patients weighing up to 40 kg. In patients weighing⬎40 kg, the Theron formula was superior.
TABLE 5 Performance Comparison of Weight-Prediction Methods According to Weight-for-Length Classification Weight-for-Length
Classification
n Percent Differenceain Predicted
and Actual Weight, Mean (SD) P Broselow Tape Leffler Formula Theron Formula
Underweight 166 24 (29) 35 (40) 101 (105) ⬍.001b
Normal 650 ⫺3.0 (10) 11 (23) 56 (69) ⬍.001c
Overweight 195 ⫺28 (12) ⫺11 (28) 15 (48) ⬍.001c aCalculated as 100⫻(predicted weight⫺actual weight)/actual weight.
bP⬍.05 for Theron formula versus other methods. cP⬍.05 for each pairwise comparison.
0 5 10 15 We ig h t ( k g )
0 1 2 3 4 5 6 7 8 9 10 11 12
Age (months) Boys Girls 0 20 40 60 80 100 We ig h t ( k g )
2 4 6 8 10
Age (years)
Boys Girls
A
B
FIGURE 2
The full version of this proposed log-linear model (anal-ogous to the Theron approach) is provided in Table 6.
DISCUSSION
Accurate weight estimation in the pediatric population is vital during resuscitation; actual measurement of
pa-tients’ weight is often impossible. Previous investigations of the accuracy of parenteral estimation of children’s weight produced conflicting results. In 1 study, paren-teral estimates were within 10% of the subjects’ actual weight,3whereas in another study only 42% of weight estimates by parents were accurate.5Similarly, weight estimation by physicians and nurses is often inaccurate.5 Because of these shortcomings, an accurate method for weight estimation in pediatric patients is needed. Many estimation methods exist, but some may be obso-lete because, as pointed out by Lutfiyya and colleagues,6 the rate of childhood obesity is growing rapidly world-wide. In 2004, an estimated 9 million US children and adolescents 6 to 19 years of age were overweight, a number representing ⬃30% of this population.7 This trend helped prompt our current study.
In our study, the Broselow tape was a significantly better weight-estimation method compared with alter-natives for pediatric patients weighing ⱕ40 kg. It was not, however, statistically superior to the Leffler formula in subjects weighing 25.1 to 40 kg, and both methods became less accurate for patients in this weight stratum than for smaller patients. As subjects’ weight increased, both of these methods tended to underestimate weight. These findings are consistent with previous studies that identified underestimation of body weight by the Broselow tape in certain subgroups, especially older chil-dren and those weighing⬎20 kg.8,9
In the comparison of predictive accuracy of estima-tion methods in weight-for-length classificaestima-tion strata, several findings were notable. The Broselow tape esti-mated pediatric weight significantly better than other methods in patients with normal weight, whereas both the Broselow tape and the Leffler formula performed better than the Theron formula in underweight subjects. This observation is logical, because the researchers who developed the Theron formula hypothesized that it would perform better only in large-for-aged children.4 Nevertheless, the prediction errors for both the Broselow tape and the Leffler formula in the underweight group exceeded 20%, suggesting that none of the methods studied in this cohort are optimal for use in patients who are underweight for length.
Also of note, in overweight subjects weight was best estimated by the Leffler formula rather than the Theron
TABLE 6 Two Proposed Alternative Weight-Estimation Models and Mean Maximum Effect of Predictor Terms on Weight Estimation Using Proposed Models
Maximum Effect of Gender and Ethnicity Terms on Weight Estimation
Model A: analogous to the Leffler formula
For age⬍1 y Weight in kg⫽(6.93⫻age in y)⫹3.15⫹0.24 if boy⫺0.22 if black 0.24 kg For ageⱖ1 y and black subjects Weight in kg⫽(3.48⫻age in y)⫹5.61⫹0.65 if boy 4.5 kg For ageⱖ1 y and nonblack subjects Weight in kg⫽(3.1⫻age in y)⫹5.61⫹0.65 if boy
Model B: analogous to the Theron formula
For black subjects Weight in kg⫽exp [(0.228⫻age in y)⫹1.73⫹0.05 if boy] 23% For nonblack subjects Weight in kg⫽exp [(0.244⫻age in y)⫹1.73⫹0.05 if boy]
0 5 10 15
We
ig
h
t (
k
g
)
0 1 2 3 4 5 6 7 8 9 10 11 12
Age (months)
0 20 40 60 80 100
We
ig
h
t (
k
g
)
2 4 6 8 10
Age (years)
A
B
Blacks NonblacksBlacks Nonblacks
FIGURE 3
formula, although the latter performed better overall in the⬎40 kg subgroup (as discussed above). When over-weight subjects⬍2 years of age were excluded from the analysis, however, the Theron formula performed best. This discrepancy likely reflects the subjects’ weight dis-tribution in our data set, which contained a high pro-portion of subjects with large absolute weight values. This observation implies that the Theron formula might be suitable only for overweight patientsⱖ2 years of age, but this topic needs additional research.
We did not use correlation coefficients to compare the weight-estimation methods in this study because, as noted by Bland and Altman,10 correlation only “mea-sures the strength of a relation between 2 variables, not the agreement between them.” Plotting the difference between predicted and actual weight versus actual weight produces a more informative visual display, and comparison of this difference (expressed as a percentage) is a valid approach to assessing performance of estima-tion methods.
Three predictive factors for weight estimation were identified in this cohort: age, gender, and ethnicity. It is obvious that as patients grow older, they should weigh more. Growth rates, however, are different for patients
⬍1 year of age and thoseⱖ1 year of age. Infants typically triple their birth weight in their first year of life, with growth curves becoming less steep thereafter. This is likely the reason some weight-estimation methods, such as Leffler’s, divide the predictive formula into 2 equa-tions based on age, and is also consistent with the non-linearity observed in the overall weight-age relationship for our subjects.
The second factor influencing weight estimation in our cohort was gender. Boys weighed more than girls from birth to 10 years of age. This difference may be less clinically significant in children ⱖ1 year of age than younger patients, because in the former subgroup the adjusted difference in mean weight between boys and girls was 0.65 kg, a value representing only a small percentage of actual weight in older children. This is displayed in Fig 2B, which depicts the regression line for boys shifted up just 0.65 kg higher than for girls, an amount barely visible on the graph and likely not sub-stantial in older children.
The final predictor identified in the cohort was eth-nicity, and its relationships with weight and age were complex. In the infant subgroup, black subjects weighed less than those of other ethnicities and comparable age. This finding is consistent with previously published work. In a study of ethnic disparities in neonatal weight in Chicago neighborhoods, black subjects had a lower mean birth weight than non-Hispanic white and Mexi-can-Hispanic subjects.11 Moreover, more black subjects (13.4%) were of low birth weight (⬍2500 g) or very low birth weight (⬍1500 g, 2.7%) compared with non-His-panic white (4.8% and 0.9%, respectively) and Mexi-can-Hispanic (4.4% and 0.8%, respectively) subjects. In older children, however, our cohort demonstrated that adjusted mean weight for black subjects was greater than for subjects of other ethnicities and that the magnitude
of this effect depended on patient age, with a larger effect observed as age increased.
One limitation to this study is that Asian subjects only comprised 2% of the study population. Ramarajan et al12 stated that the Broselow tape may overestimate weight by
⬎10% in children of Indian decent. Because of this, addi-tional studies are needed to evaluate the reliability of weight-estimation methods used in the Asian population. Finally, 2 alternative weight-estimation models were developed in this study. One model (A, linear) is analo-gous to the Leffler formula, and the other (B, log-linear) is analogous to the Theron formula. Different age coef-ficients for black versus nonblack subjects were used in the ⱖ1 year of age subgroup of model A and for the entire cohort in model B because of the age-ethnicity interaction, as previously described. The nonparallel na-ture of the regression lines for black and nonblack in subjectsⱖ1 year of age provides visual evidence of this phenomenon (Fig 3B). As an alternative to separate age coefficients, one could propose a single formula that includes an additional multiplicative term “ethnicity⫻ age” (with its own coefficient), where ethnicity is as-signed a value of 1 for black subjects and 0 for other subjects, but clinicians rarely think in this manner.
To examine the practical necessity of including the gender and ethnicity factors in the models, we also cal-culated the maximum impact these factors could have on weight estimation. In the infant subgroup of model A, the maximum effect of gender and ethnicity was 0.24 kg. Although small, a weight difference of 0.24 kg in neonates can represent a substantial portion of actual weight. For older children in model A, the maximum effect of predictors varied with age because of the age-ethnicity statistical interaction. Maximum effects of 1 kg were predicted for 1-year-olds and 4.5 kg for 10-year-olds. Similar effects were predicted in model B, but because of its log-linear structure, values are expressed as percentage increases rather than absolute increases in weight. Being “overweight” is not included as a term in the models, because accurate determination of weight-for-height percentile by quick visual estimation can be quite difficult. These new models could potentially pro-vide modest improvement over standard methods but would require validation in a separate cohort before use. The practicality of these proposed new methods also needs assessment.
Our study was not without limitations. Subjects’ weights in the cohort were unevenly distributed, with a majority of subjects weighing ⬍25 kg. Also, most pa-tients were younger than 2 years of age and most were white. We had planned to obtain data on at least 120 subjects in each weight stratum.1The number of subjects (39) in the ⬎40-kg stratum did not meet this target. Even so, a significant difference in estimation method performance was identified in that subgroup. Ideally, this finding should be verified in a larger cohort.
CONCLUSIONS
years of age who were of normal weight for length and weighedⱕ25 kg. The Broselow tape was not statistically superior to the Leffler formula in subjects weighing 25.1 kg to 40 kg. Better methods should be developed to provide accurate weight estimation in overweight chil-dren because of the increasing rate of obesity in our nation and across the world. The new models developed in this study could potentially provide a modest im-provement over standard methods but would require validation in a separate cohort before clinical use.
ACKNOWLEDGMENTS
We acknowledge Dennis Pfeiffer (pharmacy operation spe-cialist at UNC Hospitals) for providing us with inpatient data for our study and Stephen Eckel (director of pharmacy residency programs at UNC Hospitals), John Valgus (direc-tor of pharmacy specialty residency programs at UNC Hos-pitals), and Kamakshi Rao (coordinator of the pharmacy residency programs at UNC Hospitals) for clinical advice and suggestions in designing our study.
REFERENCES
1. Black K, Barnett P, Young S. Are methods used to estimate weights in children accurate? Emerg Med (Fremantle). 2002; 14(2):160 –165
2. Anglemyer BL, Hernandez C, Brice JH, Zou B. The accuracy of visual estimation of body weight in the ED.Am J Emerg Med.
2004;22(7):526 –529
3. Leffler S, Hayes M. Analysis of parental estimates of children’s weights in the ED.Ann Emerg Med. 1997;30(2):167–170 4. Theron L, Adams A, Jansen K, Robinson E. Emergency weight
estimation in Pacific Island and Maori children who are large-for-age.Emerg Med Australas.2005;17(3):238 –243
5. Harris M, Patterson J, Morse J. Doctors, nurses, and parents are equally poor at estimating pediatric weights.Pediatr Emerg Care.
1999;15(1):17–18
6. Lutfiyya MN, Garcia R, Dankwa CM, et al. Overweight and obese prevalence rates in African American and Hispanic children: an analysis of data from a 2003–2004 national survey of children’s health.J Am Board Fam Med.2008;21(3):191–199 7. Institute of Medicine. Childhood obesity in the United States: facts and figures. September 2004. Available at: www.iom.edu/ Object.File/Master/22/606/FINALfactsandfigures2.pdf. Ac-cessed May 22, 2008
8. Hofer CK, Ganter M, Tucci M, et al. How reliable is length-based determination of body weight and tracheal tube size in the pediatric age group? The Broselow tape reconsidered. Br J Anaesth. 2002;88(2):283–285
9. DuBois D, Baldwin S, King W. Accuracy of weight estimation methods for children.Pediatr Emerg Care.2007;23(4):227–230 10. Bland JM, Altman DG. Statistical methods for assessing agree-ment between two methods of clinical measureagree-ment.Lancet.
1986;1(8476):307–310
11. Sastry N, Hussey JM. An investigation of racial and ethnic disparities in birth weight in Chicago neighborhoods. Demogra-phy.2003;40(4):701–725
12. Ramarajan N, Krishnamoorthi R, Strehlow M, Quinn J, Ma-hadevan SV. Internationalizing the Broselow tape: how reli-able is weight estimation in Indian children.Acad Emerg Med.
DOI: 10.1542/peds.2008-1968
2009;123;e1045
Pediatrics
Tsz-Yin So, Elizabeth Farrington and Randall K. Absher
Pediatric Population
Evaluation of the Accuracy of Different Methods Used to Estimate Weights in the
Services
Updated Information &
http://pediatrics.aappublications.org/content/123/6/e1045
including high resolution figures, can be found at:
References
http://pediatrics.aappublications.org/content/123/6/e1045#BIBL
This article cites 11 articles, 1 of which you can access for free at:
Subspecialty Collections
http://www.aappublications.org/cgi/collection/standard_of_care_sub
Standard of Care
_management_sub
http://www.aappublications.org/cgi/collection/administration:practice
Administration/Practice Management following collection(s):
This article, along with others on similar topics, appears in the
Permissions & Licensing
http://www.aappublications.org/site/misc/Permissions.xhtml
in its entirety can be found online at:
Information about reproducing this article in parts (figures, tables) or
Reprints
http://www.aappublications.org/site/misc/reprints.xhtml
DOI: 10.1542/peds.2008-1968
2009;123;e1045
Pediatrics
Tsz-Yin So, Elizabeth Farrington and Randall K. Absher
Pediatric Population
Evaluation of the Accuracy of Different Methods Used to Estimate Weights in the
http://pediatrics.aappublications.org/content/123/6/e1045
located on the World Wide Web at:
The online version of this article, along with updated information and services, is
by the American Academy of Pediatrics. All rights reserved. Print ISSN: 1073-0397.